Time-of-flight thermal flowrate sensor for lab-on-chip applications
Helene
Berthet
*a,
Jacques
Jundt
a,
Jerome
Durivault
a,
Bruno
Mercier
b and
Dan
Angelescu
b
aSchlumberger-Doll Research, 1 Hampshire street, Cambridge, 02139, USA. E-mail: hberthet@slb.com
bESYCOM, ESIEE Paris, 2 Bd Blaise Pascal, 93162, Noisy-le-Grand, France
First published on 12th November 2010
Abstract
We describe a thermal microflowrate sensor for measuring liquid flow velocity in microfluidic channels, which is capable of providing a highly accurate response independent of the thermal and physical properties of the working liquid. The sensor consists of a rectangular channel containing a heater and several temperature detectors microfabricated on suspended silicon bridges. Heat pulses created by the heater are advected downstream by the flow and are detected using the temperature detector bridges. By injecting a pseudo-stochastic thermal signal at the heater and performing a cross correlation between the detected and the injected signals, we can measure the single-pulse response of the system with excellent signal-to-noise ratio and hence deduce the thermal signal time-of-flight from heater to detector. Combining results from several detector bridges allows us to eliminate diffusion effects, and thus calculate the flow velocity with excellent accuracy and linearity over more than two orders of magnitude. The experimental results obtained with several test fluids closely agree with data from finite element analysis. We developed a phenomenological model which supports and explains the observed sensor response. Several fully functional sensor prototypes were built and characterized, proving the feasibility and providing a critical component to microfluidic lab-on-chip applications where accurate flow measurements are of importance.
1 Introduction
We describe a flow-measurement technology that is suitable for miniaturized lab-on-chip devices and which allows very accurate linear time-of-flight flow measurements to be performed in a microchannel, over a wide range of flow rates, and independent of fluid properties. Flowrate measurements are of utmost importance in many scientific and industrial applications involving process control (e.g., analytical chemistry, chemical engineering, combustion engine applications) or flow metering (e.g., biomedical applications such as drug delivery, blood flow, and respiration; gas and fuel meters; air conditioning). Microelectromechanical systems (MEMS) technology has been applied for many years to the microfabrication of flow measurement sensors for either gas or liquid flow.1,2 More recently, with the advent of microfluidic technology, several efforts have been directed at integrating flow measurement sensors within microchannels of tens to hundreds of micrometers in diameter.3 Several measurement principles have been used to this end, employing techniques as diverse as thermal anemometry, calorimetry and/or time of flight,5–7 differential pressure,9,10and the Coriolis effect.11,12 A wide array of manufacturing techniques has been used for manufacturing miniaturized flow sensors, ranging from traditional silicon/glass MEMS technology to microfabrication using polymeric materials.Among flow-measurement microsensors, those based on thermal techniques stand out through their simplicity in both the fabrication process and subsequent sensor conditioning and measurements.4 However, traditional thermal sensing methods, such as anemometry and calorimetry, suffer from a number of specific drawbacks: sensitivity to fluid properties (most notably, viscosity, thermal conductivity, and heat capacity) and nonlinearity of sensor response. Several studies looked at the possibility of measuring fluid velocity using thermal time-of-flight methods in either macroscopic systems (in which the method was called “pulsed wire anemometry”)13,14 or, more recently, in microchannels.6,8 The principle of the time-of-flight method relies on injecting a disturbance (e.g., a thermal pulse) in the fluid at a point A and measuring its effect at a point B situated downstream. The time between injection at A and detection at B must, to first order, be proportional to flow velocity. However, fluid dependence and nonlinearity were not eliminated completely by using time-of-flight approaches, because of a number of effects related to longitudinal diffusive spreading of the thermal pulse, to conduction through boundary layers, and to finite detector-response time.8,15 Depending on which effect is predominant, the measured time of flight may be shorter or longer than the actual fluid travel time between A and B in the absence of the sensor. These effects were investigated both theoretically and experimentally in the macroscopic regime, and several models were considered to explain the nonlinearities.15 Related recent work on macroscopic phase-shift thermal-wave anemometry sensors shows promising preliminary results,16 potentially eliminating nonlinearities and dependence on fluid properties.
One important issue of time-of-flight techniques is the requirement to inject enough thermal energy at point A into the flow to be able to detect it at point B downstream. Longitudinal heat diffusion, Taylor dispersion, and conduction through channel walls all contribute to the rapid decay of the peak temperature of the pulse. To overcome this inconvenience, one can increase the heating at point A, which will improve signal levels at the detector. However, this can lead to significant temperature excursions in the fluid, including fluid boiling at the heater. Overheating may have adverse effects in many applications, e.g., those involving biological samples. Alternatively, instead of a single pulse, one can inject a quasi-stochastic signal into the flow, and perform the cross-correlation between the detected signal and the injected one to determine the phase shift (or time of flight). The use of stochastic signals, and more specifically m-sequences, allows the power of a single pulse to be spread over the duration of the stochastic signal. This method has been applied in the past to improve the signal-to-noise ratio in time-of-flight measurements,17 particularly in macroscopic systems in which signal levels were limited by environmental or medical reasons (e.g., sonar measurements in fisheries18 and in vivo blood-flow monitoring19).
There are other operation modes of such sensors that can be used in conjunction with the time-of-flight measurements. The constant-temperature operation enabled by the feedback electronics can provide anemometry data, thus extending the range of operation to gas flows, or allowing simultaneous determination of fluid thermal properties such as thermal conductivity. Additionally, since the device consists of several heater-detector bridges, calorimetric operation is also possible. In the present manuscript we restrict our analysis to time-of-flight measurements.
The technique we present here implements, for the first time, a stochastic time-of-flight measurement in a microfluidic device. This method allows accurate signal detection with high signal-to-noise ratio for variations in the heater temperature of only a few degrees Celsius. To demonstrate this method we built a robust glass/silicon/glass microsensor implementing suspended MEMS heater and detector bridges across a microchannel. The suspended bridge geometry greatly reduces the problems related to heat conduction through boundary layers and through the substrate that are typically encountered in sensors implementing membrane-type wall heaters. To achieve linearity and eliminate dependence on fluid properties, we operate the sensor in a regime in which longitudinal diffusion effects are negligible, and we perform measurements using several sequential detector bridges. We obtain a maximum turn-down ratio of approximately 1400![[thin space (1/6-em)]](https://www.rsc.org/images/entities/char_2009.gif) :1, with a linear response region extending over more than two orders of magnitude and which is independent of fluid properties such as viscosity and thermal conductivity. In the higher decade of flow rates investigated, the sensor still performed a measurement but with significantly reduced accuracy. We favorably compare experimental data with results from computational fluid dynamics simulations, and we develop a surprisingly accurate phenomenological model to account for the observed sensor behavior and to predict the limits of this technology.
:1, with a linear response region extending over more than two orders of magnitude and which is independent of fluid properties such as viscosity and thermal conductivity. In the higher decade of flow rates investigated, the sensor still performed a measurement but with significantly reduced accuracy. We favorably compare experimental data with results from computational fluid dynamics simulations, and we develop a surprisingly accurate phenomenological model to account for the observed sensor behavior and to predict the limits of this technology.
2 Measurement technique
The time-of-flight measurement uses a pseudo-stochastic sequence of very short heat pulses injected at a first bridge suspended across a microchannel (the heater) and that we detect downstream when they reach two other bridges (the detectors). To increase the signal-to-noise ratio, and hence the accuracy of the measurement, we use a sequence of pulses which are coded using the mathematical structure of an m-sequence and take advantage of its compact auto-correlation function. Mathematically, an m-sequence20 of order N is defined as a sequence of 2N − 1 integers ai that can take the value of +1 or −1 and satisfy the following autocorrelation relation: | (1) |
Such sequences show low correlation values with any of their circular permutations except the identity. If we code our heater signal to generate heat pulses according to such a sequence, we obtain a thermal m-sequence which propagates downstream of the heater by advection. Cross-correlation of the pulses received on the detector with the initial sequence sent to the heater leads to a signal with a high value corresponding to the time of flight and a very low value at any other time (this is the equivalent of an extremely accurate phase-shift measurement). Therefore, by using an m-sequence coding scheme, we distribute the signal power over the full duration length of the m-sequence, thus minimizing instantaneous power and temperature excursion while preserving highly accurate phase information. This technique leads to significant improvements in the signal-to-noise ratio of the measurement. In particular, using an m-sequence of pulses and cross-correlating the detector response with the injected signal provides similar noise reduction as averaging the individual pulses in the sequence, i.e. a factor of  for a sequence of P pulses.
An example of an m-sequence adapted to the thermal sensor is the following: a series of heat pulses of duration ΔT is injected by the heater at times ti = i·ΔT corresponding to ai = +1 being encountered in the sequence; no pulse is generated for ai = −1. This injection function is represented in eqn (2). A continuous periodic pulse train of period Tseq = (2N − 1) * ΔT can be built by resetting the counter i every time it reaches value 2N − 1 (which corresponds to the end of the m-sequence).
 | (2) |
Finally, cross-correlation of the injection sequence with the signals recorded f(t) at the detectors downstream is performed (eqn (3)); the maximum of the cross-correlation function will correspond to the pulses' time of flight.
 | (3) |
The range of flowrates detectable using this technique is limited by the two time parameters Tseq and ΔT, the first limiting the minimum detectable flowrate and the latter the maximum flow velocity; one should try to maximize Tseq whilst minimizing the pulse duration ΔT according to the sensitivity of the detectors and the acquisition data rate and processing power that the electronics make accessible—effectively, this requirement is equivalent to using the highest order m-sequence possible.
Another limitation of the measurement comes from the physics of flow around obstacles in the channel. The heat, once injected at the heater element, will need to travel through the stationary boundary layer around the heater (by diffusion) before reaching the higher velocity streamlines which contribute to advection. At the detector end, a similar diffusive process is required for the thermal signal to reach the detector through its own boundary layer. Fig. 5 shows these boundary layers graphically, as obtained from finite-elements analysis (FEA). The times associated with diffusion are largely flowrate independent and will lead to nonlinearities in the flow-velocity measurement. We will see below that these nonlinearities are theoretically avoided if the time of flight between the two detectors is used instead of that between the heater and the detector. In this case, the diffusion times through boundary layers are cancelled by each other. We will see how the experimental data and the FEA confirm this prediction.
3 Experimental
3.1 Fabrication
The flowrate sensor was fabricated using bulk micromachining of a silicon-on-insulator (SOI) wafer, anodically bonded between two glass wafers. The SOI-device layer (thickness, 20 μm) was used to define the 20-μm-wide heater bridges, which extend across the 500-μm-wide channel. Ti-Pt traces running on the bridges define the resistive heaters and temperature detectors, with resistance of 30 Ω. The metal traces were buried within an oxide layer thermally grown on the device layer, which was required for planarization, enabling subsequent anodic bonding of the glass wafers. The fluidic channel, which was dry etched in the handle of the SOI (thickness, 50 μm), was encapsulated between two glass wafers (Pyrex 7740). The bottom Pyrex wafer (500-μm thick) incorporated wet-etched fluidic inlet and outlet through-holes, whereas the top Pyrex wafer (300-μm thick) incorporated wet-etched electrical connection through-holes, as well as the partially etched (50-μm deep) top of the fluidic channel. The silicon heater and detector bridges (20 μm × 20 μm × 500 μm) were thus suspended midway across the fluidic channel (100 μm × 500 μm × 1 cm). Final device assembly consisted of bonding the three wafer glass-SOI-glass stack using two sequential anodic bonding steps. A schematic of the device is shown in Fig. 1. | ||
| Fig. 1 Panel a: Schematic 3D rendering of flowrate sensor geometry, shown bisected by the symmetry plane of the channel. The heater and detector bridges are suspended in the middle of the 100 μm tall channel. The lateral spacing of the bridges was 500 μm. Panel b: Micrograph of the fabricated sensor. The three bridges to the right (spaced 500 μm apart) were used for the measurements. | ||
3.2 Setup and fluids
The chip was placed on a Leica inverted microscope for direct observation of the channel and control of dirt, bubbles, or possible broken bridges. The flow circuit consisted of an external syringe pump (KD Scientific) imposing the flow using a glass syringe (SGE) connected to the channel using microfluidics connections (Upchurch Scientific). Glass syringes were generally preferred to plastic ones to avoid irregularities at low flowrates due to friction between the piston and the syringe walls; glass syringes may introduce other issues, however, as the lack of compliance and the segmented motion of the piston due to the syringe stepper motor may also lead to flow non-uniformities. A proper compromise needs to be found between these disadvantages by using, for example, compliant tubing.The fluids tested were hexadecane and isopropanol (C16H34, C3H7OH, Sigma Aldrich), as well as hydrocarbon viscosity standard fluids (Cannon Instrument Co). The experimental and numerical results included in this manuscript correspond to hexadecane, however similar results were obtained in all the fluids tested. The lack of insulation on the heater bridges prevented testing using conductive fluids like water, which incidentally is a fluid with very different thermal properties from all the other fluids tested. In order to verify the response in water, CFD simulations were performed using hexadecane and water as the working fluids.
For the range of flowrates explored in our experiments (10 to 14000 μL min−1) the corresponding Reynolds numbers remained below 10−3; the flow was, therefore, fully developed and laminar in the channel. The thermal Peclet number was between 7 and 5000; thermal effects were generally dominated by convection but we saw that diffusion perturbs the measurement at the lowest flowrates.
3.3 Electronics
The heater temperature is modulated using a standard anemometry circuit using a closed feedback loop21 which allows precise control over the heater temperature. The temperature modulation used in most experiments was of 5 degrees, which insures, on one hand, that the fluid properties do not vary significantly, and, on the other hand, that any biological samples that may be in the channel are unaffected by the heating. The feedback loop has the added advantages that it provides simultaneous anemometric information and that it protects the heater and surrounding fluid from overheating. The detector electronics consist of a balanced Wheatstone bridge with a highly amplified output. When a heat pulse reaches the detector, it creates an increase in its temperature, and hence in its resistance. The Wheatstone bridge transforms the slight resistance change into a voltage signal, which is recorded into a PC using an acquisition card (National Instruments USB DAQ); the PC is then responsible for performing the cross-correlation between the injected m-sequence and the detected voltage signal and determining the time of flight, corresponding to the maximum of the cross-correlation. The maximum voltage applied to the heater was 10 V, resulting in a maximum of power dissipation of 3.3 W. The total electrical energy required to perform a measurement was approximately 300 mJ. Simulation results, shown graphically in Fig. 7, show how a large fraction of this energy was dissipated into the chip itself.4 Results and discussion
4.1 Experimental results
For each imposed flowrate at the pump, we send m-sequences of heat pulses at the heater bridge and record the signals at the two detector bridges. These bridges are suspended across the 500μm-wide, 100μm-thick microchannel at mid-height. Typical cross-correlation data are presented in Fig. 2 for the two detectors and for two imposed flow velocities. Sharp peaks are obtained at the first detector at times equal to the total travel time, corresponding to sum of the time of flight and the diffusion time. One can also notice a lower and flatter peak in the case of the second detector (particularly at lower flow velocities), which is due to dissipation of heat from conduction through the channel walls. These effects will limit the measurement accuracy at low flowrates; however, the signal from the first detector will usually remain high enough even at low velocities to obtain an accurate estimate of the time of flight. | ||
| Fig. 2 Cross-correlation signals obtained from the two detectors in experiments with an imposed flowrate of 200 and 1000 μL min−1 (66 and 333 mm s−1, respectively) at the syringe pump. | ||
The position of the maxima of the cross-correlation functions provides the travel times corresponding to each detector which are used to estimate the heat-pulse travel velocity. Results of measured heat velocities are presented in Fig. 3, in which they are plotted versus the imposed flowrate at the syringe pump (the flowrate is also expressed as the average velocity the channel). For these graphs, heat velocity is simply calculated by dividing the distance separating the bridges (500 μm or, respectively, 1 mm) by the measured travel time extracted from the cross-correlation signal maxima. As the heater and detectors are placed at midheight, the measured heat velocity corresponds to the velocity at the middle of the channel. The red-diamond data points correspond to the heat velocity obtained considering the time of flight between the heater and the first detector, and the blue-triangle data points correspond to time of flight between the heater and the second detector. Both curves are nonlinear at high flowrates, and they do not overlap; the first detector shows a larger deviation from linearity, corresponding to a longer contribution of the diffusion time to the total travel time. To obtain a more linear response we combined the results from the two detectors and extracted the heat velocity by dividing the detector spacing (500 μm) by the difference between the two travel times (green-square data points). As explained above and as seen on the graph, this approach effectively eliminates the nonlinearities caused by diffusion times through the stationary layers, and leads to a very good linear fit (shown over the 10 to 250 mm s−1 range in Fig. 3 with an R2 value of 0.9994). Similar results were obtained with isopropanol and the hydrocarbon viscosity standards using the same sensor geometry.
 | ||
| Fig. 3 Experimental heat velocity results calculated from the time of flight of the heat pulse from the heater to the first detector (red diamonds) or to the second detector (blue triangles). The flow is expressed as both a volumetric flowrate (top axis) and as the average fluid velocity in the channel. Using a differential measurement with the two detectors we can effectively eliminate the nonlinearity. The green squares correspond to the two detectors combined and were fitted by a linear curve represented as a dashed line. All curves are fitted according to the phenomenological model presented in the Discussion section. Excellent accuracy is found with the corresponding fit parameters c which characterizes the diffusion velocity inside the boundary layers around each bridge element. | ||
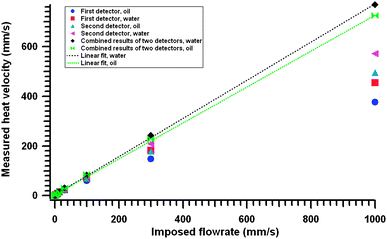
We present similar results for the heat velocity obtained with another sensor of the same design (sensors A and B), as well as with a slightly different sensor geometry (sensor C) in Fig. 4. The channel height in this case is increased from 100 μm to 560 μm, with the bridges still suspended in the middle. The spacings between the heater and detector bridges remained the same as in the initial geometry. This modified geometry has the effect of significantly improving the range of flowrates (which now extends from 10 to more than 10000 μL min−1) with a slope which is 5.5 times smaller than in the smaller channel sensor (R2 value of 0.9993, over the range 10–1000 μL min−1). It is interesting to note the excellent overlap of the data from all sensors when the geometrical differences are factored out.
 | ||
| Fig. 4 Experimental heat velocity results obtained with three sensors. Sensors A and B have the same geometry (the corresponding data in square and triangle markers overlap very well over the range of flowrates). Sensor C has a different geometry: the flow channel height was increased from 100 μm to 560 μm. The top-left graph shows the excellent linear response over two orders of magnitude of the imposed flowrate. The results from the two sensor geometries overlap very well when plotted versus the average flow velocity instead of the flowrate, as can be seen on the bottom-left graph. Results of sensor C over three orders of magnitude in flowrate are presented in the top-right graph. The reduced accuracy and the nonlinearities at very high flowrates are likely due to irregularities coming from the pumping setup rather than from sensor imperfections—at such high flow speeds, the time required to establish a uniform flow rate in the device was comparable to the time it took to empty the syringe. | ||
The technology presented here is very versatile. Several other geometrical changes can be implemented, depending on what aspect of the sensor response needs improvement. One particular change which could have huge a impact on the sensitivity of the device is the use of thinner heater and detector bridges, with lower thermal inertia; we attempted a fabrication of 6 μm thick silicon bridges, but they bent and broke because of the accumulated stresses in the thin film pile.
4.2 CFD simulations
Computational fluid dynamics (CFD) simulations were run on the commercial FEA software packages Ansys (Flotran package) and Comsol. We used a two-dimensional equivalent of the geometry of the sensor (representing a longitudinal cut through the middle of the channel in a direction perpendicular to the bridges). This two-dimensional representation is appropriate given that the width of the channel is approximately an order of magnitude larger than its height. We imposed a wide range of flowrates at the input (three orders of magnitude in flowrate were investigated). The two-dimensional geometry consisted of a rectangular channel (5-mm long, 100-μm tall) with three suspended square elements (20-μm long) placed in the middle of the channel at 2 mm, 2.5 mm and 3 mm from the inlet line, representing the heater and the two detectors. We show on Fig. 5 the 2D mesh with triangular nodes (100 nodes on the elements walls, 500 on the channel walls) along with a view of the two-dimensional geometry. | ||
| Fig. 5 2D geometry (left) and mesh (right) of the microfluidic thermal sensor in Ansys simulations. The left schematic shows the diffusion and advection phases of the thermal pulse travelling downstream. The background of the schematic is extracted from simulation with an imposed velocity of 0.333 m s−1 on the inlet line. Results of velocity is color coded from black (lowest) to white (highest). | ||
No-slip boundary condition was applied on all walls (channel and elements). We set a purely horizontal velocity condition on the inlet and a zero pressure difference condition on the outlet line.
The flow and thermal equations were solved separately. First, a steady-state computation was run, and only the flow equations were solved for one imposed velocity on the inlet line. This gave us the velocity profile which developed inside the channel; flow and thermal equations could be decoupled since we made the simplifying assumption that the physical fluid properties (density, viscosity, thermal conductivity, and heat capacity) did not vary within the narrow range of temperature variation used in the experiments (the maximum temperature excursion at the heater was of 5 degrees, and was controlled using a closed feedback loop). Once the steady-state analysis was completed, we ran a transient computation solving the thermal equations and using the steady-state flow profile. We imposed a fixed temperature on the heater for the duration of one pulse, and afterward we remove this temperature condition and let the solver compute the diffusion-advection equations for the heat pulse downstream.
Fig. 6 compares the low- and high-velocity regimes in terms of heat dissipation within the first time steps following the heat pulse. In each case, four pictures are extracted from Ansys simulations at an initial time (end of heat pulse) then 0.2, 0.6 and 0.8 ms later. Heat dissipation in the transverse direction from the heater-bridge to the lateral walls leads to significant loss of thermal energy inside the channel and eventually leads to the low-velocity limitations observed experimentally. We also present two shapshots extracted from Ansys simulations corresponding to the same low (0.067 m s−1) and high (0.333 m s−1) fluid velocities in Fig. 7. The difference between this and the previous figure is that the grayscale is now calculated for each time step individually. In other words, white always codes for the highest temperature calculated on all nodes of the geometry, but this maximum temperature decreases in time from heat dissipation. This view allows us to see the propagation of the heat pulse downstream towards and past the first detector and highlights the transverse heat dissipation.
 | ||
| Fig. 6 Successive snapshots extracted from Ansys simulations at low velocity, 67 mm s−1 (left column) and high velocity, 333 mm s−1 (right column). In each case the top picture was extracted at the end of the heat pulse (1 ms) and the pictures below correspond to 0.2, 0.6, and 0.8 ms later. Temperature is colored in grayscale. | ||
 | ||
| Fig. 7 Successive snapshots extracted from Ansys simulations at low velocity, 67 mm s−1 (left column) and high velocity, 333 mm s−1 (right column). Temperature results are coded in grayscale and the color map is rescaled for each figure where we also specify the value of maximum temperature (maxT). For both cases, the third panel corresponds to the moment of maximum temperature at the first detector. The heat pulse reaches the detector with less dissipation in the high velocity range. | ||
We extract the temperature peak time on both detectors from the simulations in order to compute a heat velocity and plot it versus the imposed flow velocity on the injection line, performing the same analysis as with the experiments. The results of simulations ran for oil (fluid and thermal properties of hexadecane) are presented in Fig. 8 with both velocities plotted in mm s−1. The corresponding Peclet number remains between 20 and 360 in this range of flow velocity. Excellent linearity is achieved when using the two detectors results' (slope of 1.03 and R2 value 0.9992). The resemblance of the CFD data with the experimental data is striking.
 | ||
| Fig. 8 CFD simulations results of heat velocity plotted versus the imposed velocity on the entry line. Similarly to the experimental results, we show the data computed from the results on the heater and one detector (triangle and diamond markers). Linearity is achieved when results from the two detectors are combined (blue square elements linearly fitted with the dotted line). We compare the computation results with the phenomenological model discussed below with the diffusion parameters c. | ||
We performed similar simulations using water as the flowing fluid to study the influence of the thermal properties on the sensor. Fig. 9 compares the results obtained with oil and water for each detector and when the detectors are combined. The results obtained with water (black diamond data, with time-of-flight calculated between the two detectors) and the ones for oil (green data) overlap very well for flowrates up to 300 mm s−1. At 1000 mm s−1, the difference between the two curves is less than 6 percent whereas for the same flowrate, considering only the first detector, the difference between oil and water goes up to 17 percent. Combining the two detectors leads to a linear response independent of the fluid properties such as viscosity and thermal properties. Experiments of the sensor in water could not be performed due to electrochemical effects on the bridges.
 | ||
| Fig. 9 Comparison of CFD simulations results of heat velocity for oil and water. Results from each detector are reported, and the data from the combined detectors is linearly fitted (dotted lines). We see that, while the response from a single detector for either oil or water are very non-linear, the two-detector results are linear. Additionally, using the two detectors, the response of the sensor becomes largely independent of the fluid nature (error of only 6%). Note that this simulation is for a slightly different geometry than that shown in Fig. 8, the bridges now being slightly offset from the center of the channel to account for some manufacturing imperfections; this results in a slightly lower measured velocity, hence the different slope of the fit line. | ||
4.3 Phenomenological model
This section will introduce a phenomenological model to provide theoretical explanations for the different features of the experimental and FEA results.We have studied the heat pulse propagation problem using a phenomenological model based on a number of physical assumptions. Firstly, we consider one-dimensional diffusion of the heat pulse in the longitudinal direction. Secondly, we consider a simple heat conduction model in the transverse (i.e., channel depth) direction. Specifically, we do not take into account the Taylor dispersion of the heat pulse. Instead, we model it by a conduction process between the center of the channel (where the heat pulse is localized) and the lateral walls, using an enhanced effective diffusivity. This simplification is justified by the relatively small ratio between channel height and heater-detector spacing, h/Lh−d ≈ 0.2, and the validity of the simplification is also confirmed by FEA simulations (Fig. 7) which show that the detection time of the heat pulse does not drastically depend on heat conduction through the lateral channel walls.
As observed by previous authors,15 the time of arrival of a heat pulse in a laminar flow stream depends on the Peclet number  , which can be interpreted as the ratio between diffusive and convective heat transport (L is the smallest characteristic length scale of the system, v is the relevant flow velocity,
  is the thermal diffusivity of the fluid with χ its thermal conductivity, ρ its density, and Cp its heat capacity). At the lowest flow velocities, the maximum of temperature at the detector is mostly due to the longitudinal diffusion of the heat pulse. This leads to a limitation on the longest detectable time of flight, and therefore provides a low-velocity sensitivity limitation on any time-of-flight sensors. At higher flow velocities the detection is limited by heat diffusion through the stationary layers around the heater and detectors, which creates a nonlinearity. From this point of view, our suspended heater and detector setup has important advantages over previously attempted geometries which employed thermal elements on the device wall. In addition, by using a combination of two detectors, we are able to completely eliminate the effects of the stationary layers and provide a linear sensor response even at the highest flow velocities.
At high velocities, the measured flow velocity vheat can be decomposed into the ratio of the distance heater/detector by a sum of two terms, one accounting for the diffusion time through the boundary layer, tdiff and one for the advection time tflow. We call vflow the mean flow velocity responsible for heat advection and x0 the distance between the heater and one detector:
 | (4) |
 | (5) |
Heat needs to diffuse through the stationary layers around each bridge. The simulation results help us estimate this boundary layer thickness l to be close to a third of the bridge width, i.e. l ≈ 7 μm (we note that in our range of Reynolds' numbers (<10−3), the shape of the boundary layer does not depend on the flow velocity). The diffusion time from the heater to the high velocity streamlines tdiff is then expressed in terms of l, thermal conductivity κ, density ρ, and specific heat Cp of the fluid:
 | (6) |
We use the following fluid properties in our model, corresponding to hexadecane: Cp = 1800 J kg−1 K−1, ρ = 900 kg m−3, κ = 0.15 W mK−1 and thus obtain the numerical values: tdiff.oil = 0.529 ms
 | (7) |
The coefficient c for the heat traveling from the heater to the first detector and to the second detector are coil.det1 = 0.0021 mm−1s−1 and coil.det2 = 0.00106 mm−1s−1.
We fit the results from the simulations and the experiments with this model by calculating first, in each case, the value of the parameter a. a being the proportionality coefficient between the imposed flowrate and the “advection only” velocity, we extract the slope from a linear fit of the heat velocity between the two detectors (where the contribution of diffusion disappears) with the imposed flowrate. Then from the value of a one is able to fit both results with the model of eqn (5). We present the fitting results in Fig. 8 and Fig. 3. The inverse velocities c obtained from the two detectors are of excellent agreement in the case of the simulations. We find cdet1,sim = 0.00205 mm−1s−1 and cdet2,sim = 0.00103 mm−1s−1. We obtain from the experiments: cdet1,exp = 0.001 mm−1s−1 and cdet2,exp = 0.0005 mm−1s−1. The discrepancy between the values of c1 and c2 obtained by fitting the experimental data, and those obtained by numerical estimates, is due to the oversimplified nature of our phenomenological model and to the rather arbitrary estimate we made of the stationary layer thickness l. Nevertheless, it is interesting to see how eqn (5) accurately fits the experimental data.
At low velocities, the pulse duration is significantly shorter than the travel time from the heater to the detector. In addition, the pulse is very localized (the width of the heater, w being a small fraction of the heater-detector distance: w/Lh−d = 0.04). We can therefore consider that at time t = 0 the temperature distribution approximates a δ-function, the temperature evolution in the longitudinal direction being then provided by that of the diffusion equation Green's function:
 | (8) |
 | (9) |
To find out τ, the time of arrival of the heat pulse at the detector (x = Lh−d) one must solve the equation  , which results in:
 | (10) |
We see that in the limit of high velocity (v → ∞) this expression reduced to the time of flight expected from purely geometrical considerations (τ → x/v). In the opposite limit (v → 0), however, this expression reduces to a finite value
 | (11) |
Combining eqn (5) and 10 leads to a general expression of the heat velocity measured by the flowrate sensor and valid over the full range of velocities:
 | (12) |
5 Conclusion
The thermal microflowrate sensor discussed in this article presents an attractive method for flow monitoring and control in lab-on-chip applications. Implementing a quasi-stochastic time-of-flight measurement, it provides a very accurate measurement of the flowrate over more than two orders of magnitude which can be extended with minor changes of the geometry. Whereas most thermal systems suffer from linearity problems and dependency on the fluid properties, this new sensor can provide a linear response thanks to the dual detector system and appears to be independent of the thermal characteristics of the fluid. Experimental data obtained in hexadecane were favorably compared with two-dimensional finite element analysis calculations performed with Ansys. We presented a phenomenological model to account for the sensor behavior which was in excellent agreement with the results, both experimental and numerical, in the regimes of low and high velocities. The range of measurable flowrates can be extended by embedding heaters and detectors with significantly reduced dimensions and by modifying the overall channel dimensions. Future research will be dedicated to testing the sensor with fluids that present a more complex rheology.Acknowledgements
We would like to thank the referees for providing extremely useful comments during the review process. We thank Dr Philippe Salamitou for useful early discussions.References
- B. W. van Oudheusden, The determination of the effective ambient temperature for thermal flow sensors in a non-isothermal environment, Sens. Actuators, A, 1992, 30, 5–26 CrossRef.
- N. T. Nguyen, Micromachined flow sensors - a review, Flow Measurement and Instrumentation, 1997, 8, 7–16 Search PubMed.
- S. Beeby, G. Ensell, M. Kraft, N. White, MEMS Mechanical Sensors, Artech House, Boston MA, 2004 Search PubMed.
- N. T. Nguyen, S. T. Wereley, Fundamentals and Applications of Microfluidics, Artech House, Boston MA, 2002 Search PubMed.
- S. Wu, Q. Lin, Y. Yuen and Y. C. Tai, MEMS flow sensors for nano-fluidic applications, Sens. Actuators, A, 2001, 89, 152–158 CrossRef.
- E. Meng, P. Y. Li and Y. C. Tai, A biocompatible Parylene thermal flow sensing array, Sens. Actuators, A, 2008, 144, 18–28 CrossRef.
- H. Ernst, A. Jachimowicz and G. A. Urban, High resolution flow characterization in bio-MEMS, Sens. Actuators, A, 2002, 100, 54–62 CrossRef.
- M. Ashauer, H. Glosch, F. Hedrich, N. Hey, H. Sandmaier and W. Lang, Thermal flow sensor for liquids and gases based on combinations of two principles, Sens. Actuators, A, 1999, 73, 7–13 CrossRef.
- R. E. Oosterbroek, T. S. J. Lammerink, J. W. Berenschot, G. J. M. Krijnen, M. C. Elwenspoek and A. van den Berg, A micromachined pressure/flow-sensor, Sens. Actuators, A, 1999, 77, 167–177 CrossRef.
- A. Kuoni, R. Holzherr, M. Boillat and N. F. de Rooij, Polyimide membrane with ZnO piezoelectric thin film pressure transducers as a differential pressure liquid flow sensor, J. Micromech. Microeng., 2003, 13, S103–S107 CrossRef CAS.
- P. Enoksson, G. Stemme and E. Stemme, A silicon resonant sensor structure for Coriolis mass-flow measurements, J. Microelectromech. Syst., 1997, 6, 119–125 CrossRef.
- R. Smith, D. R. Sparks, D. Riley and N. Najafi, A MEMS-based Coriolis mass flow sensor for industrial applications, IEEE Trans. Ind. Electron., 2009, 56, 1066–1071 CrossRef.
- L. J. S. Bradbury and I. P. Castro, Pulsed-wire technique for velocity measurements in highly turbulent flows, J. Fluid Mech., 1971, 49, 657 CrossRef.
- I. P. Castro, Pulsed wire anemometry, Exp. Therm. Fluid Sci., 1992, 5, 770–780 CrossRef.
- F. Durst, A. Al-Salaymeh and J. Jovanovic, Theoretical and experimental investigations of a wide-range thermal velocity sensor, Meas. Sci. Technol., 2001, 12, 223–237 CrossRef CAS.
- A. Rachalski, High-precision anemometer with thermal wave, Rev. Sci. Instrum., 2006, 77, 095107 CrossRef.
- M. S. Beck, Correlation in instruments - cross-correlation flowmeters, J. Phys. E: Sci. Instrum., 1981, 14, 7–19 CrossRef.
- N. Xiang and D. Chu, Fast m-sequence transform for quasi-backscatter sonar in fisheries and zooplanton survey applications, Proceedings 7th International Conference on Signal Processing 2004 Proceedings ICSP 04 2004, 2004, 3, 2433–2436 Search PubMed.
- M. Yelderman, Continuous measurements of cardiac-output with the use of stochastic-system identification techniques, J. Clin. Monit., 1990, 6, 322–332 CrossRef CAS.
- S. W. Golomb, G. Gong: “Signal design for good correlation: for wireless communication, cryptography, and radar”, Cambridge University Press, New York NY, 2005 Search PubMed.
- I. S. Miller, D. A. Shah and R. A. Antonia, A constant-temperature hot wire anemeter, J. Phys. E: Sci. Instrum., 1987, 20, 311–314 CrossRef.
| This journal is © The Royal Society of Chemistry 2011 |