Size-controlled magnetoliposomes with tunable magnetic resonance relaxation enhancements†
Carla J.
Meledandri‡
*,
Tsedev
Ninjbadgar
and
Dermot F.
Brougham
*
National Institute for Cellular Biotechnology, School of Chemical Sciences, Dublin City University, Dublin 9, Ireland. E-mail: dermot.brougham@dcu.ie; Fax: +353 1 700 5503; Tel: +353 1 700 5472
First published on 20th October 2010
Abstract
Stable aqueous suspensions of phospholipid-coated superparamagnetic Fe3O4 nanoparticles, or magnetoliposomes (MLs), were prepared and were separated by magnetic chromatography into size monodisperse fractions over a broad size range (50–130 nm). This development facilitated the first study of the size dependence of the MRI relaxation enhancements (relaxivity) of the ML suspensions. The iron oxide surface was stabilised by a primary layer of phosphatidylglycerol, but a range of lipids could be used to complete the bilayer, ensuring water dispersibility and control of ML surface properties. This work establishes for the first time that the outer lipid headgroup has a strong influence on the water relaxation time. Thus our approach provides multiple means to tailor both the biodistribution and the relaxivity of ML suspensions for biomedical applications as contrast agents for MRI, or as magnetically actuated delivery vehicles.
Introduction
Lipid vesicles, or liposomes, have long been recognised as excellent carrier systems for diagnostic and therapeutic moieties due to their colloidal stability, biocompatibility, potential to encapsulate a range of molecules, and tunable surface properties. Aqueous suspensions of magnetoliposomes, or lipid stabilised magnetic nanoparticles (NPs), have also been a focus of research efforts, because of their promising biomedical applications as MRI contrast agents and as magnetically actuated delivery vehicles. The high magnetic moments of such particles can be utilised as sensitive reporters of biologically important processes at the cellular, and even molecular, level. For instance, it has recently been demonstrated1 that magnetic nanosomes, hydrophobic liquid particles containing superparamagnetic iron-oxide NPs stabilised with a lipid monolayer, can be used for MRI imaging and quantification of lipoprotein metabolism kinetics in vivo.Several approaches have been reported for the preparation of magnetic liposomes, resulting in distinctly different structural properties. Liposomal structures which encapsulate magnetic NPs within an aqueous core have been described,2 and for the purposes of this article, we shall refer to such systems as ‘aqueous magnetoliposomes’, or AMLs. These attractive systems, prepared by hydrating a lipid film with an aqueous magnetic fluid, have the potential to transport hydrophilic, lipophilic, and membrane-bound agents to a desired target. Furthermore, Lesieur et al. have demonstrated the advantages of these materials as negative, or T2, contrast agents for MRI imaging and have studied the potential to guide them magnetophoretically with magnetic field gradients.3 While an efficient method for preparing suspensions of AMLs with hydrodynamic size, dhyd, in the 200 nm range has been demonstrated,3 these relatively large particles would be of limited value for parenteral applications, due to rapid opsonisation and clearance from the blood stream.
Lipid stabilised nanoparticles, or nanoparticle clusters (NPCs), which do not contain an aqueous core, form a further class of magnetic liposomes. These are sometimes called lipo-particles or solid magnetoliposomes, and for the purpose of this article we shall refer to them as SMLs. The preparation of SMLs was first described by De Cuyper et al.4 Their process involved incubation and dialysis of surfactant stabilised magnetic particles with preformed phospholipid vesicles. It is widely accepted that this method results in the formation of structures in which the interior of the lipid vesicle is entirely packed with a magnetic core consisting of multiple NPs i.e. a NPC. The inner phospholipid layer is believed to be chemisorbed onto the NP surface. While De Cuyper et al. demonstrated the ability to tune the surface properties of the MLs by modifying the composition of the phospholipid coat, their preparation procedure lacked flexible size control. This compromises the possibility of controlling the emergent magnetic properties, which are strongly size-dependent.5
A significant driver for the development of magnetoliposomes is their potential for real downstream applications, due to the biocompatibility and low toxicity of both iron oxide6 and phospholipids. A further advantage is the potential to tune the performance of the materials through control of the membrane composition and/or the magnetic nanoparticle payload. However, significant challenges need to be addressed before the applications can be fully explored, these include developing control over NP core size, inter-nanoparticle interactions, the stability of the carrier and the overall size and size distribution of the magnetoliposomes. Size is known to be a major determinant of biodistribution,7 and even a moderate improvement in size distribution has been shown to have clinical effects. For instance, Sinerem® a nanocomposite of a dextran stabilised 4–5 nm iron-oxide NPs with mean hydrodynamic size c. 50 nm, is produced by fractioning Endorem®, which has a broad size distribution centered around 200 nm. The improved bio-distribution arising from control over size has lead to the investigation of Sinerem® for diagnostic staging in liver cancer.8 Furthermore, in the case of dense magnetic nanoparticle clusters, including SMLs, control over the size of the cluster determines the magnetic properties that directly influence MRI contrast,9–11 the magnetophoretic mobility,2 and the hyperthermic capacity of the agents.12
The effectiveness of NP or NPC suspensions as contrast agents is quantified by the concentration independent magnetic resonance relaxation enhancement per millimolar of iron, i.e. the spin–lattice, r1, or spin–spin, r2, relaxivity. For magnetite (Fe3O4) NP and NPC suspensions, r1 and r2 typically range from 10–20 and 50–200 s−1mM−1, respectively, in the clinical MRI field range.13 The technique of field-cycling NMR relaxometry, or NMRD, can be used to measure r1 as a function of 1H Larmor frequency, and hence provide useful insight into the relaxation behaviour of magnetic colloidal dispersions.14 There have been several relaxometric studies published which validate the approach as a general purpose tool for characterising magnetic NP dispersions.5,15,16
Magnetic methods are commonly used for the separation of MLs from non-adsorbed phospholipids, by application of high magnetic field gradients.4,17,18 Recently, Moeser and co-workers assessed the feasibility of high-gradient magnetic separation to remove phospholipid-coated magnetic NPs from water for chemical processing and protein separations.19 These authors studied the effect of flow velocity on capture efficiency for different phospholipid-coated particles in the size range of 25–50 nm. Of more direct relevance, a magnetic size sorting technique was recently reported20 to reduce the polydispersity of suspensions of individual γ-Fe2O3 particles (dhyd < 50 nm). The evolution of the particle size distribution during magnetic sorting was investigated by magnetometry and NMR relaxometry.
In this work, we develop the use of magnetic chromatography as a means of size selection, by producing fractions of size controlled clusters (within the range of 50 to 130 nm) from coarse magnetoliposome suspensions. The advantages of magnetic chromatography arise because it separates particles based on the strength of their magnetic interaction with an externally applied field. This divides a coarse suspension into fractions, according to the number of nanoparticles in the clusters, which therefore have different magnetic, and magnetic resonance, properties. Hence the result of magnetic chromatography is the preparation of fractions with variable and tightly controlled hydrodynamic size, which may be ideal for biomedical applications. Detailed NMR analysis of these fractions, including NMR relaxometry and r2 measurements in the clinical MRI range were undertaken to explore this potential. These provide insight into the nature of the magnetic relaxation mechanisms of dense nanoparticle aggregates in aqueous suspension. This ‘top-down’ approach to size-selection complements our recently reported ‘bottom up’ approach to producing fatty-acid stabilised size controlled clusters.9 The insights gained from the present work into the relaxation mechanisms and magnetic organisation of composite magnetic nanoparticle assemblies are of relevance to the development of nanoparticulate agents for biomedicine. There have been recent reports of the use of magnetic nanoparticles as novel contrast agents for monitoring lipo-protein metabolism,21 and for magnetic actuation of neurons by AC-field hyperthermia.22
Experimental section
Materials
1,2-Dioleoyl-sn-glycero-3-[phospho-rac-(1-glycerol)] (sodium salt) (DOPG) and 1,2-dioleoyl-sn-glycero-3-phosphocholine (DOPC) were purchased as lyophilised powders (>99%) from Avanti Polar Lipids (Alabaster, AL, USA) and stored at −20 °C. Iron (II) chloride tetrahydrate (>99%) was purchased from Fluka (Buchs, Switzerland). Iron (III) chloride-6-hydrate (>99%) was purchased from Riedel-de-Haën (Seelze, Germany). Ammonium hydroxide (28% NH3 in water) was purchased from Sigma-Aldrich (Milwaukee, WI, USA). All reagents were used without further purification. Deionised water was deaerated before use.Step 1: Synthesis of lipid-stabilised Fe3O4 cores
Magnetite, Fe3O4, nanoparticles coated with a monolayer of DOPG molecules (PG-Fe3O4) were synthesised by carrying out an alkaline coprecipitation of iron salts in the presence of the phospholipid molecules. A mixture of 0.236 g FeCl3·6H2O and 0.086 g FeCl2·4H2O was added with stirring to 20 mL deoxygenated H2O under N2, so that the Fe3+:Fe2+ molar ratio = 2. The solution was slowly heated to 80 °C with strong magnetic stirring. After 30 min at 80 °C, one fifth of the total phospholipid to be added (0.85 mM DOPG dissolved in 0.5 mL methanol) was added to the reaction mixture, immediately followed by the addition of 1.5 mL of 33% ammonia to precipitate the metal ions. The remaining DOPG (3.41 mM dissolved in 1 mL methanol) was then slowly added to the mixture over a 5 min period, and crystal growth was allowed to proceed with vigorous stirring for 15 min at 80 °C. The suspension was allowed to cool slowly to room temperature. Upon cooling, the solids were precipitated with 40 mL MeOH/acetone (50/50 v/v), and isolated by magnetic decantation. The precipitate was washed an additional 4 times with MeOH/acetone, and the solids isolated by magnetic decantation.Step 2: Preparation of magnetoliposomes
The preparation method used to form SMLs was a modification of a procedure reported by Shen et al.23,24 for producing stable, water-based suspensions of bilayer fatty-acid coated magnetic NPs. In a typical preparation, PG-Fe3O4 was dispersed in H2O and immediately heated to 65 °C under a steady stream of N2 with vigorous stirring. After 30 min at 65 °C, 10 mM ammoniated DOPG or DOPC was added slowly to form a secondary phospholipid layer around the iron oxide core, and the suspension was stirred for an additional 25 min at 65 °C. The aqueous magnetoliposome suspensions are termed PG/PG-SMLs or PC/PG-SMLs, depending on the phospholipid used to form the outer/inner layer around the iron oxide core. Upon cooling to room temperature, the magnetoliposome suspension was sonicated for 30 min in a bath-sonicator, then placed over a bar magnet for approximately 20 min in order to sediment and remove any larger, aggregated material.Magnetic chromatography
Magnetic chromatography was performed by using a variable flow peristaltic pump to pump aqueous SML suspensions through 1/8 inch ID tubing packed with ∼60 mg steel wool, which was placed between the poles of an electromagnet, a reconditioned Bruker WP80 electromagnet. The procedure involved first pumping a single aliquot of the SML suspension through the tube using a flow rate of 4 mL/h at a magnetic field strength (flux density) of 0.47 T. Under these conditions, all the magnetic material was retained on the steel wool (retentate), and the non-magnetic material was eliminated from the sample. While continuing to apply a magnetic field, which was varied in strength between 0.01 and 1.64 T, subsequent volumes of deionised water were pumped through the system at increasing flow rates ranging from 8–600 mL/h. Each aliquot, or eluent, was collected and retained for characterisation. The magnet was switched off and the final retentate was collected by pumping water through the system to redisperse the retained particles. The procedure produces multiple eluent samples and one final retentate sample. Magnetic chromatography was performed at room temperature of 21 °C.Attenuated total reflectance-infrared spectroscopy
Attenuated total reflectance (ATR) infrared spectra were recorded on a Spectrum GX FT-IR System (Perkin Elmer; Norwalk, CT, USA). Samples were placed on the face of a ZnSe trough plate crystal and the solvent was evaporated under N2. D2O was used to prepare the liposome sample with a view to observing the O–H stretching modes of the phospholipid. Eight scans were recorded over a 4000–650 cm−1 spectral range with 2 cm−1 spatial resolution. ATR and baseline corrections were applied followed by 19-point smoothing (Spectrum software v.3.01; Perkin Elmer LLC; Norwalk, CT, USA).Cryogenic scanning electron microscopy
The magnetoliposome suspensions were spread onto Al stubs and frozen by plunging into liquid nitrogen slush. The stubs were transferred into the cryo prep chamber, where they were sputter coated with Pt. The samples were then transferred into the SEM chamber, where they were examined at a temperature of −160 °C. The cryo specimen preparation was carried out using a Quorum Alto cryo system, and the images were taken using a Zeiss Supra 55VP Field emission SEM. The dimensions of the images were 1024 × 768 pixels, which were recorded as TIFF files.Transmission electron microscopy
Aqueous PG/PG-SMLs and PC/PG-SMLs suspensions were treated with 0.3wt% Tween20 to extract the secondary layer.4 The suspension was then shaken for 3 days. A precipitate was collected by centrifugation and washed with water and then acetone and was re-dispersed in chloroform. The suspensions were then air dried onto carbon grids for analysis. The TEM measurements were performed using TECNAI G2 TEM operating at an accelerating voltage of 120kV.Photon correlation spectroscopy
Photon correlation spectroscopy (PCS) experiments were performed at 25 °C on a High Performance Particle Sizer HPPS (Malvern Instruments, Malvern UK) which uses a detection angle of 173°, and a 3 mW He–Ne laser operating at a wavelength of 633 nm. The Z-Average (mean hydrodynamic) diameter, which we will refer to as dhyd, and the polydispersity index (PDI) values were obtained from analysis of the correlation functions using the Multiple Narrow Modes algorithm based upon a non-negative least squares fit25 using Dispersion Technology software (v. 4.10, Malvern Instruments; Worcestershire, U.K.). PDI values below 0.3 are consistent with a uni-modal size distribution, values below 0.2 indicate a monodisperse suspension. Zeta potential measurements were performed at 25 °C on a Malvern NanoZS, using the M3-PALS technology.Nuclear magnetic resonance
The frequency dependence of the 1H relaxation for the aqueous suspensions of magnetoliposomes was recorded over the frequency range 0.01–20 MHz using a Spinmaster FFC-2000 Fast Field Cycling NMR Relaxometer (Stelar SRL, Mede, Italy).26 The system operated at a measurement frequency of 9.25 MHz for 1H, with a 90° pulse of 7 μs. T1 measurements were performed as a function of external field, B0, with standard pulse sequences incorporating B0 field excursions.27 The temperature of the samples was maintained at 25 °C and controlled within ±1 °C through the use of a thermostatted airflow system. All of the 1H magnetisation recovery curves were mono-exponential within experimental error and the random errors in fitting T1 were always less than 1%. T2 was measured using the CPMG pulse sequence. For measurements at 9.25 MHz, the relaxometer magnet was used. For higher frequencies a re-conditioned Bruker WP80 electromagnet was used, with the Stelar console. At higher frequency the 90° pulse was typically 5.5 μs.Determination of iron content
Total iron content was determined by either atomic absorption spectroscopy (AAS) on a Varian SpectrAA Spectrometer, using a Fe-cathode lamp light source with a wavelength of 248.3 nm, or by inductively coupled plasma atomic emission spectroscopy (ICP-AES) on a Varian Liberty 220ICP. All magnetoliposome suspensions were prepared for iron determination by combining a small aliquot (typically 0.3–0.5 mL) of the sample with an equal volume 1% (v/v) Triton X-100 solution, 0.5 mL 6N analar grade HCl, and 1 mL deionised water. The mixture was heated until only c.1 drop of liquid remained, at which time 25 mL deionised water was added. The solution was heated to boiling and then immediately removed from the heat and allowed to cool to room temperature. The volume was adjusted to 50 or 100 mL as required for spectrometric analysis.Results
Synthesis and structural characterisation
In the two-step ML preparation method, alkaline co-precipitation of ferrous and ferric salts is carried out in the presence of phospholipid molecules. It is expected that the primary phospholipid is chemisorbed onto the iron oxide surface. This is followed by the physical adsorption of a secondary phospholipid layer forming a stable bilayer around the iron oxide core. This preparation method makes it possible to prepare stable suspensions with reproducible NMR properties, which is not the case when we prepare MLs using the approach described by De Cuyper and Joniau.4 An XRD pattern of an as-prepared PG-Fe3O4 sample is shown in the supplementary information. Although the diffraction peaks are broadened due to the nanometer scale of the crystallites, the peak positions and their relative intensities correspond to the spinel structure of magnetite (JCPDS 19-0629). This is also the iron oxide phase identified by De Cuyper resulting from a co-precipitation synthesis.28 It should be noted that unambiguous identification of Fe3O4 over γ-Fe2O3 is difficult. However, as NPs of both phases have very similar magnetic properties the identity is not critical to the current work, so we shall refer to the phase as Fe3O4. The particle size is calculated to be 13 nm using a quantitative line broadening analysis of the (311) diffraction peak at 35.45°.Following preparation of PG-Fe3O4, the material can be readily dispersed in CHCl3. This strongly suggests the formation of a chemisorbed phospholipid monolayer on the NP surface, and further evidence is provided by ATR-IR analysis. PCS shows a rather broad size distribution at this stage with dhyd in the 30–50 nm range, indicating the formation of small clusters of NPs. The ATR-IR spectrum of PG-Fe3O4 is shown in Fig. 1, along with spectra of uncoated Fe3O4 NPs, and DOPG liposomes for comparison.
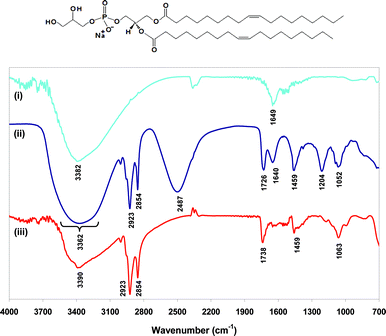 | ||
| Fig. 1 ATR-IR spectra of (i) uncoated Fe3O4 nanoparticles, (ii) DOPG liposomes (no iron oxide), and (iii) PG-Fe3O4. Inset: molecular structure of DOPG. | ||
Considering first the spectrum of uncoated Fe3O4, Fig. 1(i), it contains two bands at 3382 cm−1 and 1649 cm−1 which can be attributed to the O–H stretching and H–O–H bending modes of adsorbed water molecules.29,30 A ZnSe ATR crystal was used, this material absorbs strongly below ∼650 cm−1, hence the Fe–O stretching modes were not accessible. Considering next the spectrum of a D2O suspension of DOPG liposomes, Fig. 1(ii), the bands at νmax/cm−1 2487 and 1640 arise due to the presence of D2O. The remaining bands in the spectrum arise from vibrational modes of DOPG: νmax/cm−1 2923 (νa CH2 stretch), 2854 (νs CH2 stretch), 1459 (νs CH2 scissor), 3362br (O–H stretch), 1726 (C![[double bond, length as m-dash]](https://www.rsc.org/images/entities/char_e001.gif) O stretch), 1204 (νa PO2− stretch), 1052 (νs PO2− stretch). The spectrum of PG-Fe3O4, Fig. 1(iii), contains all of the vibrational modes observed for DOPG liposomes, except for two notable exceptions: the νa PO2− and O–H stretching bands. This strongly suggests that both the phosphate and hydroxyl groups of the DOPG headgroup are involved in binding the lipid molecules to the iron oxide surface in the PG-Fe3O4 samples. It is likely that any residual H2O in the DOPG liposome sample would have prevented that comparison, hence we used D2O in preparing this sample. It is expected that the phospholipid binding in PG-Fe3O4 samples occurs through chemisorption of the phosphate-containing headgroups, considering the well-known affinity of phosphate for iron oxide surfaces.29 This orientation, which results in the non-polar C18 chains extending away from the cores, provides efficient steric stabilisation and renders the particles stable in non-polar solvents, such as CHCl3, as verified in the present study.
O stretch), 1204 (νa PO2− stretch), 1052 (νs PO2− stretch). The spectrum of PG-Fe3O4, Fig. 1(iii), contains all of the vibrational modes observed for DOPG liposomes, except for two notable exceptions: the νa PO2− and O–H stretching bands. This strongly suggests that both the phosphate and hydroxyl groups of the DOPG headgroup are involved in binding the lipid molecules to the iron oxide surface in the PG-Fe3O4 samples. It is likely that any residual H2O in the DOPG liposome sample would have prevented that comparison, hence we used D2O in preparing this sample. It is expected that the phospholipid binding in PG-Fe3O4 samples occurs through chemisorption of the phosphate-containing headgroups, considering the well-known affinity of phosphate for iron oxide surfaces.29 This orientation, which results in the non-polar C18 chains extending away from the cores, provides efficient steric stabilisation and renders the particles stable in non-polar solvents, such as CHCl3, as verified in the present study.
Subsequently the PG-Fe3O4 particles were stabilised in aqueous media by addition of a secondary phospholipid layer, DOPG or DOPC. We found that the resulting aqueous suspensions can be stored at room temperature without significant change in size, or magnetic resonance properties, for periods in excess of 2 years, see supplementary information. Apparently physical adsorption of a secondary phospholipid layer (DOPG or DOPC), results in a very stable secondary physisorbed layer around the DOPG coated iron oxide cores. The natural pH of both types of SML suspensions was c. 9.5, and the zeta potentials were measured to be −30 and −34 mV, for PG/PG-SMLs and PC/PG-SMLs, respectively. DOPC is zwitterionic, so it is likely that (at this pH) there are hydroxyl ions associated with the choline group, effectively neutralising its charge. As a result the measured zeta potentials are similar for both types of outer layer lipid.
A typical ATR-IR spectrum for bilayer coated ML samples is shown in Fig. 2. The spectrum for PG/PG-SMLs is shown, and the spectrum for PC/PG-SMLs is included in the supplementary information. Notably, the νa PO2− stretching mode previously absent in the spectrum of PG-Fe3O4 (Fig. 1 (iii)), now appears at 1204 cm−1 for the bilayer-coated MLs. Additionally, there is a significant broadening of the O–H stretching band above 3000 cm−1. These features suggest the presence of nanoparticle associated DOPG molecules, in which the headgroups are not bonded to the surface of the iron oxide. It is generally accepted the non-bonded phospholipid molecules form a partially complete, secondary layer physisorbed onto the primary layer. This orientation sequesters the hydrocarbon chains into regions where the contact with water is reduced, while allowing the hydrophilic headgroups to interact with the bulk aqueous solvent.31,32 Further support for this configuration can be found in the literature. Sahoo et al. reported a DSC and TGA study which demonstrated quasi-bilayer formation of phosphate and phosphonate ligands on the surface of magnetite NPs.33

A representative cryo-SEM image for a sample of PG/PG-SMLs is shown in Fig. 3 (a). The micrograph reveals spherical, well dispersed, and uniform particles with an average diameter of 51 nm (SD 11 nm). This is consistent with the presence of almost spherical iron oxide nanoparticle clusters. It should be noted that the features apparent in the figure were observed in most regions of the SEM stub, indeed the view shown is of an area in excess of 1.6 μm2. Additional images are included in the supplementary information. The dhyd value of this SML suspension was 82.9 nm, with a polydispersity index, PDI, of 0.284. As expected the hydrodynamic size is found to be somewhat higher, given the inclusion of bound solvent molecules and the greater contribution to the light scattering of the larger particles in the size distribution.5 Thus the cryo-microscopy results are consistent with those obtained from light scattering.
 | ||
| Fig. 3 (a) Cryo-SEM image of PG/PG-SMLs, courtesy of Carl Zeiss, Ltd.; WD = 6.0 mm InLens 10 kV. The SMLs are quasi-spherical (average aspect ratio 1.5) with average size 51 nm, SD 11 nm (116 measurements). The hydrodynamic diameter of this sample from light scattering, dhyd, was 82.9 nm, with PDI 0.284. (b) TEM image of primary NPs extracted from a PG/PG-SML sample demonstrating the presence of sub 20 nm primary NPs. dTEM = 13.8 nm (SD 3.7 nm) Note that at the image sizes presented, the 100 nm scale bar in (b) is 2.0 times the length of the bar in (a). | ||
TEM analysis of dried CHCl3 suspensions of PG/PG- and PC/PG-SMLs, after detergent extraction of the primary phospholipid layer, reveals the presence of far smaller NPs of iron oxide of diameter, dTEM = 13.8 nm (SD 3.7 nm), in good agreement with the XRD result. A representative image is included in Fig. 3(b), additional images are included in the supplementary information. Hence microscopy conclusively demonstrates that SMLs are larger aggregates (cryo-SEM) of primary Fe3O4 NPs that are c. 14 nm in size (TEM), and are therefore in the superparamagnetic size range.
SML size selection
Magnetic chromatography was carried out on aqueous suspensions of PG/PG- and PC/PG-SMLs. Typical results of a chromatographic experiment are shown in Table 1 for PG/PG-SMLs; the initial dhyd of the suspension was 102 nm. PCS was used to characterise the SMLs suspended in each fraction after separation. An increase in dhyd was observed with an increase in flow rate from 8–600 mL/h using a constant magnetic field of 0.5 T. A flow rate of 600 mL/h was the highest rate obtainable with the peristaltic pump used in this study. Once this limit was reached, further size separation was achieved by varying the magnetic field while using a constant flow rate. Magnetic chromatography allowed the division of the bulk sample into several fractions which differed in mean particle size by up to 79 nm and in most cases with an improvement in the PDI. That extent of separation is routinely achievable by magnetic chromatography of PG/PG- and PC/PG-SML suspensions, using the method described above. Data from other experiments are included in the supplementary information.| Flow Rate (mL/h) | Magnetic Field (T) | dhyd (nm) | PDI |
|---|---|---|---|
| 8 | 1.6 | 52.6 | 0.224 |
| 8 | 1.2 | 56.9 | 0.205 |
| 8 | 0.7 | 58.5 | 0.176 |
| 8 | 0.5 | 71.8 | 0.163 |
| 15 | 0.5 | 74.6 | 0.163 |
| 30 | 0.5 | 81.5 | 0.158 |
| 40 | 0.5 | 80.0 | 0.125 |
| 50 | 0.5 | 84.9 | 0.131 |
| 100 | 0.5 | 91.3 | 0.135 |
| 200 | 0.5 | 92.4 | 0.136 |
| 400 | 0.5 | 96.6 | 0.114 |
| 600 | 0.5 | 104 | 0.153 |
| 600 | 0.1 | 110 | 0.103 |
| 600 | 0.02 | 116 | 0.118 |
| Final retentate | 0 | 132 | 0.112 |
Nuclear magnetic resonance relaxometry
The spin–lattice relaxivity profiles for suspensions of (a) PG/PG-SMLs, and (b) PC/PG-SMLs with controlled dhyd ranging from 81–150 nm are shown in Fig. 4. The results demonstrate that for both types of SML suspension there is a strong, systematic increase in r1 with a decrease in hydrodynamic size, particularly in the mid-and low-frequency range. The suspensions with the smallest sized SMLs, of a concentration sufficient to undertake NMR analysis, were in the 80 nm range. | ||
| Fig. 4 Relaxivity profiles, recorded at 295 K, of (a) PG/PG-SML samples with dhyd ● 81.4 nm (PDI = 0.169), ○ 89.7 nm (0.203), □ 128 nm (0.185) and ■ 150 nm (0.206) the open and closed data markers indicate pairs of suspensions separated from two original suspensions; (b) PC/PG-SML samples with dhyd ♦ 80.9 nm (0.162), ▲ 85.3 nm (0.150), ▼ 102 nm (0.142), ◀ 114 (0.180) and ▶ 128 nm (0.130). These fractions were obtained from a single SML suspension. | ||
The shape of the profiles is consistent for all of the SML suspensions, irrespective of dhyd. The profiles exhibit some features of relaxation due to dispersed superparamagnetic iron oxide NPs in suspension;14 namely, a low frequency plateau, a maximum in the low MHz range, and a rapid decrease at high frequency. However, the relaxivity values are notably higher than expected for dispersed superparamagnetic NPs, particularly at lower frequency. The frequency of the r1 maximum was ca. 1 MHz for both types of suspensions. This is consistent with a primary particle size in the sub 20 nm range,14 in broad agreement with the NP size obtained from TEM and XRD analysis. It is apparent therefore from consideration of the magnetic chromatography results, Table 1, that in all cases clusters of individual primary NPs were produced. The smallest (50 nm range) SMLs fraction we have isolated would be expected, on the basis of volume, to be comprised of 30–40 close packed primary NPs of size ca. 14 nm.
The application of a contrast agent for negative contrast applications is dependent on the spin–spin relaxivity.13 For SMLs we found the r2 values to be always significantly higher than the r1 values. For 90 nm PG/PG- SMLs we measured r2 values of 270 and 166 s−1mM−1 at 9.25 and 40 MHz, respectively. For 110 nm PG/PG- SMLs we measured a r2 value of 919 s−1mM−1 at 40 MHz, while for 115 nm PC/PG-SMLs we measured a r2 value of 453 s−1mM−1 at 9.25 MHz. The implication of these values is discussed below, full details are provided in supplementary information.
Discussion
Magnetoliposome preparation and size control
The SML preparation method described in this work was clearly successful in producing highly stable bilayer-coated samples. As we were able to physisorb a secondary phospholipid layer around the magnetite core using two different lipid classes, our results suggest that the preparation method may be extended further to prepare SMLs with a secondary layer formed from other phospholipids; at minimum, other phosphatidylcholine and phosphatidylglycerol lipids, such as dipalmitoyl- (DPPC, DPPG) and dimyristoyl- (DMPC, DMPG). The advantage of an adaptable preparation method lies in the ability to tailor the liposome formulation, for instance by tuning surface charge, or by incorporating any one of a number of formulations that are known to extend blood circulation lifetimes.35 In our case the latter approach may provide the possibility of size dependent biodistribution.The SML preparation method presented in this work results in suspensions that are reasonably monodisperse, but does not initially provide much control over particle size. Many size-sorting techniques are routinely used to fractionate magnetic fluids, including centrifugation36 and size-exclusion chromatography,37 however these methods separate the particles based on their overall physical size, and so cannot ensure the preparation of a sample with uniform magnetic, or magnetic resonance, properties. We have utilised magnetic chromatography as a means of selective particle size control, as it separates particles based on the strength of their interaction with an externally applied magnetic field, i.e. according to the number of particles in the clusters. Coarse SML suspensions are composed of dense clusters, with a wide size range, formed from relatively monodisperse primary NPs. The result of magnetic chromatography is SML fractions of variable and tightly controlled hydrodynamic size, with uniform magnetic properties, which may be ideal for biomedical applications.
Separation of particles by magnetic chromatography arises due to competition between the applied magnetic force, which retains the particles in position and an opposing force. The latter may arise from the force of fluid flow under gravity, which has formed the basis for the quantitative determination of particle size distributions from magnetic sedimentation rates,38 and has been used to size fractionate primary nanoparticle suspensions,20 or, as in our case, the force of flow as the suspension is pumped through the magnetic field. The magnetic force on a single spherical particle (Fmag) due to an applied external magnetic field is dependent on particle volume and the magnetic field gradient, as described in eqn (1):39
 | (1) |
We found that the average hydrodynamic size of the SML fractions obtained at a given flow rate and field is sensitively dependent on the starting size distribution. However, fractions of comparable size, polydispersity and with systematically varying magnetic resonance properties can be produced from different batches by adjusting these two critical parameters. This was the case for PG/PG-SMLs, for which Fig. 4a and 5(□) were obtained using two different suspensions. An advantage of the process described here is that it allows continuous variation of these parameters, over a broad range.
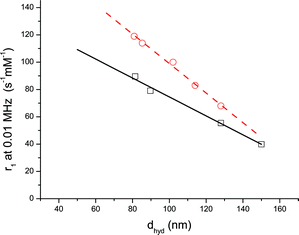 | ||
| Fig. 5 Relaxivity at 0.01 MHz as a function of dhyd for (□) PG/PG-SMLs with diameters of 81, 90, 128, and 150 nm; (○) PC/PG-SMLs with diameters of 81, 85, 102, 114, and 128 nm. The lines are linear fits with equations y = −0.694x + 144, R2 = 0.99 (solid line); y = −1.08x + 207, R2 = 0.99 (dashed line). | ||
It is appropriate to refer to the approach as ‘magnetic chromatography’, as the materials are indeed partitioned between two phases (on and off the wire), and there is a dynamic equilibrium between the two phases that can be shifted by altering the flow rate or magnetic field strength.
It is interesting to note that eluent fractions obtained at lower magnetic fields (< 0.5 T) and higher flow rates were found to be significantly more size monodisperse, as indicated by the lower PDI values, Table 1. This improvement undoubtedly facilitates the strong size dependence we observe in the NMR relaxation time measurements. The maximum field available to us was 1.6 T, but with stronger fields, it may be possible to extract even smaller SMLs from the bulk suspension, closer in size to the primary NP dimension. Interestingly, it has been reported that 20 nm Fe3O4 particles can be trapped in a magnetic filter at an external magnetic field of 0.5 T.40 At the upper end of the SML size distribution, it may be possible to produce fractions of larger sized SMLs by using flow rates in excess of those applied in this study. For both very large and very small SMLs, we found that the yield of particles decreased. These fractions represent the outer edges of size distribution of the original SML suspension.
Magnetic resonance properties of the magnetoliposome suspensions
Muller and co-workers have published a theory of solvent spin–lattice relaxation in the presence of superparamagnetic nanoparticles, commonly known as the SPM model.13 In this approach at low field (and hence low 1H Larmor frequency as νL = γHB0/2π) 1H relaxation is driven by random fluctuations of the magnetic moments of the NPs, i.e. by the Néel process. At high field the moments are locked to the external field and diffusion of the solvent molecules drives relaxation. In the model, the response at intermediate field is obtained by interpolation. Hence the SPM model is only appropriate for fully dispersed particles in which case it has been possible, under ideal circumstances, to obtain quantitative agreement with independent measures of particle size and saturation magnetisation.5,15However, for SMLs, and in particular, those from the lower end of the size range studied, the low frequency r1 is far greater than expected for dispersed superparamagnetic NPs in suspension.14 The behaviour for SMLs is indicative of stronger interactions between individual NPs in the clusters, resulting in increased effective magnetocrystalline anisotropy and hence a longer Néel correlation time, τN, for re-orientation of the moments of the individual NPs,41 than would be expected if the NPs were fully dispersed. In fact SPM theory is not anticipated to account for the relaxation due to SMLs, even at higher frequency, as the Redfield condition will not be met for objects in this size range.14 A theory for solvent relaxation in the presence of large magnetised spheres has yet to be developed.
Nonetheless, the profile does however retain some characteristics of superparamagnetism, in particular the presence of a maximum in the low MHz range, indicating that the dipolar inter-particle interactions within the SMLs remain relatively weak, i.e. the clusters are not fully ferromagnetic. It should be noted that dispersed NPs in this size range are superparamagnetic,42 values of the saturation magnetisation in the range 52–76 emu.g−1 are usually reported. We recently obtained43 values of 57 emu.g−1 for dispersed NPs prepared using the methods described above. The NMR analysis of the suspensions presented here shows that dipolar interactions in the clusters give rise to a significant deviation from superparamagnetic behaviour.
Detailed analysis of the dependence of the low frequency spin–lattice relaxivity on hydrodynamic size, Fig. 5, reveals that in the SML size range studied, the relationship is linear for both PG/PG- and PC/PG-SML suspensions. The fact that the relaxivity of the SML fractions is directly correlated with dhyd, is further confirmation that PCS provides a reliable measure of the magnetic cluster size. For spherical particles, Fig. 3, a linear decrease in relaxivity with increasing average SML diameter equates to a linear increase in relaxivity with average surface area to volume ratio. As the size of SMLs increases, a smaller fraction of the total primary NPs is located at the surface of the cluster. Thus, we interpret the results of Fig. 5 as a decrease in the fraction of magnetic moments available to the diffusing solvent molecules, resulting in a lower relaxivity for larger bodies.
We have found that normalising the relaxivity profiles to a common r1 value at 10 kHz, results in scaled profiles which are almost superimposable at all frequencies, for all SML sizes, see supplementary information. Hence both the low frequency (kHz range) and high frequency (MHz range) relaxivity are determined by the available fraction of surface NPs. The implication is that both (i) the inner-sphere contribution to the low frequency relaxation, which is characterised by τN, and (ii) the outer-sphere contribution to the high frequency relaxation,14 which is driven by the diffusional timescale of water around the cluster, τD, scale in similar proportions with the surface area of the magnetoliposome. The picture that emerges for SMLs is one of superparamagnetic-like spin–lattice 1H relaxation arising from the fraction of NPs within each cluster that are water accessible.
The efficiency of an agent for negative MRI contrast applications is usually quantified by the relaxivity ratio, r2/r1,13 which should be as high as possible. For 90 and 110 nm PG/PG-SMLs we measured relaxivity ratios in the range of 6–8 at 9.25 MHz, rising to 20–23 at 40 MHz. For 115 nm PC/PG-SMLs a similar value of 7.2 was obtained at 9.25 MHz. Thus the size dependence of the relaxivity ratio was relatively weak; over the range studied it was found to be significantly weaker than the size dependence of the low frequency r1 values, Fig. 4. In fact the r2/r1 ratios measured are comparable to those observed for the current generation of clinical negative contrast agents, such as Ferridex®, for which values of about 17 have been reported in the clinical MRI range (40–60 MHz).34 Thus SML suspensions have comparable relaxivity to the current generation of negative contrast agents although they may have other advantages arising from biocompatibility and selective size control.
Comparison of PG/PG- and PC/PG-SMLs reveals, Fig. 5, that both the spin–lattice relaxivity, and the size dependence of the relaxivity, is greater for PC/PG-SMLs than for PG/PG-SMLs, despite the fact that the inner PG-Fe3O4 cores were produced by the same process in both cases. Comparing the slopes of the linear fits in Fig. 5; the values differ by 56%, and the standard errors on the slopes are 4–6%. Under the conditions studied, both types of suspensions were observed to have very similar zeta potential, in the range of −30 mV. Taken as a whole these observations strongly suggest that the chemical nature of the headgroup has a distinct effect on the interaction between the magnetic moments of the NPs in the outer SML layers and the 1H nuclei of the surrounding water molecules. In the case of fully hydrated bilayers it is known that lipids retain a shell of associated water.44 DOPC- are known to differ from DOPG-bilayers in that they lack exchangeable protons and have a greater extent of hydration.45 It is probable, therefore, that differences in outer layer hydration in PC/PG- and PG/PG-SMLs affect the interaction of the bulk water molecules with the Fe3O4 NPs, giving rise to the observed differences in the size dependence of r1.
We are currently working to increase the number and type of lipids used to form the outer layer of the SMLs to explore the potential for tuning the size-dependence of the relaxivity through the choice of head-group.
Conclusions
We have developed a method for the preparation of dense lipid stabilised magnetic nanoparticle clusters, which permits the use of different types of lipid in the outer layer, facilitating the tailoring of membrane properties. For the first time, we have demonstrated the application of magnetic chromatography to produce stable size-controlled monodisperse fractions across a wide size range, within the range that is known to strongly influence particle biodistribution. We have elucidated the nature of the relaxation mechanism that governs the spin–lattice relaxivity in dense magnetic clusters, materials which are being considered for contrast agent applications, and have demonstrated that the low frequency relaxivity of stable SML suspensions can be controlled through magnetic chromatography.Given the importance of magnetoliposomes in diagnostics these findings may be key to further developments of MRI imaging when one considers the growing interest in: (i) spin-lock MRI,46 where image contrast is determined by the relaxivity in the rotating frame, r1ρ, at the frequency of the RF pulse, which is usually in the kHz range; (ii) microtesla MRI,47 for which sensitivity drawbacks are currently being addressed by use of field-cycling techniques48 and ultra-sensitive detectors. We also expect that this work will be of relevance to the development of other biomedical applications. For instance it will act as a guide to the dimensions of Fe3O4 NP clusters that can be retained by magnetic chromatography at a given field strength. Indeed in applications where biodistribution is strongly influenced by particle size the ability to select the size and improve the polydispersity will maximise the delivered dose. Finally, the robust materials production and the analysis of the MRI relaxation mechanisms presented here, may be a significant step towards the preparation of lumen containing lipidic nanoparticles, or AMLs, of controllable size and MRI properties. We expect that the relaxation mechanisms in such systems will be related to those for SMLs, with the added complication that the magnetic relaxation sink is partitioned from the bulk water by a membrane.49 Ongoing work in our laboratory is on such hydrated barrier systems.
Acknowledgements
The authors would like to thank Dr Ken Robinson, Carl Zeiss SMT Ltd, and Dr Michael Wombwell, Quorum, for cryo-SEM work. We would like to thank Dr Michael Kaszuba, Malvern, for helpful discussions. We would like to thank Dr David Cottell of the Electron Microscopy Laboratory at University College Dublin for access to TEM facilities. We would also like to thank Daragh Byrne, of the NCPST and School of Physical Sciences DCU, for assistance with XRD measurements. CM acknowledges the National Institute for Cellular Biotechnology and Enterprise Ireland (Proof of Concept Award PC/2006/207) for financial support. TN acknowledges Enterprise Ireland (Technology Development Award CFTD/2008/135) for financial support. DB acknowledges the Higher Education Authority of the Republic of Ireland and the National Institute for Cellular Biotechnology (NICB) for support in the purchase of NMR and light scattering equipment.Notes and references
- O. T. Bruns, H. Ittrich, K. Peldschus, M. G. Kaul, U. I. Tromsdorf, J. Lauterwasser, M. S. Nikolic, B. Mollwitz, M. Merkel, N. C. Bigall, S. Sapra, R. Reimer, H. Hohenberg, H. Weller, A. Eychmüller, G. Adam, U. Beisiegel and J. Heeren, Nat. Nanotechnol., 2009, 4, 193 CrossRef CAS.
- M.-S. Martina, J.-P. Fortin, C. Ménager, O. Clément, G. Barratt, C. Grabielle-Madelmont, F. Gazeau, V. Cabuil and S. Lesieur, J. Am. Chem. Soc., 2005, 127, 10676 CrossRef CAS.
- S. Lesieur, C. Grabielle-Madelmont, C. Menager, V. Cabuil, D. Dadhi, P. Pierrot and K. Edwards, J. Am. Chem. Soc., 2003, 125, 5266 CrossRef.
- M. De Cuyper and M. Joniau, Eur. Biophys. J., 1998, 15, 311.
- C. J. Meledandri, J. K. Stolarczyk, S. Ghosh and D. F. Brougham, Langmuir, 2008, 24, 14159 CrossRef CAS.
- R. Weissleder, D. D. Stark, B. L. Engelstad, B. R. Bacon, C. C. Compton, D. L. White, P. Jacobs and J. Lewis, Am. J. Roentgen., 1989, 152, 167 Search PubMed.
- (a) A. Gabizon and D. Papahadjopoulos, Proc. Natl. Acad. Sci. U. S. A., 1988, 85, 6949 CAS; (b) A. Gabizon, R. Shiota and D. J. Papahadjopoulos, J. Natl. Cancer Inst., 1989, 81, 1484 CrossRef CAS; (c) S. D. Li and L. Huang, Mol. Pharmaceutics, 2008, 5, 496 CrossRef CAS.
- M. G. Mack, J. O. Balzer, R. Straub, K. Eichler and T. Vogl, Radiology, 2001, 222, 239 Search PubMed.
- J. K. Stolarczyk, S. Ghosh and D. F. Brougham, Angew. Chem., Int. Ed., 2008, 48, 175 CrossRef.
- U. I. Tromsdorf, N. C. Bigall, M. G. Kaul, O. T. Bruns, M. S. Nikolic, B. Mollwitz, R. A. Sperling, R. Reimer, H. Hohenberg, W. J. Parak, S. Förster, U. Beisiegel, G. Adam and H. Weller, Nano Lett., 2007, 7, 2422 CrossRef CAS.
- J. F. Berret, N. Schonbeck, F. Gazeau, D. El Kharrat, O. Sandre, A. Vacher and M. Airiau, J. Am. Chem. Soc., 2006, 128, 1755 CrossRef CAS.
- S. Mornet, S. Vasseur, F. Grasset and E. Duguet, J. Mater. Chem., 2004, 14, 2161 RSC.
- S. Laurent, D. Forge, M. Port, A. Roch, C. Robic, L. Vander Elst and R. N. Muller, Chem. Rev., 2008, 108, 2064 CrossRef CAS.
- A. Roch, R. N. Muller and P. Gillis, J. Chem. Phys., 1999, 110, 5403 CrossRef CAS.
- E. Taboada, E. Rodríguez, A. Roig, J. Oró, A. Roch and R. N. Muller, Langmuir, 2007, 23, 4583 CrossRef CAS.
- O. B. Miguel, Y. Gossuin, M. P. Morales, P. Gillis and R. N. Muller, Magn. Reson. Imaging, 2007, 25, 1437 CrossRef CAS.
- C. Riviere, M.-S. Martina, Y. Tomita, C. Wilhelm, A. Tran Dinh, C. Menager, E. Pinard, S. Lesieur, F. Gazeau and J. Sezlaz, Radiology, 2007, 244, 439 Search PubMed.
- C. Sangregorio, J. K. Wiemann, C. J. O'Connor and Z. Rosenzweig, J. Appl. Phys., 1999, 85, 5699 CrossRef CAS.
- G. D. Moeser, K. A. Roach, W. H. Green, T. A. Hatton and P. E. Laibinis, AIChE J., 2004, 50, 2835 CrossRef CAS.
- D. Forge, Y. Gossuin, A. Roch, S. Laurent, L. Vander Elst and R. N. Muller, Contrast Media Mol. Imaging, 2010, 5, 126 Search PubMed.
- O. T. Bruns, H. Ittrich, K. Peldschus, M. G. Kaul, U. I. Tromsdorf, J. Lauterwasser, M. S. Nikolic, B. Mollwitz, M. Merkel, N. C. Bigall, S. Sapra, R. Reimer, H. Hohenberg, H. Weller, A. Eychmüller, G. Adam, U. Beisiegel and J. Heeren, Nat. Nanotechnol., 2009, 4, 213 CrossRef.
- H. Huang, S. Delikanli, H. Zeng, D. M. Ferkey and A. Pralle, Nat. Nanotechnol., 2010, 5, 602 CrossRef CAS.
- L. Shen, P. E. Laibinis and T. A. Hatton, J. Magn. Magn. Mater., 1999, 194, 37 CrossRef CAS.
- L. Shen, P. E. Laibinis and T. A. Hatton, Langmuir, 1999, 15, 447 CrossRef CAS.
- (a) S. Twomey, Introduction to the Mathematics of Inversion of Remote Sensing and Indirect Measurements, Dover Publications, 1997 Search PubMed; (b) C. L. Lawson and R. J. Hanson, Solving Least Squares Problems, SIAM Society for Industrial & Applied Mathematics, 1995 Search PubMed.
- http://www.stelar.it/ .
- R. Kimmich and E. Anoardo, Prog. Nucl. Magn. Reson. Spectrosc., 2004, 44, 257 CrossRef CAS.
- M. De Cuyper, P. Müller, H. Lueken and M. Hodenius, J. Phys.: Condens. Matter, 2003, 15, S1425 CrossRef CAS.
- T. J. Daou, S. Begin-Colin, J. M. Grenèche, F. Thomas, A. Derory, P. Bernhardt, P. Legaré and G. Pourroy, Chem. Mater., 2007, 19, 4494 CrossRef CAS.
- D. Maity and D. C. Agrawal, J. Magn. Magn. Mater., 2007, 308, 46 CrossRef CAS.
- J. F. Nagle and S. Tristram-Nagle, Biochim. et Biophys. Acta, 2000, 1469, 159 CAS.
- L. Finegold and M. A. Singer in Cholesterol in Membrane Models, ed: L. Finegold, Boca Raton: CRC Press, 1993, pp. 137–157 Search PubMed.
- Y. Sahoo, H. Pizem, T. Fried, D. Golodnitsky, L. Burstein, C. N. Sukenik and G. Markovich, Langmuir, 2001, 17, 7907 CrossRef CAS.
- T. Allkemper, C. Bremer, L. Matuszewski, W. Ebert and P. Reimer, Radiology, 2002, 223, 432 Search PubMed.
- M. C. Woodle and D. D. Lasic, Biochim. Biophys. Acta, 1992, 1113, 171 CAS.
- C. E. Sjögren, C. Johansson, A. Nævestad, P. C. Sontum, K. Briley-Sæbø and A. K. Fahlvik, Magn. Reson. Imaging, 1997, 15, 55 CrossRef CAS.
- T. Rheinländer, D. Roessner, W. Weitschies and W. J. Semmler, J. Magn. Magn. Mater., 2000, 214, 269 CrossRef CAS.
- J.-F. Berret, O. Sandre and A. Mauger, Langmuir, 2007, 23, 2993 CrossRef CAS.
- M. Zborowski, C. Bor Fuh, R. Green, L. Sun and J. J. Chalmer, Anal. Chem., 1995, 67, 3702 CrossRef CAS.
- R. Nakao, Y. Matuo, F. Mishima, T. Taguchi, S. Maenosono and S. Nishijima, Physica C, 2009, 469, 1840 CrossRef CAS.
- S. A. Corr, Y. K. Gun'ko, R. Tekoriute, C. J. Meledandri and D. F. Brougham, J. Phys. Chem. C, 2008, 112, 13324 CrossRef CAS.
- A. G. Roca, J. F. Marco, M. Morales and C. J. Serna, J. Phys. Chem. C, 2007, 111, 18577–18584 CrossRef CAS.
- S. Ghosh, D. Carty, S. P. Clarke, S. A. Corr, R. Tekoriute, Y. K. Gun'ko and D. F. Brougham, Phys. Chem. Chem. Phys., 2010 10.1039/c0cp00989j.
- Z. Zhou, B. G. Sayer, D. W. Hughes, R. E. Stark and R. M. Epand, Biophys. J., 1999, 76, 387 CrossRef CAS.
- T. Doherty and M. Hong, J. Magn. Reson., 2009, 196, 39 CrossRef CAS.
- A. Borthakur, M. Sochor, C. Davatzikos, J. Q. Trojanowski and C. M. Clark, NeuroImage, 2008, 41, 1199 CrossRef.
- R. McDermott, S. K. Lee, B. ten Haken, A. H. Trabesinger, A. Pines and J. Clarke, Proc. Natl. Acad. Sci. U. S. A., 2004, 101, 7857 CrossRef CAS.
- J. K. Alford, T. J. Scholl, W. B. Handler and B. A. Chronik, Concepts Magn. Reson., Part B, 2009, 35b, 1 CrossRef CAS.
- G. Bacic, M. R. Niesman, H. F. Bennett, R. L. Magin and H. M. Swartz, Magn. Reson. Med., 1988, 6, 445.
Footnotes |
| † Electronic supplementary information (ESI) available: XRD data, ATR-IR spectra, SEM and TEM images, light scattering and NMR data of aged samples. See DOI: 10.1039/c0jm01061h |
| ‡ Current Address: Department of Chemistry, University of Otago, P.O. Box 56, Dunedin, New Zealand. Fax: +64 3 479 7906; Tel: +64 3 479 5378; E-mail: cmeledandri@chemistry.otago.ac.nz |
| This journal is © The Royal Society of Chemistry 2011 |