Development of a simple model device for in vitro gastric digestion investigation
Jianshe
Chen
*,
Vishwajeet
Gaikwad
,
Melvin
Holmes
,
Brent
Murray
,
Malcolm
Povey
,
Ye
Wang
and
Ying
Zhang
School of Food Science, University of Leeds, Leeds, LS2 9JT, UK. E-mail: j.chen@food.leeds.ac.uk; Fax: +44 113 3432982; Tel: +44 113 3432748
First published on 14th March 2011
Abstract
There have been some reports in the literature of model gastric digestion systems to mimic the dynamic physiological processes within the gastrointestinal tract. However, such devices often require the specification of many control parameters making routine digestion tests unfeasible. This paper introduces a simple in vitrodigestion device, comprising of a water-jacketed glass vessel into which a spherical Teflon probe of variable diameter can be inserted. The probe is controlled by a texture analyser to simulate the kinetics of a food digestion process. Using this device under well controlled hydrodynamic flow and biochemical conditions key digestion parameters such as pH, food particle size, protein release, lipid release, cloudiness, etc, can be determined. Feasibility tests of the model device have been conducted using roasted and non-roasted peanuts particles. The status of peanut digestion was examined by the changes in particle size distribution and the mean particle size. Significant differences of surface microstructure have also been observed for peanut particles after the digestion. The influence of parameters such as food to gastric juice ratio, the probe speed and pepsin concentration have been examined in this work. Initial results confirm that all these factors influence the kinetic process of gastric digestion considerably and should be well regulated in any in vitrodigestion investigations. We propose that the model device has the advantages of easy control and operation and furthermore could be an ideal tool for routine in vitro gastric digestion studies.
Introduction
Knowledge of food disintegration in the human stomach is essential for assessing the bioavailability of nutrients and understanding the controlling mechanisms of gastric emptying. Recently, studies of human digestion behaviour and the impacts of food properties (textural, microstructural, as well as chemical and compositional) have been of great interest to food scientists and nutritionists.1,2 Various approaches, including in vivo and in vitro methods, have been employed for such investigations. Most gastric digestion studies in the past were conducted with a focus on either clinical or medical purposes, but increasing research has been carried out by food scientists in order to gain understanding of the role of food microstructural properties in the physiology of human digestion and nutrition. For example, understanding the influences of food structuring in gastric digestion;3 understanding release and bioavailability of allergenic substances from food microstructure;4 establishing processing conditions at the manufacturing stage to promote optimised and/or controlled release of macronutrients;5 strategies for controlled gastric emptying as solutions to stomach disorders, obesity, and diabetes;6 understanding lipid digestion and postprandial satiety;7,8 aiding clinical studies through design of specific food microstructure.9,10 More detailed discussion on food digestion and gastric emptying can be found in some recent review articles.2,11 It should be noted that the material inside the stomach has already been orally processed and its properties differ hugely from that before being eaten.12 In clinical terminology, the mixed mass of orally processed food and gastric juice is called chyme. However, the term ‘food’ is still commonly used in literature in relation to gastric digestion and, for convenience, this term will also be adopted in this paper.Studies in medicine, pharmacy, and clinical nutrition have demonstrated that disintegration of food and drugs inside the stomach is a highly complicated process. Food is broken down into small particulates and molecules due to both physical forces and chemical reactions.13,14 Physical forces include mechanical and hydrodynamic actions present in the stomach, resulting from the muscle contraction and peristaltic movement of the stomach wall. Stomach contractions generate a fluid flow of the gastric contents that causes a shearing effect on the food surface.15 The composition, rheology, and rate of gastric secretions is influenced by the food composition and regulated by complex hormonal signalling.2 Gastric juice is secreted from glands lining the stomach, containing gastric acid (HCl) and digestive enzymes. The presence of HCl assists acid denaturation of digested food and activates pepsin. In the fasted state, intragastric pH in healthy subjects is in the range 1.3–2.5, while eating can increase the pH up to 7.5.16 The intake of food and the increase in pH triggers a release of gastric juice. The pH can start to decrease within 20 min after ingesting a meal and recover to its natural value about two hours after meal consumption.17 Gastric juice contains 0.8–1 mg mL−1 pepsin,18,19 a key ingredient that degrades food proteins into peptides. The gastric juice penetrates the food matrix and assists in digestion, but how the acidity and enzymes of the gastric juice affect disintegration of food is not fully understood.
Apart from the gastric juice, the mechanical action and hydrodynamic flow created by the contraction waves of the stomach muscles also play a critical role in gastric digestion. The muscles of the stomach wall produce a regular patterned contraction in response to food intake. The contraction starts at the upper part of the stomach wall at a frequency of around 3 cycles per minutes. This contraction wave propagates towards the stomach antrum and pylorus at an average of 2.5 mm s−1.20 The continuous contraction forces the stomach contents to move towards the lower exit (pyloric sphincter). However, the small opening of the sphincter limits the discharge of the stomach contents into the duodenum and pressure builds up in the pylorus/antrum region. This pressure build up helps to enhance the grinding down of the food particles but more importantly also forces a retropulsive flow back to the higher gastric contents. Combined propulsive and retropulsive flow leads to mixing, shearing and surface erosion to food particles. The pattern of stomach flow has been re-constructed based on computer simulations. Fig. 1 shows a simulated velocity spectrum inside the stomach.21 There is a minimal flow at the upper part of the stomach, particularly in fundus region, and increased flow towards the lower end of stomach. The maximum speed could be as high as 7.5 mm s−1. Even though this velocity spectrum has not received any experimental confirmation, it provides valuable details of the hydrodynamic nature of stomach flow and is useful guidance for the experimental design of in vitro gastric digestion studies.
 | ||
| Fig. 1 Predicted gastric flow velocity vectors from computer simulations. Two basic antral flow patterns are produced by the propagating antrum contraction waves, retropulsive jet-like motions in the most highly occluded region, and recirculating eddy flow between pairs of antrum contraction waves. The strongest fluid motions are in the antrum region, while the fundus of the upper stomach serves as the storage space with minimal fluid movement (from ref. 21 (Pal et al., 2004), with permission). | ||
Current approaches for in vitrodigestion studies
The complex anatomy of the stomach, its regulated motility and contraction patterns, hormonal and interdigestive electrical signalling and juice secretions will all influence the disintegration process of the food it contains and the gastric emptying. Such a complexity makes it extremely difficult to mimic stomach conditions in an in vitro environment for systematic and reproducible studies. In vivo studies on stomach digestion have the benefit of being directly relevant to stomach physiology, gastric motility, accommodation, emptying, and intragastric disintegration of food. Techniques and equipment used for in vivo gastric digestion studies include breathing tests, scintigraphy, ultrasonography, and magnetic resonance imaging (MRI).2,22,23 More on in vivo gastric digestion studies can be read in a recent review by Golding and Wooster.11 One major difficulty of in vivodigestion studies is the involvement of human subjects and the associated ethical issues, which make such approaches less favourable for routine gastric digestion analysis.In vitro methods which simulate digestion of food and drugs are being extensively used at present because they are relatively straightforward, rapid, safe, and more importantly do not have the ethical restrictions of in vivo methods. These methods either simulate digestion and absorption processes (for bioavailability) or disintegration processes only (for bioaccessibility). Gastrointestinal models (GIMs) which simulate the GI digestion process under laboratory conditions can be categorized into two broad categories: static models, wherein the digesta remains largely immobile and physical processes such as hydration, mixing, shear, etc are ignored, and dynamic models which also mimic the physical and mechanical processes and temporal changes that occur in in vivo conditions (Parada & Aguilera, 2007; Kong & Singh, 2008a).2,4
A number of in vitro model systems have been reported in the literature to simulate the human GI tract for different purposes, including for gastric dissolution of drugs,24,25 nutrition availability,26 contaminant absorption,27 and disintegration kinetics of various foods.2 Some GI models were developed to assess specifically the effects of food microstructure on the bioavailability of nutrients. For example, Krul et al. used a dynamic GI model to determine the antimutagenic activity of black and green tea extracts.28 Their apparatus involved a water jacketed vessel lined with flexible interior walls. Hoebler et al. designed an in vitro digestive system which partially simulated masticatory action and physical and chemical processes in the stomach in order to understand the kinetics of carbohydrate and protein digestion.26 Chu & Beauchemin investigated the bioaccessibility of nutrients release from foods into artificial gastrointestinal fluids (saliva, gastric juice, and intestinal juice) using a flow injection and coupled plasma mass spectrometry.29GI models have also been used for prescreening mycotoxins as an alternative to animal studies.30 With a focus on the nutrients absorption in small intestine, colleagues in Birmingham developed a simple experiment rig simulating segmentation motion occurring in small intestine.31 A test on glucose absorption revealed profound importance of the viscosity of the lumen on the mass transfer and absorption of nutrient compounds.
More recently, a sophisticated digestion device, Human Gastric Simulator (HGS), has been developed in UC Davis. The device is capable to simulate the continuous peristaltic movement of stomach walls, with similar amplitude and frequency of contraction forces as reported in vivo.32 Satisfactory results have been obtained on the feasibility tests on the digestion of rice and apple samples. A commercial dynamic GI tract model, the TNO intestinal model (TIM), has been recently available. This apparatus has a control over many in vivo physiological conditions and peristaltic movements.33,34 Dynamic Digestion Model is another commercially available digestion device developed by Institute of Food Research in Norwich.35 Both models have gained a wide use in pharmacological and food testing for humans. The great advantage of these models is the capability in establishing in vitro-in vivo (IVIVC) correlations for drug dissolution and absorption studies.2 This can be attributed to its high efficacy in simulating peristaltic movement in the GI tract, its on-line control features, as well as the controlled use of enzymes and appropriate adjustment of the pH.36 However, the device is not a routine tool due to its complexity.37 Also, the model cannot quantitatively reproduce the fluid mechanics and mechanical forces involved in in vivofood disintegration.2 In addition, the model is a multi-stage design and not cheap to run. Consequently, further development of in vitro models which are capable of incorporating a complete description of the hydrodynamic flow and physical forces but that are simple in design remains a high priority.
In using in vitro methodologies to replace in vivo studies of gastric digestion, various assumptions have to be introduced. Certain compromises also have to be made in order to obtain the advantages of simplicity and controllability. In this study, the experimental design was formulated based on the following assumptions.
1. Food gastric disintegration and digestion is a dynamic process. The kinetics of digestion is regulated collectively by gastric biochemical actions, hydrodynamic flow conditions and mechanical forces.
2. Gastric digestion is influenced strongly by food–gastric interactions. Under well controlled biochemical and hydrodynamic conditions, the material properties of the food would be the dominating factor in influencing the kinetics of the digestion process.
3. The disintegration modes of foods probably include both breakage (fragmentation) and surface erosion (wear and dissolution).
The main aim of this study was to test the feasibility of an in vitrodigestion model for routine studies of food gastric digestion. The principal considerations of the design were the controllability of digestion conditions, easy operation, and reliable monitoring and recording of some key digestion indices. Controlling parameters included the chemical/biochemical environment (temperature and gastric juice composition) and the dynamic environment (extent and speed of fluid flow). The pH, particle size, texture, protein release and degradation, lipid release, cloudiness of gastric juice were the primary parameters of monitoring, though only the results of pH change and particle size variation are reported in this paper.
Materials and methods
Red skin peanuts purchased from a local supermarket (Morrisons Supermarket PLC, Leeds, UK) were used for this feasibility study. Peanuts were used both raw (unroasted) and roasted to compare the effects of roasting on the digestion process. Roasted peanuts were prepared in AEG Micromat microwave oven (Type E EH 8108, Germany) at level 2 for 2 min (100 g each time). The peanuts were subsequently peeled and milled in a food processor to produce particulate samples required for analysis. Vibration dry sieving was used to separate particles based on difference in particle size. Endecotts vibration sieving set (BS4100, Endecotts, London, England) was used for this purpose. Selection of sample size was based on literature values reported by Jalabert-Malbos et al.38 They indicated that after oral mastication and before being swallowed over 90% of peanut particles were smaller than 2mm; the median particle size (the size at the 50% of cumulative weight fraction) was 0.82 mm. To facilitate convenient sample handling, particles in the size range of 1 mm–1.4 mm in diameter (particles which collected on a sieve with a size of 1 mm, but that passed through a 1.4 mm sieve) were selected for analysis. However, some variations in initial particle size were observed due to the lack of control of size reduction and sieving. Therefore, in order to minimize experimental error, a batch of peanut particles was obtained each time for a set of experiments.Simulated gastric juice was prepared with pepsin from porcine gastric mucosa (1 g dm−3), mucin from porcine stomach, Type III, (1.5 g dm−3), and NaCl (8.775 g dm−3), and pH 1.3 to 1.5, adjusted using 2 M HCl.2,27 All chemicals were purchased from Sigma-Aldrich, Inc. (U.K).
The in vitro digesting device
The in vitrodigestion device consists essentially of a jacketed glass vessel and a spherical Teflon probe. Fig. 2 illustrates the key features of the design. The internal diameter of the vessel is 40 mm and the internal height is 140 mm. The bottom part of the vessel is a hemisphere with a radius of 20 mm, which gives vessel a net total volume of 168 ml. The hemispherical bottom design was to avoid any fluid stagnation zones and to ensure a continuous fluid flow. The spherical Teflon probe of 28 mm in diameter was attached to the load cell of the Texture Analyser (Stable Microsystems, Surrey, UK) via a thin rod adaptor made of stainless steel and surrounded by a sheath of Teflon. The probe can be moved up and down under the control of the Texture Analyser. The guiding principal was that probe movement relative to the wall of the vessel creates a similar flow pattern to that of the contraction waves of the stomach wall (see Fig. 1).21 The maximum flow speed of the cell content occurs at the narrowest gap between the probe surface and the glass wall and can be easily calculated based on the volume conservation principle when the probe oscillates vertically up or downwards, as follows, | (1) |
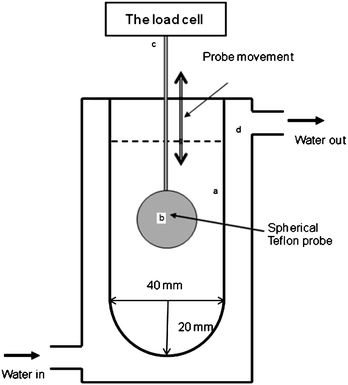 | ||
| Fig. 2 Illustrative diagram of the digestive cell (a). A spherical probe made of Teflon (b) is attached to the load cell of a texture analyser (c) and moved up and down at a controlled speed and distance. A water circulation (d) was connected to maintain a body temperature. | ||
Simulated gastric juice (100 mL) was loaded inside the vessel chamber. The chamber was maintained at 37 °C via a water circulation bath. The vessel was sealed to prevent moisture loss by a Teflon lid which had a small opening in the centre allowing free vertical movement for the probe shaft. The stepper motor has an operational range of 0.01 to 40 mm s−1, which is wide enough to create hugely different flow in the fluid contents. The probe movement was adjusted so that at its lowest point there was a clearance of 5 mm between the probe and interior base of the vessel. The distance of probe travel was set to 60 mm, which gave a similar clearance between the surface of the fluid and the top of the probe when it reached its top position. The digestion test was set by the number of cycles of probe movements, which determined the total digestion time. At the completion of each test, the pH of the gastric content was measured by dipping a pH electrode into the cell. After that, the content was neutralised immediately with 2 M NaOH. This neutralisation was essential to terminate any enzymatic and acidic reactions. Pepsin is most active at low pHs (around 2–4), but loss its functionalities at neutral pH conditions.36 Fluid samples were then taken for particle size measurements after neutralisation.
Particle size analysis
Size distributions of peanut particles before and after digestion tests were monitored using a Malvern Mastersizer Hydro2000G (Malvern Instruments, UK), capable of covering a size range from 0.01 mm to 2000 mm. The refractive index (RI) of peanut was set at 1.55 and absorption index was set at zero. There are no literature values for these optical properties. The choice of the two indices was made based on the best data fitting of closest residual and weighted residual values, as recommended by Malvern. Volume average particle size, d43, was used for the characterisation of size change and is defined by the following equation. | (2) |
All digestion experiments were conducted with at least three repeats. Particle size distribution of each digested sample was measured twice to make sure measurement reproducibility. The average particle size shown in graphs was the mean of at least of six measurements. Standard deviations were calculated and given in graphs where appropriate.
Fluid flow simulations
In this section, given the relative simplicity of the digestion device we illustrate how the system is amenable to mathematical modelling. To accurately evaluate the fluid and particle motions during gastric mixing requires the simultaneous solution of the interactions between the fluid and the particulate matter. This has been successfully undertaken by Pal et al. (2004) using the Lattice Boltzmann method although other discrete methods may also be employed, e.g. Discrete Element Methods (DEM).40 These studies indicate that many particle-fluid interactions may be addressed e.g. buoyancy. Pal et al. (2004) also addressed the gastric muscle contractile behaviour. In this study we seek only to model the fluid flow conditions to enable appropriate selection of fluid characteristics e.g. viscosity. In this sense we are modelling the continuum limit of small particles within the fluid.To investigate the fluid flow and pressures generated within the device during the mixing cycle we established a mathematical model using the precise geometric dimensions and operating velocities and travel of the gastric device and the physical parameters of typical gastric fluids.
The general description of the equations of motion for an incompressible fluid is supplied by the well known Navier–Stokes and continuity equations as shown in eqn (3) and eqn (4):41,42
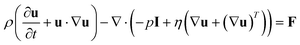 | (3) |
| ∇·u = 0 | (4) |
Here u is the velocity vector of the fluid, ρ is the density, I is the unit diagonal matrix, η is the viscosity and F is the volume force. These equations were solved using the commercially available solver COMSOL Multiphysics® (COMSOL, Inc., http://www.comsol.com Version 3.5a, Stockholm, Sweden). Due to the oscillatory motion of the probe, the model utilised a moving-mesh geometry to accurately map the probe position and the corresponding velocity field of the fluid.
Results and discussion
Mixing tests
The device was first tested for its efficiency of mixing. Plastic beads of two different colours (Gutermann Rocailles 9/0, 2 mm in diameter, purchased from Hobbycraft shop in Leeds) were used for this purpose. Beads density (not measured) is significantly higher than that of water and naturally settle down to the bottom of the vessel. Fig. 3 shows the images taken after sequential mixing with the probe moving at 10 mm s−1. It can be seen that, within only about 6 cycles (i.e. a total of 72 s), the two types of beads were effectively completely mixed up with the two types coloured beads homogeneously distributed. This efficient mixing was achieved by the pushing and shearing actions created by the probe movement. This suggests that every part of the content (or each individual granular particle) was subject to a continuous mechanical action and that there were no stagnation zones in the system. | ||
| Fig. 3 Sequential mixing patterns of beads a) through to f) for six mixing cycles. The probe is programmed for an oscillation of 60 mm in distance at a travel velocity of 10 mm s−1 and each cycle takes 12 s. Two equal portions of differently coloured beads became uniformly mixed after only six cycles of probe movement. | ||
Fluid flow simulations
The simplicity of the digestion device has a unique convenience for mathematical modelling to simulate the fluid flow and pressures generated within the device where we may prescribe viscous fluids comparable with gastric conditions. To demonstrate this advantage, Fig. 4 shows the velocity profiles as solved using the moving mesh (ALE) facility of COMSOL Multiphysics® at 0.5 s intervals. For illustrative purposes model parameters were ρ = 1000 kg m−3, η = 0.0151 Pa s, and the vertical velocity of the probe was modelled as sinusoidal function vy = 20sin(2πt) [mm s−1]. The probe radius used for simulation was 16 mm, slightly higher than that of the probe for digestion experiments. The velocity fields solved using the COMSOL model clearly demonstrate that retropulsive flow is generated and which produce velocities in the range 0–56 mm s−1. In prescribing different operating conditions and physical parameters upon the system we may simulate a variety of gastric test scenarios (e.g. assess the effect of temperature by selecting appropriate dynamic viscosities).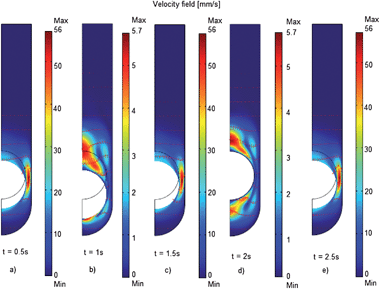 | ||
| Fig. 4 Velocity fields and vectors at t = 0.5, 1, 1.5, 2 and 2.5 s a) through to e) of the gastric digester as modelled using a fluid dynamics model. Mathematical model using a moving mesh domain in COMSOL Multiphysics® exploiting the radial symmetry of the system. Here a 16 mm spherical Teflon probe has been modelled. Note that the maximal velocities are attained at mid-points of the motion cycle. | ||
The changes of pH and the importance of food to gastric juice ratio
Two separate digestion tests were first performed with two different ratios of peanut particles to gastric juice. In the first test, 5 g of milled peanut particles were loaded into the vessel containing 100 ml gastric juice. This gave a weight ratio of sample to gastric juice of 1![[thin space (1/6-em)]](https://www.rsc.org/images/entities/char_2009.gif) :20. It was observed that, the particles quickly sank to the bottom of the vessel. The probe was capable to touching and pushing particles at its lowest position during the test. In the second test, 12.5 g of peanut particles were loaded in the vessel, giving sample to gastric juice ratio of 1:8. Due to the thicker layer of sedimented particles, the probe achieved good contact with the particles promoting motion within the gastric juice.
:20. It was observed that, the particles quickly sank to the bottom of the vessel. The probe was capable to touching and pushing particles at its lowest position during the test. In the second test, 12.5 g of peanut particles were loaded in the vessel, giving sample to gastric juice ratio of 1:8. Due to the thicker layer of sedimented particles, the probe achieved good contact with the particles promoting motion within the gastric juice.
Recording the pH during the digestion tests showed a continuous increase of the pH (see Fig. 5). It appeared that the extent of pH increase depended highly on the amount of food. For experiments with only 5 g peanut particles (food to gastric juice ratio 1:20), the final pH was close to 3 after one hour digestion. But for systems containing 12.5 g peanut particles (food to gastric juice ratio 1:8), the pH was ≥ 4.5 after the same period of digestion. It was also observed that the rate of pH change was the most dramatic at the early stage of digestion. For food to gastric juice ratio 1:20, the pH changed rapidly in the first 20 min and then remained little changed afterwards. At the higher food to gastric juice ratio 1:8, the pH changed quickly in the first half hour, but very limited change occurred during the remaining part of digestion period. The initially rapid increase in pH suggests quick consumption of acid in the digestion process. However, the relatively steady pH in the later part of the test does not necessarily imply a slowing down of digestion. Separate studies conducted have shown continuous protein release from peanut particles even though pH remained little changed in the later stages of the digestion test (data not shown).
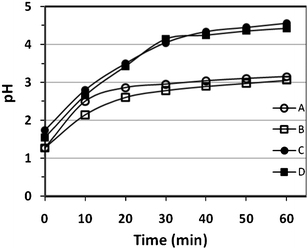 | ||
| Fig. 5 Recorded pH changes of the various systems as a function of digestion time (in a total volume of 100 ml simulated gastric juice A: 5 g non-roasted peanut, 1–1.4 mm; B: 5 g roasted peanut, 1–1.4 mm; C: 12.5 g non-roasted peanut, 1–1.4 mm; D: 12.5 g roasted peanut, 1–1.4 mm). All pH measurements were repeated and in very good reproducibility. | ||
The immediate increase in pH indicates swift digestion action once peanuts particles are exposed to the gastric environment. In this investigation, only dry peanut particles were used (i.e. no salivary fluid was involved) and their addition to the gastric juice should not lead to any dilution effect. However, in in vivo stomach digestion, a significant increase of pH to close to neutral values has been reported after meal consumption, probably due to both the digestion process and the dilution of the gastric juice. About 20 min after meal ingestion, the pH starts to decrease again because of the continuous secretion of gastric juice. It appeared that roasting and particle size had a limited effect on pH change, (see Fig. 5). However, the food to gastric ratio seems to be a very important controlling parameter, influencing not only the rate of pH change but also more importantly the final pH of digestion. At a ratio of 1:20, the final pH reached about 3, but with a ratio of 1:8, final pH could reach >4.5. At the >4 pH value, the enzymatic activities of pepsin could be significantly weakened, though binding of pepsin with substrate has been confirmed as still possible at pH 5.39 In view of the above results a ratio of 1:20 was applied in the following digestion tests.
Effect of changes of peanut particle size
Changes of particle size have been used as the principal parameter to monitor the digestion process. Particle size distribution and mean particle size of peanut granules were measured before digestion and after a set period of digestion. Fig. 6 shows examples of particle size distributions of non-roasted peanut particles before the digestion and after being digested for 1 h. Even though peanut particles were collected through sieve sizes between 1 mm and 1.4 mm, it was observed that the real particle size range was much wider, with some particles smaller than 10 mm and some as large as 2 mm. There are a few possible reasons for such wide particle size distributions. Firstly, artefacts from Mastersizer measurements could be a cause, due to the approximate setting of optical parameters for peanut particles. Secondly, it was observed that there was a strong tendency for adhesion among peanut particles as a result of oil release from the damaged plant cells. Formation of particle clusters was also inevitable during size reduction and sieving, where small particles stick together in the presence of small amounts of oil and fail to pass through the set sieve. Despite this, Fig. 6 shows a clear shift towards smaller particle size after one hour digestion. The mean particle size d43 decreased from 0.50 mm before the digestion to 0.38 mm after the digestion period. For roasted peanuts, more limited particle sticking was noticed after size reduction. Therefore, single peak size distributions were observed for such systems. | ||
| Fig. 6 Example of particle size distributions of non-roasted peanut particles before and after 60 min in vitrodigestion at a pepsin concentration of 1 g dm−3. | ||
The size change as a function of digestion time has been monitored for particles of both roasted and non-roasted peanuts. It was observed that non-roasted peanut particles remained little changed in particle size during the first half hour of digestion (Fig. 7a) but started to decrease in size afterwards, with around 25% reduction in mean particle size (d43) after one hour in vitrodigestion (Fig. 7c). For particles of roasted peanuts, the size varied in a very different pattern. The roasted particles showed a fast increase in size during the first half hour of digestion and then a gradual decrease in size over the remaining digestion process (Fig. 7b and 7d). An increase in d43 as high as 45% was observed after 30 min digestion and a longer time period for size reduction to take place. Only after approximately 1.5 h was a smaller mean particle size observed taking about 3 h to achieve a 25% decrease in d43.
 | ||
| Fig. 7 Particle size changes of roasted and non-roasted peanuts as a function of digestion time (a and c: non-roasted peanut particles; b and d: roasted peanut particles). | ||
The above results suggest that size increase and decrease could occur simultaneously during gastric digestion of peanut particles. We speculate that the observed particle size changes are attributable to two simultaneous mechanisms. Particle size decrease during digestion is fully expected because of gastric actions (mechanical, chemical, and biochemical). However, initial particle size increase is also not at all surprising. This is because dry solid particles are still capable of absorbing moisture from the gastric juice and expand. Separate examinations of the mechanical strength of the peanut particles before and after digestion showed significant hardness decrease after the digestion (data not shown) clear evidence of moisture intake and particle softening. It should be noted that such moisture intake is a diffusion process regulated by the effective diffusion coefficient. In theory, the rate of moisture diffusion and rate of particle size expansion can be experimentally determined and quantified. It is therefore practically possible to establish the kinetics of the gastric digestion of peanut particles based on such measurements although this has not yet been attempted from these initial results.
It should be noted that the deviation shown in Fig. 7 is sometimes quite significant. There could be two possible sources of experimental errors: the digestion experiment itself and the particle size characterisation. In order to make sure that correct conclusion can be made, a number of repeats (at least three repeats for each digestion experiment) for each test. Even though deviation is not negligible, the overall trend and pattern of peanut digestion were also obvious.
The effects of roasting on digestion have also been confirmed by their very different surface microstructures. Fig. 8 shows CLSM surface images of peanut particles before and after one hour digestion for both non-roasted and roasted peanuts. Before digestion, both types of peanuts showed naturally fractured surfaces with no particular morphological features. But after the digestion, individual plant walls were unmistakably identifiable. For non-roasted peanut particles, their surfaces appeared to be much smoother after the digestion process. Each plant cell appeared to contain abundance of tightly packed granules. However, for roasted peanuts the digestion led to a completely different surface microstructure. Individual plant cells were still clearly identifiable, but particle surfaces were much more hollowed out with very few granules observable at the surface. Not surprisingly, the (cellulose) plant cell wall appeared to be much more resistant to gastric digestion than its (protein) contents. However, after the release of the cell contents, the cell wall becomes fully exposed and it is envisaged that it may be stripped away by the combined hydrodynamic and mechanical action. There is no clear evidence to suggest that the peanut particles break up into smaller sizes during digestion. It is therefore reasonable to suggest that surface erosion plays a dominant role in peanut digestion.
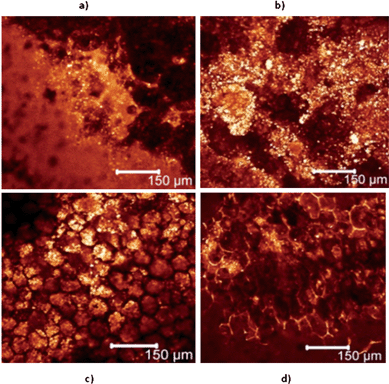 | ||
| Fig. 8 Surface microstructure as observed by CLSM of peanut particles before and after in vitrodigestion, a) non-roasted peanut particle before digestion, b) roasted peanut particle before digestion, c) non-roasted peanut particle after 60 min digestion, d) roasted peanut particle after 60 min digestion. | ||
It should be noted that the velocity profiles applied here were somewhat different from that predicted by Pal et al.21 We have no evidence yet which velocity profile or hydrodynamic flow was most closely correlated to the real hydrodynamic condition in stomach. However, the current experimental set up is flexible enough to cover a much wider range of hydrodynamic conditions.
Tests of controllable parameters of in vitro gastric digestion
Two controlling parameters have been tested at this feasibility stage: the speed of probe moving and the concentration of pepsin. The former was to test for the effect of mixing and hydrodynamic flow and the latter was for the effect of enzymatic reactions. Fig. 9 shows the mean particle size changes after one hour digestion for non-roasted peanuts when the probe was set at speeds of 6, 12, 18 and 24 mm s−1. The mean particle size before digestion is also given for reference. It is seen that speed of probe of movement is a very important factor influencing digestion. A low probe speed has little effect on peanut digestion. There was no significant change in mean particle size for speeds at 6 and 12 mm s−1. However, when the probe moved at speeds higher than 18 mm s−1, significant particle change was observed. There seems to be a step change at probe speed of 18 mm s−1. However, the exact reason of the change is yet not known. But one may speculate that increased flow dynamic and surface movement are the possible causes. At 18 mm s−1, the maximum fluid flow between the gap was calculated to be around 19.2 mm s−1, much higher than that (7.5 mm s−1) predicted by Pal et al.21 The large discrepancy between the maximum fluid flow speed in this experimental set up and the predicted value by Pal et al.21 is probably not at all surprising. The predicted value was a result of computer modelling of an irregular geometry and it should be noted that the Pal simulation has so far received no experimental proof. We propose that the speed of probe movement could be used as a control parameter and that this could provide valuable insight into the effects of hydrodynamic flow and mechanical mixing on the kinetics of gastric digestion. With the given simplicity of the device, the flow dynamics can be easily characterised with the help of COMSOL simulation, as has been demonstrated in previous sections.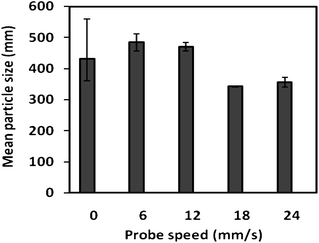 | ||
| Fig. 9 Effect of probe speed on the digestion kinetics of non-roasted peanut particles. The mean particle size was measured after one hour in vitrodigestion. Speed zero means a stationary system with no probe movement at all. | ||
Three different levels of pepsin concentration (0, 1.0 g L−1, and 3.2 g L−1) have been examined. Pepsin is a member of the proteinases group naturally secreted in human stomach and is the enzyme(s) responsible attacking and degrading proteins. Therefore, the availability of an appropriate amount of pepsin is essential for gastric digestion of protein-containing foods.18 Varying pepsin concentration could lead to a changed rate of digestion. Fig. 10 shows the effect of gastric composition on the particle size change of non-roasted peanut particles after one hour digestion. Results were the average of at least three experiments. Deviations between experiments had been observed. However, the overall trend was clearly evident. It was observed that without pepsin there was a small increase in particle size after one hour digestion. This suggests that without enzymatic activity, mechanical (and acidic) actions alone cause little break down (via surface erosion) of peanut particles. It is likely that the slight particle size increase is again caused by moisture intake which possibly could offset size reduction due to surface erosion. However, in the presence of increased pepsin concentrations (1.0 g l−1, and 3.2 g l−1), the peanut particles showed a significant decrease in mean particle size after one hour digestion. There seems little doubt that the observed size decrease can be attributed to the increased availability of pepsin and enhanced enzymatic activity. Since the in vivo profiles of gastric composition are not readily available, pepsin concentration is one of the main parameters that should be properly regulated in any experimental set up of in vitro gastric digestion.
 | ||
| Fig. 10 The mean particle size of non-roasted peanut particles before and after 1 h digestion in simulated gastric juices containing no pepsin concentrations of 1 g l−1, and 3.2 g l−1. | ||
Summary
In this work, the design principles and experimental set up of a simple model device for in vitro gastric digestion have been discussed. Initial feasibility tests suggest that the device is reliable and easy to use. Experimental conditions were also easily controllable and adjustable. Using the example of peanut particles, both roasted and non-roasted, we have demonstrated that changes in pH, particle size, and surface microstructure can be monitored and be used as useful indices for the characterisation and quantification of digestion processes. Parameters that influence gastric digestion (such as digestion time, pepsin concentration, food to gastric juice ratio, shearing and hydrodynamic flow, etc) can be easily controlled for this experimental set up and effects of these factors on peanut digestion have been demonstrated. We propose that this model device could be an ideal tool for routine investigations of in vitrofood gastric digestion.Acknowledgements
Authors would like to thank Prof. Eric Dickinson and Dr Rammile Ettelaie for useful discussions on gastric digestion.References
- B. O. Schneeman, Br. J. Nutr., 2007, 88, S159–S163.
- F. Kong and R. P. Singh, J. Food Sci., 2008, 73, R67–R80 CrossRef CAS.
- I. Norton, S. Moore and P. Fryer, Obes. Rev., 2007, 8, 83–88 Search PubMed.
- J. Parada and J. M. Aguilera, Journal of Food Science, 200, 72, 21–32 Search PubMed.
- I. Norton, P. Fryer and S. Moore, AIChE J., 2006, 52, 1632–1640 CrossRef CAS.
- C. K. Rayner, M. Samsom, K. L. Jones and M. Horowitz, Diabetes Care, 2001, 24, 371–381 CrossRef CAS.
- J. Maldonado-Valderrama, A. P. Gunning, M. J. Ridout, P. J. Wilde and V. J. Morris, Eur. Phys. J. E, 2009, 30, 165–174 CrossRef CAS.
- L. Marciani, R. Faulks, M. S. J. Wickham, D. Bush, B. Pick, J. Wright, E. F. Cox, A. Fillery-Travis, P. A. Gowland and R. C. Spiller, Br. J. Nutr., 2009, 101, 919–928 CrossRef CAS.
- C. J. Kenyon, F. Brown, G. R. McClelland and I. R. Wilding, Pharmacol. Res., 1998, 15, 417–422 CAS.
- T. Sanz and H. Luyten, Food Hydrocoll., 2006, 20, 703–711 CrossRef CAS.
- M. Golding and T. Wooster, Curr. Opin. Colloid Interface Sci., 2010, 15, 90–101 CrossRef CAS.
- J. Chen, Food Hydrocoll., 2009, 23, 1–25 CrossRef CAS.
- J. L. Urbain, J. A. Siegel, N. D. Charkes, A. H. Maurer, L. S. Malmud and R. S. Fisher, European Journal of Nuclear Medicine and Molecular Imaging, 1989, 15, 254–259 Search PubMed.
- L. Marciani, P. A. Gowland, R. C. Spiller, P. Manoj, R. J. Moore, P. Young and A. J. Fillery-Travis, Am. J. Physiol.—Gastrointestinal Liver Physiol., 2001, 280, G1227–G1233 Search PubMed.
- A. Pal, B. Abrahamsson, W. Schwizer, G. S. Hebbard and J. G. Brasseur, Gastroenterology, 2003, 124, A673–A674 CrossRef.
- F. Kong and R. P. Singh, Food Biophys., 2009, 4, 180–190 CrossRef.
- J. R. Malagelada, G. F. Longstreth, W. H. J. Summerskill and V. L. W. Go, Gastroenterology, 1976, 70, 203–210 CAS.
- J. Tang, in Handbook of Proteolytic Enzymes, ed. A. J. Barrett , N. D. Rawlins and J. F. Woessner, London, Academic Press, 2002, pp. 805–820 Search PubMed.
- M. Vertzoni, J. Dressman, J. Butler, J. Hempenstall and C. Reppas, Eur. J. Pharm. Biopharm., 2005, 60, 413–417 CrossRef CAS.
- M. A. Kwiatek, A. Steingoetter, A. Pal, D. Menne, J. G. Brasseur, G. Hebbard, P. Boesiger, M. Thumshirn, M. Fried and W. Schwizer, J. Magn. Reson. Imaging, 2006, 24, 1101–1109 CrossRef.
- A. Pal, K. Indireshkumar, W. Schwizer, B. Abrahamsson, M. Fried and J. G. Brasseur, Proc. R. Soc. London, Ser. B, 2004, 271, 2587–2594 CrossRef.
- L. Marciani, P. A. Gowland, R. C. Spiller, P. Manoj, R. J. Moore, P. Young, S. Al-Sahab, D. Bush, J. Wright and A. J. Fillery-Travis, J. Nutr., 2000, 130, 122–127 CAS.
- K. Schulze, Neurogastroenterol. Motil., 2006, 18, 172–183 CrossRef CAS.
- S. Aoki, K. Uesugi, K. Tatsuishi, H. Ozawa and M. Kayano, Int. J. Pharm. Med., 1992, 85, 65–73 Search PubMed.
- S. Aoki, H. Ando, K. Tatsuishi, K. Uesugi and H. Ozawa, Int. J. Pharm., 1993, 95, 67–75 CrossRef CAS.
- C. Hoebler, G. Lecannu, C. Belleville, M. F. Devaux, Y. Popineau and J. L. Barry, Int. J. Food Sci. Nutr., 2002, 53, 389–402 CrossRef CAS.
- A. G. Oomen, C. J. M. Rompelberg, M. A. Bruil, C. J. G. Dobbe, D. P. K. H. Pereboom and A. J. A. M. Sips, Arch. Environ. Contam. Toxicol., 2003, 44, 281–287 CrossRef CAS.
- C. Krul, A. Luiten-Schuite, A. Tenfelde, B. van Ommen, H. Verhagen and R. Havenaar, Mutation Res., 2001, 474, 71–85 CrossRef CAS.
- M. Chu and D. Beauchemin, J. Anal. At. Spectrom., 2004, 19, 1213–1216 RSC.
- G. Avantaggiato, R. Havenaar and A. Visconti, Food Chem. Toxicol., 2003, 41, 1283–1290 CrossRef CAS.
- A. Tharakan, I. T. Norton, P. J. Fryer and S. Bakalis, J. Food Sci., 2010, 75, 339–346.
- F. Kong and R. P. Singh, J. Food Sci., 2010, 75, E627–E635 CrossRef CAS.
- S. Blanquet, E. Zeijdner, E. Beyssac, J.-P. Meunier, S. Denis, R. Havenaar and M. Alric, Pharmacol. Res., 2004, 21, 585–91 CAS.
- C. Mitea, R. Havenaar, J. Wouter Drijfhout, L. Edens, L. Dekking and F. Koning, Gut, 2008, 57, 25–32 CAS.
- M. Wickham, Plant Bioscience Ltd, Norwich Research Institute, World Intellectual Property Organization, WO 2007/010238.
- S. Souliman, S. Blanquet, E. Beyssac and J. M. A. Cardot, Eur. J. Pharm. Sci., 2006, 27, 72–79 CrossRef CAS.
- J. Y. Yoo and X. D. Chen, Int. J. Food Eng., 2006, 2(4) Search PubMed , article 4.
- M. L. Jalabert-Malbos, A. Mishellany-Dutour, A. Woda and M. A. Peyron, Food Qual. Preference, 2007, 18, 803–812 Search PubMed.
- N. B. Roberts, Aliment. Pharmacol. Ther., 2006, 24, 2–9 CrossRef CAS.
- H. P. Zhu, Z. Y. Zhou, R. Y. Yang and A. B. Yu, Chem. Eng. Sci., 2007, 62 Search PubMed.
- L. D. Landau and E. M. Lifshitz, Fluid Mechanics, Pergamon, London, 1959 Search PubMed.
- D. J. Tritton, Physical Fluid Dynamics, Clarendon Press, Oxford, 2nd edn, 1988, pp. 52–60 Search PubMed.
| This journal is © The Royal Society of Chemistry 2011 |