DOI:
10.1039/C0FO00092B
(Paper)
Food Funct., 2011,
2, 137-141
Interaction of dietary flavonoids with gamma-globulin: molecular property-binding affinity relationship aspect
Received
22nd July 2010
, Accepted 13th December 2010
First published on 12th January 2011
Abstract
The molecular property-affinity relationship of dietary flavonoids for bovine gamma-globulin (γ-globulin) was investigated by fluorescence titration analysis. The quenching effects of flavonoids on γ-globulin fluorescence depended on the structures of flavonoids. The magnitudes of binding constants between flavonoids and γ-globulin were within the range of 103–105 L mol−1. These data were much smaller than the affinities between flavonoids and purified bovine and human serum albumins. The affinities of flavonoids for γ-globulin were strongly influenced by the structural differences of the compounds under study. The affinities for γ-globulin decreased with increasing partition coefficients and increased with increasing hydrogen bond acceptor numbers of flavonoids, which suggested that the binding interaction was mainly caused by hydrogen bond forces.
Introduction
Dietary flavonoids are most important polyphenols in plant foods.1–3 They are of great interest for their bioactivities, which are basically related to their antioxidative properties.4,5 The different structures of flavonoids come from various patterns of substitution through hydroxylation, methoxylation, sulfonation, acylation, prenylation, or glycosylation.6 The structural differences significantly affect their absorption, metabolism, and bio-activities in vivo.7–9
Flavonoids in plasma are bound to plasma proteins such as human serum albumin (HSA), a1-acid glycoprotein (AAG), lipoproteins and globulins, to some degree. The flavonoids-protein interaction is reversible in that the flavonoids-complex can dissociate and release the free flavonoids. According to the free drug hypothesis,10 the drug distribution within the body is generally held to be driven by the free concentration of unbound drug in the circulating plasma. Gamma-globulin (γ-globulin) is a fraction from liquid human serum, containing the antibodies (primarily IgG) of normal adults. Gamma-globulin is capable of binding an extraordinarily diverse range of metabolites, drug, organic compounds and relevant antigens.11
Fluorescence spectroscopy is an appropriate method to determine the interaction between drugs and proteins.11–13 By means of analysis of the fluorescence parameters, much information concerning the structural changes in serum albumins can be obtained.
Recently, the interactions between flavonoids with immunoglobulin have attracted great interest.14,15 Few reports, however, have focused on the structure-affinity relationship of flavonoids on the affinities for γ-globulin. The present work concerns the relationship between the molecular properties of dietary flavonoids and their affinities for γ-globulin. Thirty-five flavonoids (Table 1) were studied.
Table 1 The affinities of flavonoids for γ-globulin
Materials and methods
Apparatus and reagents
The fluorescence spectra were recorded on a JASCO FP-6500fluorometer (Tokyo, Japan). γ-Globulin (∼99%, lyophilized powder) and 7-hydroxyflavone (99.5%) was purchased from Sigma Co. (MO, USA). Biochanin A, genistein, apigenin, puerarin, catechin (C), epicatechin (EC), and luteolin (99.0%) were purchased from Aladin Co. Ltd. (Shanghai, China). Flavone, chrysin, and baicalein (99.5%) were obtained commercially from Wako Pure Chemical Industries (Osaka, Japan). Kaempferide, kaempferol, tangeretin, nobiletin, quercetin, myricetin, daidzein, baicalin, hispidulin, kaempferitrin, galangin, fisetin, genistin, dihydromyricetin, (-)-epigallocatechin (EGC), (-)-epicatechin gallate (ECG), (-)-epigallocatechin gallate (EGCG), gallocatechin gallate (GCG), tectorigenin, and formononetin (>98.0%) were obtained commercially from Shanghai Tauto Biotech Co. Ltd (Shanghai, China). The working solutions of the flavonoids (1.0 × 10⁻³ mol L−1) were prepared by dissolving each flavonoid with methanol. Tris-HCl buffer (0.20 M, pH 7.4) containing 0.10 mol L−1NaCl was selected to keep the pH value and maintain the ionic strength of the solution. The working solution of γ-globulin (1.0 × 10⁻⁵ mol L−1) was prepared with tris-HCl buffer and stored in refrigerator prior to use. All other reagents and solvents were of analytical grade and all aqueous solutions were prepared using newly double-distilled water.
The fluorescence spectra were recorded in the wavelength range of 310–450 nm upon excitation at 295 nm when γ-globulin samples were titrated with flavonoids. In each titration, the fluorescence spectrum was collected with the concentrations of γ-globulin at 1.0 × 10⁻⁵ mol L−1. Each fluorescence intensity determination was repeated and found to be reproducible within experimental errors. The binding experiments for determination of binding constants for protein were repeated three times. The experimental errors were less than 4.0%.
Results and discussion
Effect of flavonoids on γ-globulin fluorescence
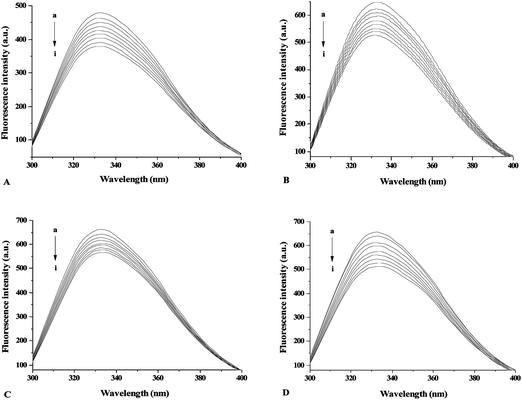
As representative examples, the fluorescence spectra of γ-globulin after addition of apigenin, galangin, formononetin, and genistein were shown in Fig. 1 (the fluorescence spectra of γ-globulin quenched by other flavonoids are not given here). Except for EC, EGC, and C, all flavonoids tested can quench the fluorescence of γ-globulin remarkably with increasing concentration of flavonoids. There are no obvious shifts of the maximum λem of γ-globulin fluorescence for flavonoids tested, which is different with the data of recent similar studies for bovine serum albumin.16–19
The quenching percentages (((F0 − F)/F0) × 100%) of γ-globulin fluorescence emission at 332.8 nm for all flavonoids at 8.0 μmol L−1 were shown in Fig. 2. The quenching percentages were determined as: EC < catechin < EGC < genistin < dadzein < formononetin < EGCG < GCG < puerarin < narirutin < dihydromyricetin < ECG < 7ohflavone < naringin < galangin < rutin < naringenin < biochanin A < fisetin < myricetin < apigenin < kaempferide < genistein < tectorigenin < flavone; < baicalein < kaempferitrin < chrysin < hispidulin < kaempferol < quercetin < luteolin < baicalin < tangeretin < nobiletin. These results indicated that the quenching effects of flavonoids on γ-globulin fluorescence depended on the structures of the flavonoids. Some of the structural elements that influence the quenching effects of flavonoids for γ-globulin are the following: (i) one or more hydroxyl groups in the rings A and B (e.g.3′,4′-dihydroxylatedcatechol group) of flavonoids enhanced the quenching effects on γ-globulin fluorescence. (ii) presence or absence of an unsaturated 2,3-bond in conjugation with a 4-carbonyl group, characteristic of flavonols structure, has been associated with stronger quenching effects on γ-globulin fluorescence; (iii) glycosylation of flavonoids affected the quenching effects on γ-globulin fluorescence depending on the conjugation site and the class of sugar moiety; (iv) galloylated catechins exhibited higher quenching effects on γ-globulin fluorescence than non-galloylated forms.
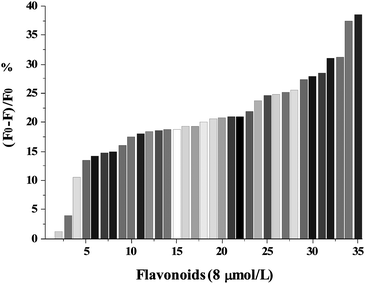 |
| | Fig. 2 The quenching percentages ((F0 − F/F0) × 100%) of γ-globulin fluorescence emission at 340 nm for all flavonoids at 8.0 μmol L−1. The quenching percentages were determined as increasing follow: 1, EC; 2, catechin; 3, EGC; 4, genistin; 5, dadzein; 6, formononetin; 7, EGCG; 8, GCG; 9, puerarin; 10, narirutin; 11, dihydromyricetin; 12, ECG; 13, 7ohflavone; 14, naringin; 15, galangin; 16, rutin; 17, naringenin; 18, biochanin A; 19, fisetin; 20, myricetin; 21, apigenin; 22, kaempferide; 23, genistein; 24, tectorigenin; 25, flavone; 26, baicalein; 27, kaempferitrin; 28, chrysin; 29, hispidulin; 30, kaempferol; 31, quercetin; 32, luteolin; 33, baicalin; 34, tangeretin; 35, nobiletin. | |
Quenching constants
Fluorescence quenching was described by the Stern–Volmer equation:14–20| | | F0/F = 1 + Kqτ0 [Q] = 1 + KSV [Q] | (1) |
where F0 and F represent the fluorescence intensities of γ-globulin in the absence and in the presence of flavonoids, Kq is the quenching rate constant, KSV is the dynamic quenching constant, τ0 is the average lifetime, and [Q] is the concentration of flavonoids.
Fig. 3 showed the Stern–Volmer plots for γ-globulin fluorescence quenched by apigenin, galangin, formononetin, and genistein. As seen from Fig. 3, the Stern–Volmer plots for genistein are linear. A linear Stern–Volmer plot is generally indicative of a single class of fluorophores, all equally accessible to the quencher. In many instances, the fluorophore can be quenched both by collision and by complex formation with the same quencher. In this case, the Stern–Volmer plot exhibits an upward curvature, concave towards the y-axis at high [Q], and F0/F is related to [Q] by the modified form of the Stern–Volmer equation:
| F0/F = (1 + KD[Q]) (1 + KS[Q]) |
where K
D and K
S are the dynamic and static quenching constants, respectively.
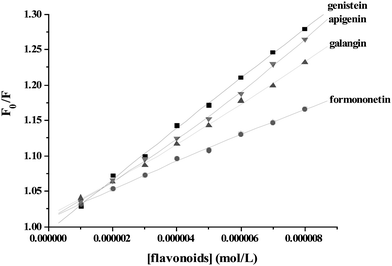 |
| | Fig. 3 The Stern–Volmer plots for γ-globulin fluorescence quenching by flavonoids at 300.15 K. | |
It was found that both dynamic and static quenching were involved for apigenin and galangin on γ-globulin fluorescence, which demonstrated by the fact that the Stern–Volmer plots slightly deviated from linearity toward the y-axis at higher flavonoid concentrations. In the linear range of Stern–Volmer regression curve, the average quenching constants (KSV) for formononetin, galangin, apigenin and genistein (having the lowest quenching effect, figure not shown) at 300.15 K were determined as 2.12, 2.52, 2.99 and 3.69 × 10⁴ mol−1, respectively.
The binding constants (Ka) and the number of binding sites (n)
The binding constants were calculated according to the double-logarithm equation:16–20| | | lg[(F0 − F)/F] = lgKa + nlg[Q] | (2) |
where F0 and F represent the fluorescence intensities of γ-globulin in the absence and in the presence of flavonoids, Ka is the binding constant, n is the number of binding sites per γ-globulin, and [Q] is the concentration of free flavonoids. Because the free concentration of drug is usually much higher than the bound concentration of drug, the double-logarithm equation used total flavonoid concentration instead of free concentration. Fig. 4 showed the typical double-logarithm curves of flavonoids quenching γ-globulin fluorescence at 300.15 K. Table 1 summarized the results and correspondingly calculated results according to eqn (2). The values of lgKa are proportional to the number of binding sites (n) (Fig. 5), which indicates that eqn (2) used here is suitable to study the interaction between flavonoids and γ-globulin. The magnitudes of apparent binding constants for γ-globulin were almost in the range of 103–105 M−1, which was similar to recent report for γ-globulin by Heet al.12 However, these data were much smaller than the affinities of flavonoids for BSA and HSA from our previous reports (104–108 M−1).16–19
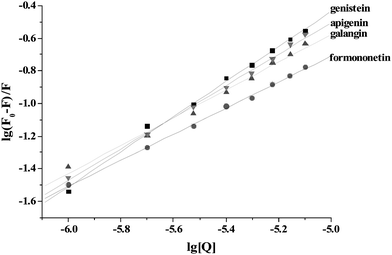 |
| | Fig. 4 Double-logarithm curves of flavonoids quenching γ-globulin fluorescence at 300.15 K. | |
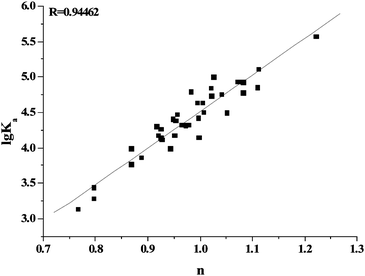 |
| | Fig. 5 The relationship between the affinities (lgKa) and the number of binding sites (n) between flavonoids and γ-globulin. | |
Structure-affinity relationship of flavonoids- γ-globulin interactions
As seen from Table 1, some of the structural information that affected the flavonoids-γ-globulin binding affinities is summarized as: (i) one or more hydroxyl groups in the rings A and B enhanced the binding affinity for γ-globulin. (ii) presence of an unsaturated 2,3-bond in conjugation with a 4-carbonyl group is associated with stronger affinity for γ-globulin;(iii) glycosylation affected the affinities for γ-globulin depending on the conjugation site and the class of sugar moiety; (iv) methylation of hydroxyl groups on flavonoids weakened the affinities for γ-globulin; (v) galloylated catechins exhibited higher binding affinities for γ-globulin than non-galloylated. We will analyze the structure-affinity relationship of flavonoids for γ-globulin in detailed in future.
Relationship of partition coefficient and the affinity for γ-globulin
The lipophilicity of the compounds under study was assessed by their partition coefficient values (XLogP3) according to PubChem Public Chemical Database.21 There is a relationship between the XlogP3 values and lgKa values for flavonoids (Fig. 6). The linear regression equation using the Origin 7.5 software was XlogP3 = 5.5864 − 0.8704lgKa (R = 0.2920). The affinities of flavonoids for γ-globulin decreased with increasing partition coefficient. From this point, the binding interaction between flavonoids and γ-globulin was not mainly caused by hydrophobic forces. These results also illustrated that the methylation of hydroxyl group in flavonoids weakened the binding affinities for γ-globulin. As shown in Table 1, the methylation of hydroxyl groups on flavonoids weakened the affinities for γ-globulin.
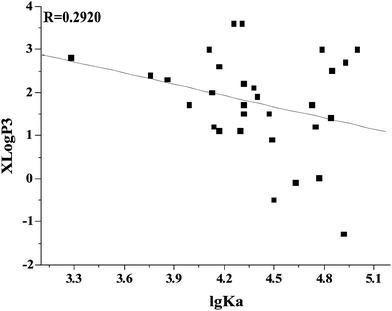 |
| | Fig. 6 Relationship of apparent binding constants (lgKa) with partition coefficient (XLogP3) of flavonoids. The partition coefficient values (XLogP3) were taken from PubChem Public Chemical Database.21 | |
To further investigate whether or not the hydrogen bond force plays an important role in binding flavonoids to γ-globulin, the relationships of the hydrogen bond acceptor/donor numbers (N, data were from ref. 21) of flavonoids with the affinities for γ-globulin were shown in Fig. 7. The affinities for γ-globulin obviously increased with increasing hydrogen bond acceptor numbers of flavonoids. These results illustrated that the hydrogen bond force is the main force to bind flavonoids to γ-globulin.
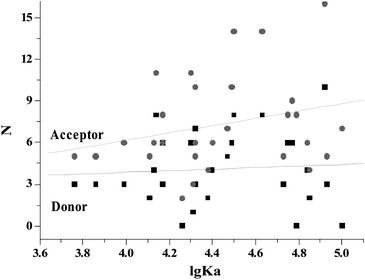 |
| | Fig. 7 Relationships of the hydrogen bond acceptor/donor number of flavonoids (N) with the affinities for γ-globulin. The hydrogen bond acceptor/donor numbers were taken from PubChem Public Chemical Database.21 | |
Relationship of topological polar surface area and the affinity for γ-globulin
The topological polar surface area (TPSA) is defined as the sum of surfaces of polar atoms in a molecule. TPSA has been shown to be a very good descriptor characterizing drug absorption, including intestinal absorption, bioavailability, Caco-2 permeability and blood-brain barrier penetration. The compounds with high TPSA are transported while those with low TPSA are not. A strong correlation between TPSA and transport properties (Km) was also found. In our present study, the relationship between TPSA and the binding affinity of flavonoids for γ-globulin was studied. The TPSA values were obtained from PubChem Public Chemical Database.21 It was found that there is no direct relationship between the TPSA values and lgKa values for flavonoids (Fig. 8). However, TPSA values were found to decrease with the increasing lgKa flavonoids for HSA.19
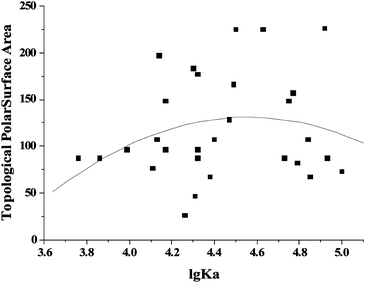 |
| | Fig. 8 Relationship of TPSA with the affinities of flavonoids for γ-globulin. The TPSA values were obtained online (http://www.molinspiration.com/cgi-bin/properties). | |
Acknowledgements
The authors are grateful for financial sponsored by Natural Science Foundation of Shanghai (10ZR1421700), “Chen Guang” project supported by Shanghai Municipal Education Commission and Shanghai Education Development Foundation (09CG46), National Transgenic Organism New Variety Culture Key Project (2009ZX08012-002B), National Natural Science Fund (30900110), Project from Ministry of Science and Technology of China (NC2010AE0075, NC2010AE0372), Leading Academic Discipline Project of Shanghai Municipal Education Commission (J50401), Innovation Program of Shanghai Municipal Education Commission (10YZ68), and Program of Shanghai Normal University (SK201006).
References
- D. Ghosh and A. Scheepens, Mol. Nutr. Food Res., 2009, 53, 322–331 CrossRef CAS.
- M. Rosenblat, N. Volkova, J. Attias, R. Mahamid and M. Aviram, Food Funct., 2010, 1, 99–109 RSC.
- M. Ueda, T. Furuyashiki, K. Yamada, Y. Aoki, I. Sakane, I. Fukuda, K. Yoshida and H. Ashida, Food Funct., 2010, 1, 167–173 RSC.
- M. R. Ahn, K. Kunimasa, S. Kumazawa, T. Nakayama, K. Kaji, Y. Uto, H. Hori, H. Nagasawa and T. Ohta, Mol. Nutr. Food Res., 2009, 53, 643–651 CrossRef CAS.
- N. Krafczyk, F. Woyand and M. A. Glomb, Mol. Nutr. Food Res., 2009, 53, 635–642 CrossRef CAS.
- M. H. Pan, C. S. Lai and C. T. Ho, Food Funct., 2010, 1, 15–31 RSC.
- W. Brand, B. Padilla, P. J. van Bladeren, G. Williamson and I. M. C. M. Rietjens, Mol. Nutr. Food Res., 2010, 54, 851–860 CrossRef CAS.
- N. Bando, N. Muraki, K. Murota, J. Terao and R. Yamanishi, Mol. Nutr. Food Res., 2010, 54, S261–S267 CrossRef CAS.
- M. Monagas, M. Urpi-Sarda, F. Sánchez-Patán, R. Llorach, I. Garrido, C. Gómez-Cordovés, C. Andres-Lacueva and B. Bartolomé, Food Funct., 2010, 1, 233–253 RSC.
-
I. Buxton, Pharmacokinetics and pharmacodynamics: the dynamics of drug absorption, distribution, action and elimination, in Goodman & Gilman's The Pharmacological Basis of Therapeutics ed. L. Brunton, pp 1–39, 2005, McGraw-Hill, Chicago Search PubMed.
- L. Ying, W. Chao and L. Guanghua, J. Mol. Struct., 2010, 980, 108–113 CrossRef CAS.
- J. B. Xiao, T. T. Chen, L. S. Chen, H. Cao, F. Yang and Y. L. Bai, J. Inorg. Biochem., 2010, 104, 1148–1155 CrossRef CAS.
- J. B. Xiao, L. S. Chen, F. Yang, C. X. Liu and Y. L. Bai, J. Hazard. Mater., 2010, 82, 696–703 CrossRef.
- W. He, Z. Hu, X. Yao and G. Chen, Aata Chim. Sin., 2010, 68, 679–688 Search PubMed.
- Y. Liu, W. He, W. Gao, Z. Hu and X. Chen, Int. J. Biol. Macromol., 2005, 37, 1–11 CrossRef CAS.
- J. B. Xiao, H. Cao, Y. F. Wang, K. Yamamoto and X. L. Wei, Mol. Nutr. Food Res., 2010, 54, S253–S260 CrossRef CAS.
- J. B. Xiao, M. Suzuki, X. Y. Jiang, X. Q. Chen, K. Yamamoto, F. L. Ren and M. Xu, J. Agric. Food Chem., 2008, 56, 2350–2356 CrossRef CAS.
- J. B. Xiao, H. Cao, Y. F. Wang, J. Y. Zhao and X. L. Wei, J. Agric. Food Chem., 2009, 57, 6642–6648 CrossRef CAS.
- J. B. Xiao, T. T. Chen, H. Cao, L. S. Chen and F. Yang, Mol. Nutr. Food Res., 2010 DOI:10.1002/mnfr.201000208.
-
J. R. Lakowicz, Principles of fluorescence spectroscopy, 2nd ed., Kluwer Academic/Plenum Publishers, New York, 1999 Search PubMed.
- PubChem Public Chemical Database. http://pubchem.ncbi.nlm.nih.gov/.
|
| This journal is © The Royal Society of Chemistry 2011 |
Click here to see how this site uses Cookies. View our privacy policy here. 