Toxicological assessment of TiO2 nanoparticles by recombinant Escherichia coli bacteria†
Guoxiang
Jiang
,
Zhenyao
Shen
*,
Junfeng
Niu
,
Yueping
Bao
,
Jing
Chen
and
Tiande
He
State Key Laboratory of Water Environment Simulation, School of Environment, Beijing Normal University, Beijing, 100875, P. R. China. E-mail: zyshen@bnu.edu.cn; Fax: +86-10-5880 0398; Tel: +86-10-5880 0398
First published on 3rd December 2010
Abstract
Rapid and efficient methods to assess nanoparticle toxicity are desired in current research. Here we showed that Escherichia coli labeled by green fluorescent protein can be a good model bacterium for assessing acute toxicity of TiO2 (about 50% inhibition ratios after 135 min exposure). Sodium dodecyl sulfate-polyacrylamide gel electrophoresis (SDS-PAGE) revealed that TiO2 nanoparticles (NPs) can influence certain protein expression in the recombinant bacterium, and the obvious effects in repressed expression and elevated expression were observed in 30/40, 10/20 μg mL−1 treated cells, respectively. However, the GFP expression (27 kD) was not influenced by introduced TiO2 NPs. The change of the fluorescence intensity may be caused by the damage in folding and chromophore formation of the GFP post-translational modification due to generated reactive oxygen species. Furthermore, TiO2 NPs at higher concentrations decreased their toxicity because of aggregation. 20 μg mL−1 humic acid (HA) introduced to the medium can decrease the fluorescent inhibition owing to the barrier of steric hindrance it provides between NPs and cells.
Environmental impactConcerns have been raised that the special properties of nanostructured TiO2 could potentially lead to unforeseen health or environmental hazards. However, existing methods for NP toxicity assessment are hampered in their widespread use for either online or in situ monitoring. In this study, we applied a strategy for constructing a plasmid-based green fluorescent proteinEscherichia coli bacterium, and assessed the toxicological effects of TiO2 NPs by the change of bacterial fluorescent intensity, and found the model bacterium can be a good choice for rapidly assessing acute toxicity of TiO2. Furthermore, humic acid (HA) as a major component of natural organic matter was introduced to assess the toxicological effect of nano-TiO2 when released into the natural environment. |
Introduction
TiO2 nanoparticles (NPs) have been widely used in paint, pollution treatment, self-cleaning glass, electric devices, food additives, pharmaceuticals, and cosmetic-products.1,2 Moreover, some studies have presented direct evidence of the release of synthetic oxide NPs from urban applications into the aquatic environment.2 Concerns have been raised that the special properties of nanostructured materials that make them so attractive could potentially lead to unforeseen health or environmental hazards.3Recently, acute and chronic toxicity of NPs were assessed by various cell lines including bacteria,4,5 aquatic organisms,6,7 mammalian cells8,9 and microbial communities.10,11 These studies demonstrated that NPs are not inherently benign and that they affect biological behaviors at the cellular, subcellular, and protein levels.4,5,9,12 The assessment of the environmental risks of NPs requires a rapid and efficient method to evaluate their potential toxic impact on the environment.
Live/dead and tissue damage methods were usually used to assess the toxicity of NPs.5,6,13–15 These methods made use of the cell damage and the change of microbial population caused by NPs to assess their toxicity. For example, the body length, number of eggs inside the worm body and offspring per individual of Caenorhabditis elegans were utilized to assess the dose-response toxicity of nano-scale TiO2.14 Likewise, other researchers applied DNA damage and oxidative stress caused by intracellular reactive oxygen species (ROS) produced by NPs to assess their cytotoxicity.5,13 However, the NP toxicity test required a large quantity of test compounds and a long incubation period, which hampers its widespread use for either online or in situ monitoring. Thus, methods for the rapid and efficient assessment of NP toxicity are desired.
Green fluorescent protein (GFP) was first isolated in the early 1970s for experimental use from coelenterates or the Pacific jellyfish, Aequorea victoria. Established as a biomarker, GFP has been employed in many applications, such as monitoring efficacy of bioremediation, monitoring transgenic plants, and management and manipulation of microbial consortia.16,17 The primary advantage of GFP is its autofluorescence, which excludes the need for the addition of cofactors or exogenous substrates to produce light.18 Additional advantages of GFP include high stability at biological pH, assay simplicity, and lack of endogenous homologues in most target organisms.19 GFP has been employed as a model system to investigate antimicrobial activities and intracellular protein production under NP stress.20,21 Gogoi et al. (2006) investigated the antibacterial properties of Ag NPs using GFP, and found the Ag NP treatment had no obvious effect on protein expression of recombinant bacteria.20 Most recently, the results from Wu et al. (2010) revealed that ZnO NPs in aquatic media tended to aggregate to micrometre-sized particles and could not interact with microorganisms effectively. They observed that intracellular protein GFP synthesis by Escherichia coli was minimally affected (10 ± 7%) when the concentration of ZnO NPs was raised to 60 mg L−1.21 However, so far, the toxicity mechanisms of NPs on protein expression of E. coli are still not well understood.
In this study, we applied a strategy for constructing a plasmid-based GFP E. coli bacterium, and assessed the toxicological effects of TiO2 NPs by the change of bacterial fluorescent intensity. The recombinant bacteria were able to detect nano-TiO2 cytotoxicity with high sensitivity. The purpose of this study was to develop an acute toxicological effect model to assess the toxicity of TiO2 NPs and elucidate the toxicity mechanisms of TiO2 NPs on the recombinant bacteria by detecting protein expression in cell lysates and ROS in the medium. This study would provide a significant implication in understanding the toxicity mechanism on model bacteria.
Materials and methods
Bacterial strain and chemicals
Competent E. colicells were purchased from Takara Co. (Takara, Dalian, China). Restriction endonucleases were purchased from New England Biolabs Inc. (Beverly, MA, U.S.). Primers were purchased from Invitrogen (Shanghai, China). Taq DNA polymerase, PCR buffer and dNTP were purchase from Takara, and pfu DNA polymerase was from Transgen Co. (Transgen, Beijing, China). Humic acid (HA) and high-purity molecular biology grade chemicals used for sodium dodecyl sulfate-polyacrylamide gel electrophoresis (SDS-PAGE) were from Sigma-Aldrich (St. Louis, Missouri, U.S.). Unless otherwise stated, all chemicals were analytical grade reagents. Luria-Bertani (LB) medium was used for cultivation and preservation of bacteria, and M9 medium was used for toxicity assessment. In this study, TiO2 NPs (anatase type, >99.99% purity, surface area 19.4 m2 g−1) were obtained from Beijing Beichen Chem. Co. (Beichen, Beijing, China).Preparation and characterization of NP suspensions
TiO2 NPs were dispersed in M9 medium (M9, a minimal bacterial medium with low background fluorescence, [12.8 g L−1 Na2HPO4·7H2O, 3 g L−1KH2PO4, 0.5 g L−1NaCl, 1.0 g L−1NH4Cl, 2 mL 1 M MgSO4, 20% sterile glucose 20 mL, 0.1 mL 1 M CaCl2, and add ddH2O to 1000 mL, pH = 7.0]) to make stock suspensions of 100 μg mL−1 and the stock solutions were stored in the dark no more than 2 days. The suspensions were placed in an ultra-sound water bath (200 W, 40 kHZ) for 30 min to break aggregates before diluting them to the exposure concentrations. The HA stock solution was prepared as follows. 5.0 mg of HA was dissolved in 100 mL of M9 medium and stirred for 24 h in the dark. In experiments, the test solution of TiO2 and HA were diluted to the target concentration.The characterization of NPs in the medium was measured by transmission electron microscope (TEM) and a laser diffusion technique. TEM images were collected following the method as previously described.14 One drop of the NP stock suspension was placed on a 400 mesh formvar coated grid and dried in a laminar flow hood. Analyses by TEM were performed using a JEOL 100CX TEM (JEOL, Japan) operated at 100 kV. TEM samples from aqueous medium blanks (no NPs added) were included as the control. The size distributions of the NP stock were determined by a laser diffusion technique (Mastersizer 2000, Malvern, U.S.) at room temperature, and 50 μg mL−1 was chosen as the test concentration so as to not exceed the limit of the laser diffusion technique. Considering the size distribution of NPs changed with time, the NP suspensions were kept standing for 10 min, and the experiment then performed by the laser diffusion technique. Furthermore, there is a significant difference in the NP size distribution with and without E. coli. Because the diameter of E. coli was about 1 μm, the size distribution of NPs in the presence of E. coli can be disrupted when performing the laser diffusion technique in the solutions.
Construction of GFP expression plasmids and toxicity assessment
The recombinant GFP expression E. coli (JM109) was generated by cloning the gfpgene fragment into a kanamycin-resistant pZ vector system. Forward primer was 5′-TAGAGATTGACATCCCTATCAGTGA-3′; reverse primer was 5′-GCCTTTGAGTGAGCTGATACCG-3′ for gfpgene fragment amplification. Polymerase chain reaction (PCR) was carried out in 50 μL, which contained 1 × reaction buffer, 0.2 mM of each deoxynucleoside triphosphate, 0.2 μM of each primer, and 1–2 unit Taq/pfu (9![[thin space (1/6-em)]](https://www.rsc.org/images/entities/char_2009.gif) :
:![[thin space (1/6-em)]](https://www.rsc.org/images/entities/char_2009.gif) 1) DNA polymerase mixture. The result clone was designated as pGFP-EN (see Fig. 1).
1) DNA polymerase mixture. The result clone was designated as pGFP-EN (see Fig. 1).
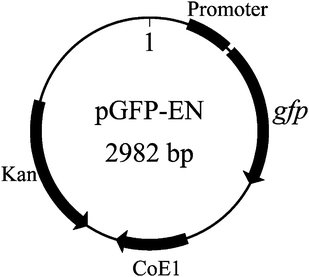 | ||
| Fig. 1 Expression vector pGFP-EN containing the gfpgene fragment. | ||
Bacteria were grown in LB medium with 100 μg mL−1 of kanamycin at 30 °C for 12–16 h with shaking, and harvested during mid-exponential growth phase. E. coli containing GFP plasmids were maintained on LB solid plates with resistance in 4 °C. Cells were washed twice and resuspended in M9 medium before exposure to NP suspensions. Background fluorescence was observed from both the media used and the bacterial cells themselves. The M9 medium had a lower background fluorescent intensity than LB medium. In order to detect GFP fluorescence, we determined that a cell density on the order of 1 × 10⁸cells mL−1 was necessary to exceed the background fluorescence. The optimal excitation spectrum of recombinant E. coli was selected at 488 nm, while emission wavelength occurs at 520 nm. The fluorescence excitation and emission scan spectra of NPs were measured in this study, and the results showed that nano-TiO2 under 520 nm emission wavelength did not display fluorescence when irradiated at 488 nm (see ESI†).
We used a 96-well microtiter plate spectrofluorimeter for measurements of GFP fluorescence to provide an efficient format for monitoring fluorescence produced in recombinant E. coli upon exposure to a range of NP concentrations. In the experiments, the toxicity of TiO2 NPs was expressed by bacterial fluorescent intensity change. The toxicity assessment method is as follows. E. coli were grown to mid-log phase for a better GFP expression on a shaker table at 30 °C with LB medium plus 100 μg mL−1kanamycin. Before use, E. coli cultures were centrifuged for 5 min at 6700 rpm, washed three times and resuspended in M9 medium. The resupended cultures were re-aliquoted into wells (200 μL per well) of a new 96-well plate and different concentration NP suspensions were added into 96-well plate for measurement of GFP fluorescence using a Tecan Infinite 200 reader (Tecan, Switzerland). An additional control experiment without NPs was performed and each experiment was performed at least in triplicate. The toxicity induced by the tested NPs was determined by the fluorescence intensity of E. coli when excited at 488 nm. The mixture of NPs and cultures was incubated at 30 °C to monitor the change of fluorescence intensity. The emission intensity at 520 nm was recorded in a spectrofluorimeter. The relative fluorescence intensity (FI) was expressed as percentage of (FIcontrol − FINPS)/FIcontrol. FIcontrol is the background fluorescent intensity when different concentrations of NPs were added, and FINPS is the fluorescent intensity of 96 well plates after incubation at 30 °C.
Furthermore, the toxicity of TiO2 nanoparticles on the recombinant E. coli was also determined by counting colony forming units (CFUs). The initial bacterial cell population was determined using its turbidity measured at 600 nm by a UV-visible spectrometer (Cary 50, Varian, USA). Cultures were diluted to achieve cell concentrations of approximately 103CFU mL−1. Different concentrations of nano-TiO2 were added to cultures, and the cultures were incubated at 37 °C. After 30 min, the mixtures were spread onto LB plates and left to grow at 37 °C in dark conditions overnight. A temperature of 30 °C was used in our experiments as it is the best choice for the protein expression of the recombinant GFP in E. coli for toxicological assessment of NPs by the change of bacterial fluorescence intensity. On the other hand, in the toxicological assessment experiments determined by counting colony forming units, the temperature 37 °C used in our experiments was suitable for the growth of the E. coli in solid plates. Thus, two different incubation temperatures (30 and 37 °C) were chosen in the present study. In these experiments, nanoparticle-free LB agar plates were used as a control. Colonies were counted and compared to control plates to calculate percentage growth inhibition. All treatments for each measurement were triplicated.
SDS-PAGE analysis
The recombinant bacteria were mixed with different concentrations of TiO2. E. coli without expression vector and NP-free were used as the control. The mixtures were grown on a shaker table at 30 °C with LB medium plus 100 μg mL−1kanamycin. E. coli cultures were centrifuged at 4 °C and 5000 rpm for 10 min, washed three times and then resuspended in ice-cold phosphate-buffered saline (PBS). After sonication treatment of 2 s with 5 s intermission pause for 10 times (VCX105, Sonics, U.S.) in an ice bath, the total protein concentration of supernatant was determined by UV-Vis (Cary50, Varian, U.S.) using the Bradford method. Whole cell lysate were prepared by incubating the samples in boiling water for 5 min after resuspending in Laemlli's buffer. 5 μL of supernatant was loaded per lane. SDS-PAGE was performed in 14% Tris-glycine using a miniProtean II apparatus (Bio-Rad, U.S.). Protein was stained with Coomassie Brilliant blue.Electron spin resonance (ESR) analysis
In order to monitor the generation of ROS, an ESR spin trap technique was conducted to investigate the reactive radicals generated by TiO2 NPs at room temperature. Herein, 5, 5-dimethyl-1-pyrroline-N-oxide (DMPO) was used as the spin trapping chemical. Because the O2˙− radical in the aqueous solution is very unstable and undergoes facile disproportionation other than the reaction with DMPO, the determination of O2˙− radical in these metal oxide NPs was examined in dimethyl sulfoxide (DMSO) solution. In order to compare the generation of ROS between radiation with light and without radiation, the generation of ROS from TiO2 NPs without radiation were also monitored in this experiment.Results and discussion
Characterization of TiO2 NPs
TEM images of nano-TiO2 in M9 medium at concentrations of 100 μg mL−1 are shown in Fig. 2. The actual particle diameter (20–40 nm), approximated by TEM analysis, agrees well with the diameter of the starting powders specified by the manufacturer (20 nm). But NP aggregates can be found from TEM images shown in Fig. 2. The sizes of TiO2 aggregates are more than 100 nm and even up to 1 μm. Furthermore, wide distributions of particle sizes in suspensions using the laser diffusion technique can be observed in Fig. 3, and actual range of aggregate sizes (under sonication) was 91–275 nm. Usually, the discrepancies in size are mainly due to aggregation of the particles in suspension and a certain amount of uncertainty in the manufacturing process. TiO2 NPs are prone to display different aggregation states in the experimental medium. Previous studies have shown that these NPs will also rapidly aggregate after several minutes or even several seconds, even if these NP suspensions have been sonicated and filtered.22,23 Although there were NP aggregates in experimental medium, the sizes of most aggregates were under 200 nm (about 75%) at the concentration of 50 μg mL−1.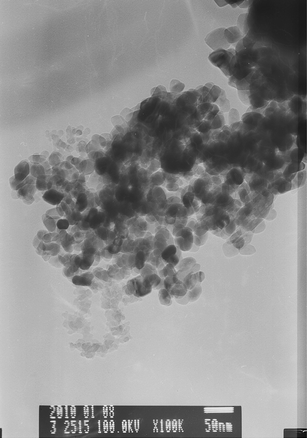 | ||
Fig. 2
TEM images (100![[thin space (1/6-em)]](https://www.rsc.org/images/entities/char_2009.gif) 000 magnification) of TiO2 NPs. 000 magnification) of TiO2 NPs. | ||
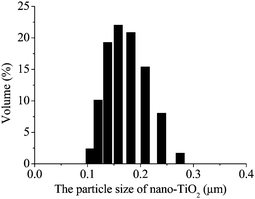 | ||
| Fig. 3 The size distribution of 50 μg mL−1TiO2 NPs in the medium by laser diffusion technique. Before determining the size distribution, the NP suspensions were kept standing for 10 min after sonication 30 min. | ||
Toxicological assessment of TiO2 NPs
As shown in Fig. 4 and Fig. 5, fluorescence-based cytotoxicity assays and CFU counting experiment confirm that TiO2 NPs are not inert. Nano-TiO2 decreased bacterial fluorescence and growth ratio compared to the control. A significant level of fluorescent intensity change was observed when the recombinant E. coli were exposed to different concentrations of nano-TiO2 for this study (see Fig. 4). As the NP concentration was increased from 5 to 50 μg mL−1, the fluorescent inhibition ratio during 60 min of exposure increased from 10% to 20%, respectively. The fluorescent inhibition ratio increased with the concentration of nano-TiO2. The results showed that 50 μg mL−1nano-TiO2 displayed the highest fluorescent inhibition ratio. However, after 135 min of exposure, although the fluorescent inhibition was enhanced for all concentrations of the NPs, the greatest difference was observed in 5/10 μg mL−1TiO2 NPs treated cells. Higher concentrations of NPs in the medium did not have an increased impact on the fluorescent inhibition when compared to the lower concentration. Herein, 50 μg mL−1nano-TiO2 resulted in a rather low fluorescent inhibition (only 38%), compared to lower concentration of nano-TiO2 (about 50% fluorescent inhibition). Nano-TiO2 with a smaller size and larger surface area can absorb cells. Moreover, the complex of the NPs and cells may rapidly aggregate to sedimentation with increasing exposure time. However, in our study, the total fluorescence intensity of samples in wells was not significantly changed in spite of cell sedimentation. A similar result can be also observed in Fig. 5, the greatest growth inhibition ratio was 23% when exposed at 20 μg mL−1, and antibacterial activities increased when exposed at 0–20 μg mL−1 NPs, while antibacterial activities deceased when the concentrations of nanoparticles were above 20 μg mL−1. The results showed that E. coli labeled by green fluorescent protein can be a good model bacterium for assessing acute toxicity of TiO2, and indicated that higher concentrations of nano-TiO2 displayed lower toxicity to E. coli with increasing exposure time. Previous studies have shown that these NPs will also rapidly aggregate.22,23 In this experiment, a lower toxicity at higher concentrations of nano-TiO2 may have resulted from the larger-sized NP aggregates formed which would not interact with E. coli effectively.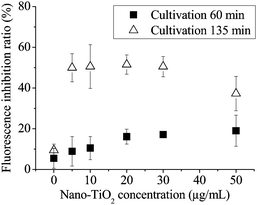 | ||
| Fig. 4 Fluorescent inhibition change of the recombinant E. coli exposed to different nano-TiO2 concentrations. Results are the mean of triplicate experiments. | ||
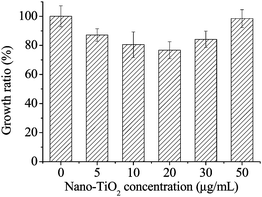 | ||
| Fig. 5 The antibacterial acitivities of nano-TiO2 assessed by E. coli on LB solid plates after inoculation 12 h in the dark at 37 °C. | ||
SDS-PAGE and ESR analysis
Protein expression in the recombinant E. coli exposed to different TiO2 concentrations was monitored by SDS-PAGE to assess the TiO2 NP toxicity in this study. The SDS-PAGE analyses of protein expression are shown in Fig. 6. It was found that no significant reduction in GFP protein (27 kD) was observed (Line 2) when E. coli was exposed to nano-TiO2. However, a significant reduction in protein (Line 1) was observed after 12 h of incubation, with the greatest effects observed in the recombinant E. coli treated with 30 or 40 μg mL−1nano-TiO2. This result is consistent with the fluorescent intensity change in toxicological assessment of nano-TiO2. A similar result was also observed by Gogoi et al. (2006), who found that low band intensities were mainly attributed to fewer bacteria when exposed to the high concentration of Ag NPs.20 However, in this study, band intensity did not always decrease when exposed to nano-TiO2. Contrarily, markedly increased band intensities were observed in the protein profiles (see rectangle in Fig. 6). Although a decrease was found when the concentration was greater than 40 μg mL−1, markedly increased band intensities can be observed when exposed to TiO2 NPs at the concentration of 10/20 μg mL−1. As shown in Fig. 6, a slight change of GFP expression was observed for SDS-PAGE. GFP polypeptides need to mature properly before emitting fluorescence. The maturation process involves two steps: folding and chromophore formation. First, the protein folds into a native conformation, and then, an internal tripeptide cyclizes and is oxidized.24 This process required only molecular oxygen for completion of the reaction. Therefore, the change of the fluorescence intensity may be caused by the damage in folding and chromophore formation of GFP in the recombinant E. coli.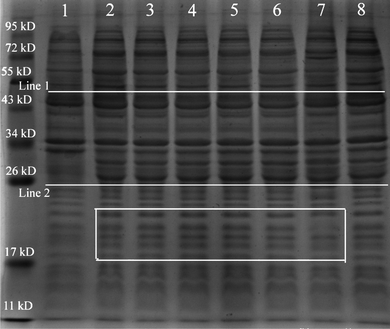 | ||
| Fig. 6 Influence of NPs on the protein expression in the recombinant E. coli by SDS-PAGE analysis. NPs-free and no vectors served as the control. | ||
Fig. 7 illustrates the ESR spectra of the DMPO-˙OH spin adduct and DMPO- O2˙− spin adduct at room temperature. Characteristic peaks of the DMPO-O2˙− and DMPO-˙OH adducts were found under 355 nm light irradiation while slight signals of ROS were also detected without direct light irradiation. Our findings agree with the results obtained from human cell lines showing TiO2-induced ROS generation in the absence of light.25 The generated ROS may damage cells by peroxidizing lipids, altering proteins, disrupting DNA, interfering with signaling functions, and modulating gene transcription.26 In addition, these active species would also consume extracellular or intracellular oxygen, decreasing the content of oxygen and resulting in hindrance of oxygen supply. All of these factors would interrupt the folding and chromophore formation of GFP. Furthermore, intracellular NPs with larger surface areas can easily disrupt the native conformation of proteins and thereby alter their function.27 Therefore, produced ROS from TiO2 NPs would severely influence expression and function of proteins in the recombinant bacteria.
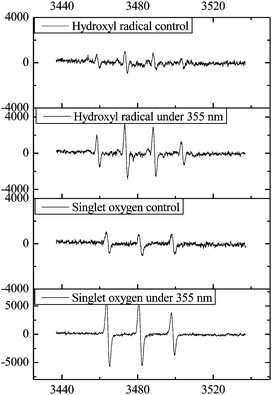 | ||
| Fig. 7 The nano-TiO2 ESR spectra of the DMPO-˙OH spin adduct and DMPO- O2˙− spin adduct at room temperature. | ||
Both repressed expression and elevated expression were observed after 12 h of incubation during our study to illustrate the protein expression in cells exposed to TiO2 NPs (see Fig. 5). The greatest effects in repressed expression were observed in the recombinant E. coli treated with 30 or 40 μg mL−1 NPs, while elevated expression was observed in 10/20 μg mL−1 treated cells. The results is similar to the observations by Jiang et al.28 who reported that repressed expression of key intracellular signaling proteins involved in cellular proliferation when human breast cancer SK-BR-3 cells were exposed to NPs. In particular, a decrease in the elevated expression protein was observed when bacteria were exposed to 30/40 μg mL−1TiO2 NPs. Thus, the repressed expression may derive from the post-translational modification28 and cell death due to damaged cell membranes. However, the elevated expression of certain proteins may be involved in protection mechanisms against the invasion of foreign NPs. Once the concentrations of TiO2 NPs exceeded the limit of protection mechanism, strongly repressed expression would occur.
Toxicity effect of aggregation
A higher concentration (50 μg mL−1) of TiO2 NPs did not result in a more significant repression in other protein expression in the recombinant E. coli during this study. The results of decreased toxicological effects may result from aggregation in the medium. Aggregation may play a significant role in decreased toxicity at higher concentrations of NPs.21 Previous studies suggested that soluble metal ions may affect cytotoxicity of metal oxide NPs as “Trojan-horse type carriers” to enabling the transport of metal ions into the cells to exaggerate nanotoxicity.6,13,29–31 However, Ti ions were not detected in this study due to low dissolution of nano-TiO2. Considering the fact that TiO2 NPs did not input Ti ions to the medium, the observed results suggests that the decreased toxicity at higher concentrations could be caused by NP aggregation. Higher concentrations of nano-TiO2 were prone to aggregation in the medium due to the large surface energy. In eqn (1), this increase in the hydrodynamic radius ah(t) is linearly dependent on the initial particle concentration N0.32 The size of these aggregated NPs can reach several hundred nanometres, and would be difficult to interact with bacteria correspondingly. Indeed, freshly prepared suspensions of NPs could be observed to change with time. Although these aggregated NPs would deposit quickly to decrease the toxicity, our study indicated that there were still individual NPs stabilized in the aqueous solutions. This increase in particle size provides an explanation for the inverse relationship between TiO2 NP toxicity and NP concentration. | (1) |
Additional experiments on both untreated and treated by HA in M9 medium confirmed that aggregation of higher concentration NPs contributed to the decrease of fluorescent intensity. Toxicological assessments of anatase-TiO2 on E. coli in the presence of HA were determined by the recombinant E. coli. The fluorescent inhibition results of E. coli exposed to different concentrations of anatase-TiO2 in the presence of 20 μg mL−1 HA are shown in Fig. 8. A significant decrease in fluorescent inhibition ratio in the presence of HA was observed for all tested concentrations. In our study, no toxicity was observed from HA at the experimental concentrations. Natural organic matter and surfactants, ubiquitous in natural water, are known to readily adsorb onto colloidal particles, altering their surface properties. According to eqn (1), higher concentrations bring about aggregation much more easily than lower concentrations. In lower concentration NP suspensions, the nanoparticles can disperse very well in spite of the introduction of HA, so the fluorescent intensity was not significant decreased. However, when increasing the NP concentration, NP aggregates were more prone to disperse with the introduction of HA, and the complex of NPs and HA provided the electrostatic repulsive force and steric hindrance between particle and bacteria. Thus a significant decrease can be observed in higher concentration tested samples. Similar to those reported previously,15 a significant decrease in fluorescent inhibition ratio in the presence of HA was also observed in this study. HA were considered to assist physical separation of the particles by maximizing the electrostatic repulsive force between charged particles, and by providing a barrier of steric hindrance between the particles and the bacteria.15
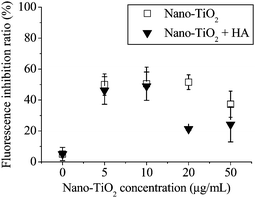 | ||
| Fig. 8 Fluorescent inhibition of E. coli exposed to different concentration anatase-TiO2 in presence of 20 μg mL−1 HA. Results are the mean of triplicate experiments. | ||
Toxicity mechanism of TiO2 NPs
Considering the fact that TiO2 NPs did not dissolve Ti ions into the medium, the observed results in this study suggested that the change of fluorescence intensity could be caused by ROS generated in both medium and intracellular cell, and cell membrane damage for size-dependent of NPs. On one hand, the nano-size of particles can result in efficient penetration into cells and subsequent physiological or chemical effect by cell internalization. NP-mediated cellular response is size-dependent.28 Particles with small diameters can penetrate more efficiently into cells than larger particles. Damage at various membranes and oxidative stress in intracellular cell caused by NPs were observed in many previous studies.8,9 Evidence also showed that smaller particles (<10 nm) may enter the cell directly to inhibit microbial growth.33 On the other hand, NPs with large surface areas and highly reactive catalytic sites can produce photocatalytic ROS in the presence of near-UV light. Even without UV light irradiation, TiO2 NPs of transition metal oxides were capable of generating ROS. The produced ROS (such as hydroxyl radical (˙OH), singlet oxygen (O2˙−) and so on) may be involved in damage to cells by peroxidizing lipids, altering protein folding, disrupting DNA, interfering with signaling functions, and modulating gene transcription.26 Furthermore, NPs with large surface areas can also interact with intracellular proteins or DNA and alter their function.For the model bacteria of plasmid-based GFP in our study, dispersed nanoparticles can efficiently penetrate into cells while larger sized TiO2 aggregates (about 200 nm) interact with difficulty with the recombinant bacteria (1 μm).8,33,34 HA introduced to the medium can decrease the toxicity effect on the bacteria by providing a barrier of steric hindrance between NPs and cells. Generated ROS in intracellular and extracellular medium can result in the change of fluorescent intensity. In particular, intracellular TiO2 NPs and produced ROS would influence protein expression and protein function in the recombinant bacteria by interrupting translation and post-translational modification.
Conclusion
A recombinant E. coli was constructed to assess the toxicological effects of TiO2 nanoparticles (NPs) by fluorescent intensity. SDS-PAGE showed a quantitative difference in the protein profiles of the control and treated samples, and the greatest effects in repressed expression and elevated expression were observed in 30/40, 10/20 μg mL−1 treated cells, respectively. The results indicate that TiO2 NPs can influence certain protein expression in cells. However, TiO2 NPs can not influence the plasmid-based GFP expression in the recombinant E. coli. The change of the fluorescence intensity may be caused by the damage in folding and chromophore formation of GFP post-translational modification due to generated reactive oxygen species. HA introduced to the medium can decrease the fluorescent inhibition by providing a barrier by steric hindrance between NPs and cells. These findings provide a significant contribution in understanding the toxicity of NPs with microbe in the aquatic environment.Acknowledgements
This work was supported by the National Basic Research Program of P.R. China (973 Program, 2010CB429003), National Natural Science Foundation of China (40701166) and Program for New Century Excellent Talents in University (NCET-08-0058).References
- R. van der Melen, H. Hurks, C. Out-Luiting, F. Spies, J. van't Noordende, H. Koerten and A. Mommaas, J. Photochem. Photobiol., B, 1998, 44, 143 CrossRef CAS.
- R. Kaegi, A. Ulrich, B. Sinnet, R. Vonbank, A. Wichser, S. Zuleeg, H. Simmler, S. Brunner, H. Vonmont, M. Burkhardt and M. Boller, Environ. Pollut., 2008, 156, 233–239 CrossRef CAS.
- A. D. Maynard, Nature, 2006, 444, 267–269 CrossRef CAS.
- R. Brayner, R. Ferrari-IIiou, N. Brivois, S. Djediat, M. F. Benedetti and F. Fievet, Nano Lett., 2006, 6(4), 866–870 CrossRef CAS.
- L. Brunet, D. Y. Lyon, E. M. Hotze, P. J. J. Alvarez and M. R. Wisener, Environ. Sci. Technol., 2009, 43(12), 4355–4360 CrossRef CAS.
- N. M. Franklin, N. J. Rogers, S. C. Apte, G. E. Batley, G. E. Gadd and P. S. Casey, Environ. Sci. Technol., 2007, 41(24), 8484–8490 CrossRef CAS.
- J. X. Wang, X. Z. Zhang, Y. S. Chen, M. Sommerfeld and Q. Hu, Chemosphere, 2008, 73, 1121–1128 CrossRef CAS.
- T. C. Long, N. Saleh, R. D. Tilton, G. V. Lowry and B. Veronesi, Environ. Sci. Technol., 2006, 40(14), 4346–4352 CrossRef CAS.
- J. M. Wrle-Knirsch, K. Kern, C. Schleh, C. Adelhelm, C. Feldmann and H. F. Krug, Environ. Sci. Technol., 2007, 41(1), 331–336 CrossRef.
- L. Nyberg, R. F. Turco and L. Nies, Environ. Sci. Technol., 2008, 42(6), 1938–1943 CrossRef CAS.
- Z. M. Xiu, Z. H. Jin, T. L. Li, S. Mahendra, G. V. Lowry and P. J. J. Alvarez, Bioresour. Technol., 2010, 101, 1141–1146 CrossRef CAS.
- A. Nel, T. Xia, L. Madler and N. Li, Science, 2006, 311, 622–627 CrossRef CAS.
- H. L. Karlsson, P. Cronholm, J. Gustafsson and L. Moller, Chem. Res. Toxicol., 2008, 21, 1726–1732 CrossRef CAS.
- H. H. Wang, R. L. Wick and B. S. Xing, Environ. Pollut., 2009, 157, 1171–1177 CrossRef CAS.
- Z. Q. Li, K. Greden, P. J. J. Alvarez, K. B. Gregory and G. V. Lowry, Environ. Sci. Technol., 2010, 44(9), 3462–3467 CrossRef CAS.
- C. B. Smith, J. E. Anderson, R. L. Fischer and S. R. Webb, Environ. Pollut., 2002, 120, 517–520 CAS.
- C. Stewart, Plant Cell Rep., 2002, 20(5), 376–382.
- L. H. Naylor, Biochem. Pharmacol., 1999, 58(5), 749–757 CrossRef CAS.
- K. V. Wood, Curr. Opin. Biotechnol., 1995, 6(1), 50–58 CrossRef CAS.
- S. K. Gogoi, P. Gopinath, A. Paul, A. Ramesh, S. S. Ghosh and A. Chattopadhyay, Langmuir, 2006, 22, 9322–9328 CrossRef CAS.
- B. Wu, Y. Wang, Y. H. Lee, A. Horst, Z. P. Wang, D. R. Chen, R. Sureshkumar and Y. J. Tang, Environ. Sci. Technol., 2010, 44, 1484–1489 CrossRef CAS.
- M. Baalousha, Sci. Total Environ., 2009, 407, 2093–2101 CrossRef CAS.
- R. A. French, A. R. Jacobson, B. Kim, S. L. Isley, R. L. Penn and P. C. Baveye, Environ. Sci. Technol., 2009, 43, 1354–1359 CrossRef CAS.
- T. Nagai, K. Ibata, E. S. Park, M. Kubota, K. Mikoshiba and A. Miyawaki, Nat. Biotechnol., 2002, 20, 87–90 CrossRef CAS.
- C. M. Sayes, R. Wahi, P. A. Kurian, Y. Liu, J. L. West, K. D. Ausman, D. B. Warheit and V. L. Colvin, Toxicol. Sci., 2006, 92(1), 174–185 CrossRef CAS.
- C. Buzea, I. I. Pacheco and K. Robbie, Biointerphases, 2007, 2(4), 17–71.
- L. Lynch and K. A. Dawson, Nano Today, 2008, 3, 40–47 CrossRef CAS.
- W. Jiang, B. Y. S. Kim, J. T. Rutka and W. C. W. Chan, Nat. Nanotechnol., 2008, 3, 145–150 CrossRef CAS.
- T. J. Brunner, P. Wick, P. Manser, P. Spohn, R. N. Grass, L. K. Limbach, A. Bruinink and W. J. Stark, Environ. Sci. Technol., 2006, 40, 4374–4381 CrossRef CAS.
- L. K. Limbach, P. Wick, P. Manser, R. N. Grass, A. Bruinink and W. J. Stark, Environ. Sci. Technol., 2007, 41, 4158–4163 CrossRef CAS.
- I. Binova, A. Ivask, M. Heinlaan, M. Mortimer and A. Kahru, Environ. Pollut., 2010, 158, 41–47 CrossRef.
- K. L. Chen and M. Elimelech, Langmuir, 2006, 22(26), 10994–11001 CrossRef CAS.
- O. K. Choi and Z. Q. Hu, Environ. Sci. Technol., 2008, 42(12), 4583–4588 CrossRef CAS.
- J. R. Morones, J. L. Elechiguerra, A. Camacho, K. Holt, J. B. Kouri, J. T. Ramirez and M. J. Yacaman, Nanotechnology, 2005, 16, 2346–2353 CrossRef CAS.
Footnote |
| † Electronic supplementary information (ESI) available. See DOI: 10.1039/c0em00499e |
| This journal is © The Royal Society of Chemistry 2011 |
