Activated organically doped silver: enhanced catalysis of methanol oxidation
Yair
Binyamin
a,
Gennady E.
Shter
a,
Vladimir
Gelman
a,
David
Avnir
*b and
Gideon S.
Grader
*a
aDepartment of Chemical Engineering, Technion - Israel Institute of Technology, Haifa, 32000, Israel. E-mail: grader@ce.technion.ac.il; Fax: +972-4- 8295099; Tel: +972-4-8292008
bInstitute of Chemistry, The Hebrew University of Jerusalem, Jerusalem 91904, Israel. E-mail: david@chem.ch.huji.ac.il; Fax: +972-2-6520099; Tel: +972-2-6585332
First published on 1st November 2011
Abstract
Detailed study of the synthesis parameters of silver doped with the organic dye Congo-red (CR@Ag) have led to an understanding of the origins of the superior performance of this novel-type methanol-oxidation catalyst (compared to pure silver) as demonstrated by the significant lowering of the temperature needed to reach maximal conversion by more than 100 °C. The origins of the effect of the organic dopant on the catalytic properties of silver are suggested and discussed in terms of its effects on morphology, on oxygen chemisorption properties, on the surface area, on the thermal behavior and on the sinterability of the silver aggregated crystallites. For instance, the organic dopant affects the surface area dramatically, increasing it from 600–3000 cm2 g−1 for undoped silver to 46![[thin space (1/6-em)]](https://www.rsc.org/images/entities/char_2009.gif) 000 cm2 g−1 for CR@Ag; and oxygen chemisorption, crucial for this catalytic process, increases from 32 cm2 g−1 for Ag to 893 cm2 g−1 for CR@Ag. Preliminary work with CR@copper provides a positive outlook for the general use of organic dopants to improve catalytic properties of other metals.
000 cm2 g−1 for CR@Ag; and oxygen chemisorption, crucial for this catalytic process, increases from 32 cm2 g−1 for Ag to 893 cm2 g−1 for CR@Ag. Preliminary work with CR@copper provides a positive outlook for the general use of organic dopants to improve catalytic properties of other metals.
Introduction
Recently, a new materials synthesis methodology that allows incorporation of different organic compounds into metals, has been developed.1–13 Some interesting and promising applications of these doped metals (dopant@metal) have already been demonstrated, including physical alteration of the metal properties (such as conductivity),8 new bioapplications of metals9 and, of relevance here, the opening of new directions in catalysis. The latter includes the use of metals as matrices for heterogenization of homogeneous catalysts (organic,3 inorganic,10 organometallic4 and enzymatic11) thus greatly enhancing the stability and performance of the entrapped catalysts, the chiral doping and imprinting of catalytic metals6,12 and the significant improvement of the catalytic activity of the metal itself.1,2 The synthetic process is based on several methods of reduction of the metal cation in the presence the compound to be entrapped. These include the use of water-soluble reducing agents,1 heterogeneous reducing agents (such as zinc4), the use of DMF as both solvent and reductant,7 and the use of electrochemical reductions.13 For instance, Congo-red@silver (CR@Ag), the topic of this report, is entrapped according to the reaction (eqn (1)):1,2| 2AgNO3(aq) + NaH2PO2(aq) + CR(aq) + H2O(l) → CR@(2Ag)(s) + NaH2PO3(aq) + 2HNO3(aq) | (1) |
The catalytic process of partial methanol oxidation to formaldehyde can be presented as (eqn (2)):5,22–30
 | (2) |
![[double bond, length as m-dash]](https://www.rsc.org/images/entities/char_e001.gif) O price is the fact that methanol represents ∼60% of the production costs.14 Thus, the dramatic increase of methanol prices in recent years, provides another incentive for careful optimization of the PMO process. In conclusion, any improvement of the PMO silver catalyzed process with emphasis on selectivity and conversion to CH2
O price is the fact that methanol represents ∼60% of the production costs.14 Thus, the dramatic increase of methanol prices in recent years, provides another incentive for careful optimization of the PMO process. In conclusion, any improvement of the PMO silver catalyzed process with emphasis on selectivity and conversion to CH2![[double bond, length as m-dash]](https://www.rsc.org/images/entities/char_e001.gif) O may have desirable effects on the production costs. As indicated above, dopants@metals in general, and CR@Ag in particular, have the potential to offer significant improvements of this important process.
O may have desirable effects on the production costs. As indicated above, dopants@metals in general, and CR@Ag in particular, have the potential to offer significant improvements of this important process.
Experimental details
Chemicals
Formaldehyde (A.G., Frutarom, Israel); Congo red (CR), NaH2PO2·0.2H20, methanol (Spectrophotometric grade), 1N AgNO3 (aq), all from Aldrich; Water – Mili-Q purified.Preparation of CR@Ag (silver doped with CR)
Following the procedure of ref. 1, a 125 ml solution of 90 ml 0.2M AgNO3(aq) (0.018 mol), 1.5 g sodium hypophosphite (0.018 mol) and 0.125 g CR (0.18 mmol) was stirred at RT for 4 days. The precipitated CR@Ag was filtered and washed with 100 ml of water, then dried for 1 day at RT under vacuum. Transparent filtrate with no traces of red color indicated 100% of entrapment. Parametrization of this procedure is described in the text below. Undoped silver was prepared by using the same procedure, without the presence of CR.Catalytic experimental setup
The experimental catalytic system was described in details earlier5and included the following main parts: (1) Two parallel flow-type stainless-steel tubular continuous reactors with inner quartz tubes. The investigated catalyst was placed in one reactor and the second reactor was filled only with quartz powder. (2) Heating of the reactors was carried out by vertical tube furnace. (3) Methanol feed system with dosing pump. (4) Air (oxygen) feed system with mass-flow controller. (5) On-line analytical system for emitted gases.The pre-treatment step includes heating of fresh catalyst in air at ca. 200 °C for 2 h followed by its heating at a rate of 5 °C min−1 to 500 °C in air, keeping this temperature for 0.5 h. After this activation step, the catalytic reaction was carried out at different temperatures, gradually decreasing from 500 to 200 °C, by employing the “methanol ballast process” version,30 in which only air and pure methanol are fed into the reactor without extra water in the reactant mixture. The following conditions were used: The catalyst mass (CR@Ag, Ag) was typically 1.5 g. The CH3OH volume concentration in the reaction mixture was kept constant at 0.5 gL−1. The total pressure in the reactors was held around 0.5 bar and temperature interval was in the range 150–500 °C. The methanol/air mixture space velocity (GHSV) was varied in the range 20![[thin space (1/6-em)]](https://www.rsc.org/images/entities/char_2009.gif) 000–75
000–75![[thin space (1/6-em)]](https://www.rsc.org/images/entities/char_2009.gif) 000 h−1. The space velocity is measured when a stable conversion value is reached at a selected temperature. On-line analysis of formaldehyde and methanol was performed by gas chromatography (Agilent Technologies) using a flame ionization detector (FID) and Wcot fused silica column (Varian) which was kept at 40 °C. Sampling through an automatic valve was performed each 5–10 min. We define % conversion to be equal to mol reacted CH3OH·100%/mol CH3OH in the feed; and % selectivity to be equal to mol formaldehyde·100%/(mol CH3OH in the feed - mol unreacted CH3OH). Conversion and selectivity determinations were carried out after 2 h of continuous process at each temperature to ensure that the operating conditions of the reaction are stationary.
000 h−1. The space velocity is measured when a stable conversion value is reached at a selected temperature. On-line analysis of formaldehyde and methanol was performed by gas chromatography (Agilent Technologies) using a flame ionization detector (FID) and Wcot fused silica column (Varian) which was kept at 40 °C. Sampling through an automatic valve was performed each 5–10 min. We define % conversion to be equal to mol reacted CH3OH·100%/mol CH3OH in the feed; and % selectivity to be equal to mol formaldehyde·100%/(mol CH3OH in the feed - mol unreacted CH3OH). Conversion and selectivity determinations were carried out after 2 h of continuous process at each temperature to ensure that the operating conditions of the reaction are stationary.
Analysis and characterization
Specific surface area (SSA) measurements were carried out with nitrogen on a MonosorbQuantachrom instrument (USA) and analyzed by the BET equation. For this measurement, the tested powders were dried after synthesis and degassed in flowing mix of He/N2 = 70%/30% at 110 °C for 3.5 h. Morphology of the catalysts was studied by HRSEM (LEO 982, UK). Particle size distribution in the HRSEM images was calculated with Image Tool 3.00 software. Oxygen chemisorption tests carried out with ASAP-2010 (Micromertics, USA).36 Simultaneous TGA (DTG) and DTA measurements were carried out on samples of 50–70 mg in alumina crucibles with a Setaram TGA-92 Thermobalance (France), at the range of 25–900 °C with a linear heating rate of 5 °C min−1 under flow of dry air of 30 cm3 min−1.Results
The effect of synthesis parameters on morphology, surface area and grain size
Since the morphology of the catalyst particles is a prime factor in dictating their catalytic activity, a careful study of the effects of various synthetic variables on this key parameter, was carried out. In particular, we have carried out a detailed investigation of the controlled feed rate of all the reagents in the liquid phase; of the reagents ratio; of the synthesis reaction time, and of the synthesis temperature. It was found that the synthesis time and temperature are the most important parameters that influence the morphology before and after the catalytic reaction, the sinterability of the metal particles, the specific surface area (SSA), the level of oxygen chemisorption, the thermal stability and, as a consequence, the catalytic activity.The effects of the organic entrapment and of the synthesis time on the silver powder morphology are shown in Fig. 1. From these HRSEM images it is clear that the grain size of CR@Ag (Fig. 1a,b,c) is significantly smaller than of Ag (Fig. 1d,e,f) for all synthesis times. The size of the CR@Ag grains is narrowly distributed in two ranges up to 0.2 μm where most are smaller than 0.15 μm. In contrast, the undoped silver grain sizes are distributed over a much wider range with the large grains having a diameter of 1 μm and larger. The presence of CR maintains the individual grains at a constant size and leads to a smaller aggregation as seen in Fig. 1a,b,c. The aggregation process is more pronounced in CR@Ag aged for 2 days and decreases for the 4 and 8 aging days specimens. It should be noted that the doped silver yields soft aggregates unlike the hard aggregates that are formed with the pure silver case.
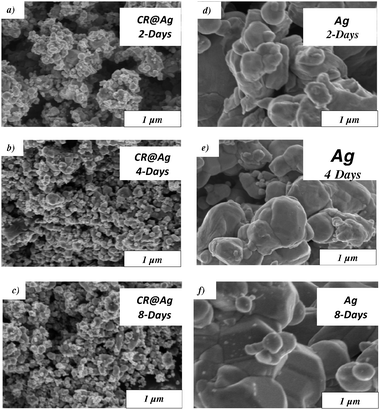 | ||
| Fig. 1 The effect of aging time during synthesis on the morphology of CR@Ag (a,b,c) and of Ag (d,e,f): (a,d) 2-days aging; (b,e) 4-days; (c,f) 8-days. | ||
The effect of aging on the SSA of CR@Ag and of Ag is presented in Table 1. The SSA values are well correlated with the morphology characteristics described above. Strong influence of the organic dopant on the SSA of synthesized powders was demonstrated by dramatic increase of the silver SSA from 600–3000 cm2 g−1 to ∼46![[thin space (1/6-em)]](https://www.rsc.org/images/entities/char_2009.gif) 000 cm2 g−1 for undoped and doped silver respectively. Based on the SSA values and assuming spherical grains one can estimate an average grain size of 120 nm and 2–10 μm for the doped and pure silver respectively. These results are consistent with the size obtained in HRSEM images in Fig. 1. The constant SSA values for the doped samples (∼46
000 cm2 g−1 for undoped and doped silver respectively. Based on the SSA values and assuming spherical grains one can estimate an average grain size of 120 nm and 2–10 μm for the doped and pure silver respectively. These results are consistent with the size obtained in HRSEM images in Fig. 1. The constant SSA values for the doped samples (∼46![[thin space (1/6-em)]](https://www.rsc.org/images/entities/char_2009.gif) 000 cm2 g−1, Table 1) also indicates that the individual grains in the doped samples are not growing as a result of aging, while those of Ag coalesce in time; the grain-growth inhibiting role of CR is thus clear.
000 cm2 g−1, Table 1) also indicates that the individual grains in the doped samples are not growing as a result of aging, while those of Ag coalesce in time; the grain-growth inhibiting role of CR is thus clear.
| Catalyst aging time | |||
|---|---|---|---|
| SSA before reaction | 2 days | 4 days | 8 days |
| CR@Ag | 45![[thin space (1/6-em)]](https://www.rsc.org/images/entities/char_2009.gif) 800 800 |
46![[thin space (1/6-em)]](https://www.rsc.org/images/entities/char_2009.gif) 000 000 |
45![[thin space (1/6-em)]](https://www.rsc.org/images/entities/char_2009.gif) 800 800 |
| Ag | 3000 | 1800 | 600 |
| SSA after reaction | 2 days | 4 days | 8 days |
| CR@Ag | 400 | 200 | 1000 |
| Ag | 800 | 500 | 400 |
The effect of synthesis time and synthesis temperature on oxygen chemisorption and on the catalytic activity
The conversion and selectivity of thermally activated CR@Ag and Ag in methanol oxidation were determined and compared at a GHSV of 25![[thin space (1/6-em)]](https://www.rsc.org/images/entities/char_2009.gif) 000 h−1. Two processing parameters were varied: synthesis time of the catalyst (see previous section) and the temperature of the catalytic reaction. The results, collected in Fig. 2 show that thermally activated doped silver provides higher conversion for all catalyst synthesis times, compared with pure Ag (Fig. 2a).
000 h−1. Two processing parameters were varied: synthesis time of the catalyst (see previous section) and the temperature of the catalytic reaction. The results, collected in Fig. 2 show that thermally activated doped silver provides higher conversion for all catalyst synthesis times, compared with pure Ag (Fig. 2a).
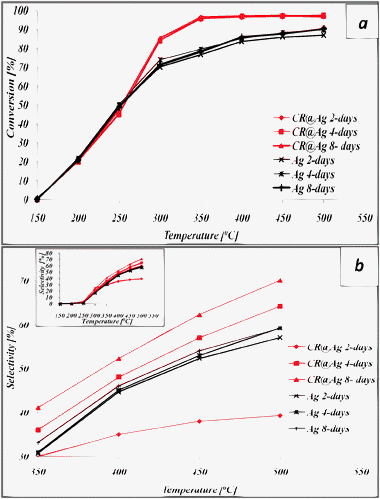 | ||
Fig. 2 The effect of the catalyst synthesis time on the catalytic activity at a GHSV of 25![[thin space (1/6-em)]](https://www.rsc.org/images/entities/char_2009.gif) 000 h−1 and at different PMO process temperatures: (a) Conversion; (b) Selectivity. 000 h−1 and at different PMO process temperatures: (a) Conversion; (b) Selectivity. | ||
Fig. 2a also shows that, in general, the conversion is not sensitive to the synthesis time. In contrast, the selectivity of formaldehyde formation in the doped catalyst is highly sensitive to the synthesis time (Fig. 2b). The best result was obtained for the 8-days synthesis time, which out-performs pure Ag. The origin of these trends becomes clear upon investigation of the catalyst morphology (Fig. 3) and upon considering the SSA values (Table 1) during and after its use in the oxidation process (500 °C). The HRSEM images (Fig. 1 and 3) reveal a significant increase in the catalyst grains size due to the oxidation process, but the doped grains are significantly smaller (2–4 μm) compared to the undoped ones (6–10 μm). In particular note that the morphology of the 8 days doped sample (Fig. 3c) is still open, and not sealed as the others. Indeed (Table 1) the SSA of CR@Ag is higher than Ag for the 8 days sample. Thus, the doping effect is most significant after 8-days synthesis.
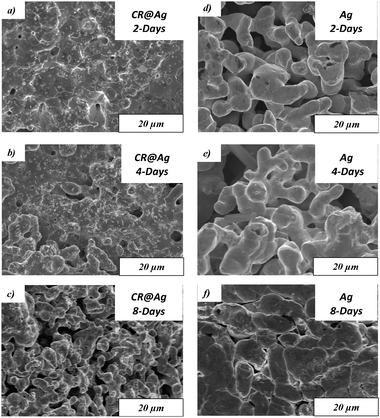 | ||
| Fig. 3 The morphology of CR@Ag (a,b,c) and of Ag (d,e,f) after the catalytic procedure: (a,d) 2-days catalyst synthesis time; (b,e) 4-days; (c,f) 8-days. | ||
Along with effect of synthesis time, the influence of elevating the synthesis temperature to 70 °C was investigated, in order to accelerate the synthesis time of 8 days. The results below present comparison of the properties of the doped catalyst synthesized at RT with those at 70 °C for 2 days synthesis time. The effect of temperature on morphology is shown in Fig. 4. The catalyst synthesized at 70 °C has considerably larger grains compared with those prepared at RT (Fig. 4a and b), displaying a bimodal size distribution of large particles in the 0.5–0.8 μm range and of smaller ones in a narrow 0.1–0.2 μm range. Image analysis indicates that the volume fraction of the large grains developed at 70 °C is much larger than the smaller grains (large/small = ∼3/1). The effect of synthesis temperature on the doped powder morphology after the PMO process is presented in Fig. 4c and d. The grain size is significantly smaller—2 μm—in the catalyst synthesized at 70 °C compared to that of the RT samples (up to 8 μm). The effect of synthesis temperature on the CR@Ag powder morphology was also investigated by SSA nitrogen-adsorption measurements and by O2 chemisorption; the results are presented in Table 2. It is seen that the warmer synthesis temperature increases the powders SSA by a factor of ∼2 before the PMO process and drastically by a factor of ∼40 after it.
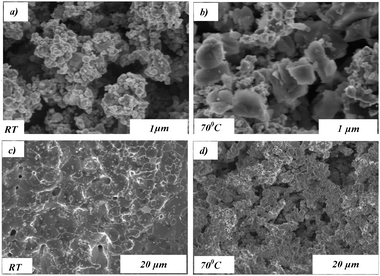 | ||
| Fig. 4 The morphology of CR@Ag (CR:Ag = 0.04 by wt.) synthesized: at RT(a,c) and at 70 °C (b,d); (a,b) before the catalytic process; (c,d) after catalysis. | ||
| Measured properties | Samples | Synthesis at RT | Synthesis at 70 °C |
|---|---|---|---|
| SSA [cm2 g−1] | Before catalytic reaction | 49![[thin space (1/6-em)]](https://www.rsc.org/images/entities/char_2009.gif) 000 000 |
90![[thin space (1/6-em)]](https://www.rsc.org/images/entities/char_2009.gif) 500 500 |
| After catalytic reaction | 200 | 7800 | |
| O2 Chemisorption [cm2 g−1 Ag] | Before catalytic reaction | 135 | 5060 |
| After catalytic reaction | 51 | 140 | |
The catalytic activity in the oxidation processes is strongly influenced by oxygen chemisorption on the catalyst active sites. It was therefore important to notice that the synthesis temperature radically affected the O2 chemisorption, increasing it by a factor of 40 before the catalytic PMO process and by a factor of 3 after it (Table 2). Fig. 5 presents the dramatic effect of synthesis time on the oxygen chemisorption on CR@Ag surface after synthesis (Fig. 5). The amount of oxygen adsorbed on the fresh catalyst of the 8-days synthesis time is higher by one and two orders of magnitude in comparison with 4 and 2-days synthesis time, respectively. The effect of synthesis time remained significant also after the catalyst activation at 500 °C, for which the 8-days doped silver had the highest quantity of absorbed O2 - 549 cm2 g−1 compared with 171 cm2 g−1 for 2-days one (Fig. 5). This phenomenon is also observed after completion of the catalytic process where O2 adsorption values of 84 and 51 cm2/gr were found for 8-days vs. 2-days catalyst preparation time, respectively. The advantageous effect of doping on oxygen chemisorption was also clearly seen by comparing the data of 4-days synthesis of pure silver and doped silver: (a) 32 cm2 g−1 for Ag vs. 893 cm2 g−1 for fresh CR@Ag and, (b) 19 cm2 g−1 for Ag vs. 77 cm2 g−1 for CR@Ag after the PMO process.
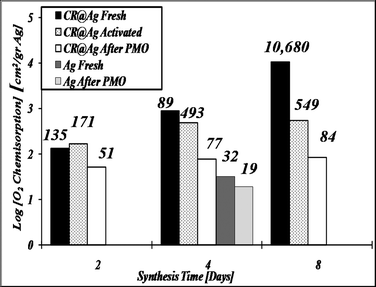 | ||
| Fig. 5 O2 chemisorption on CR@Ag, for the fresh catalysts, for the thermally activated catalyst and for catalysts after the PMO process. | ||
Thus, a strong positive effect of synthesis time on the catalyst O2-chemisorption capacity is shown for doped silver catalyst before and after the catalytic process, as well as after activation at the high process temperature. Finally, note that the results of oxygen chemisorption on silver are well correlated with the SSA values and with the catalytic performance (Fig. 2b, Table 1), where the increase in the O2 content on the active surface resulted in promotion of catalytic properties.
The effect of synthesis temperature on catalytic activity was investigated and the results are presented in Fig. 6. It is seen there that while the temperature changes do not affect the conversion, the selectivity is strongly affected, increasing from 40% to 70% at 500 °C. We propose an explanation for this observation in the Discussion section.
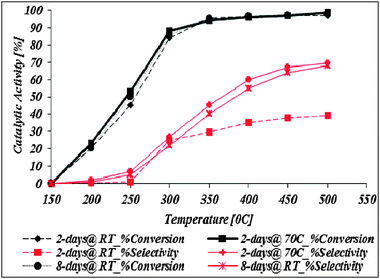 | ||
| Fig. 6 Catalytic activity vs. temperature for CR@Ag synthesized at RT (for 2 and 8 days) and 70 °C water bath (for 2 days). | ||
Thermal oxidative behaviour
The thermal oxidative decomposition (TOD) of the entrapped CR turned out to be an important analytical tool in understanding the catalytic behavior of CR@Ag, because, as has been observed in an earlier study,5 the metal drastically affects the oxidation process; we therefore describe it in some detail. Thermal gravimetric analysis and differential thermal analysis (TGA/DTA) data was collected for doped samples aged for 2, 4 and 8 days during synthesis (Fig. 7; the weight loss curves are normalized to 0 at 150 °C, at which point the physically adsorbed water is removed). In general, the CR@Ag TOD process can be divided into three main stages: (a) Low temperature weakly exothermic oxidative decomposition in the range of 240–290 °C and weight loss of 0.8–0.9% wt; (b) relative stability up to 365 °C where a negligible weight loss is observed; and (c) an intensive exothermic TOD step which starts at approximately 370 °C and continues up to ∼550 °C, accompanied with a major weight loss of 5–7% wt.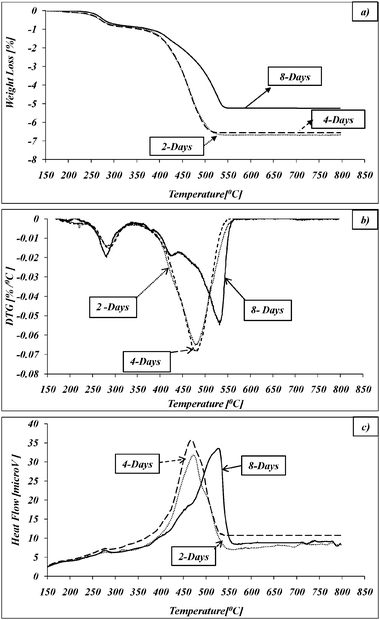 | ||
| Fig. 7 Thermal oxidative degradation of CR@Ag with different synthesis time: (a) TGA; (b) DTG; (c) DTA. | ||
The effect of synthesis time on the TOD is clearly noticeable between 370–∼550 °C (Fig. 7). The DTG curves for the 8-days aging sample shows four well defined steps of degradation in the range of 370–∼550 °C (Fig. 7b). On the other hand only one degradation step is observed for 2 and 4-days samples (which are virtually identical). The rate of oxidation degradation is sharply decreased for the 8-days sample in comparison with 2 and 4-days samples. In addition, the main part of TOD was shifted to higher temperatures by about 50 °C, although the beginning of this process was identical for all samples, namely at 370 °C. Significant decrease in weight loss was also determined for the 8-day sample compared to other ones: 5.3% vs. 6.8% wt. These observations indicate a higher thermal stability of the organic dopant in the 8-days samples indicating stronger entrapment within the silver. During the 8-days synthesis the CR molecules penetrate deeper into the silver aggregates and are mainly placed in the interstitial pores between the Ag particles, thus leading to slower oxidation representing slower oxygen diffusion to the reaction zone. Therefore we observe the same starting temperatures of the TOD steps, but the TOD end point temperatures increased depending on the CR position within the silver.
The TGA/DTG/DTA curves for doped catalyst synthesized at elevated temperature and at RT are presented in Fig. 8. The doped catalysts synthesized at different temperatures exhibit different thermal behaviour above 350 °C. A drastic decrease in weight loss from 6.7 to 4.5% wt. was found for the sample synthesized at 70 °C in comparison with one prepared at RT (Fig. 8a). Above 350 °C the DTA and DTG curves represent a gradual TOD of the sample synthesized at 70 °C, where at least three stages were detected: 350–440 °C; 440–500 °C; and 500–550 °C. In the RT samples the TOD indicates only one stage (Fig. 8b and c), with a higher TOD rate compared to the multistage TOD of the 70 °C sample. This pattern indicates a different distribution of the CR within the Ag in 70 °C vs. RT samples for 2 days. This plentiful of observations contribute to the understanding of the mechanism suggested in the next section.
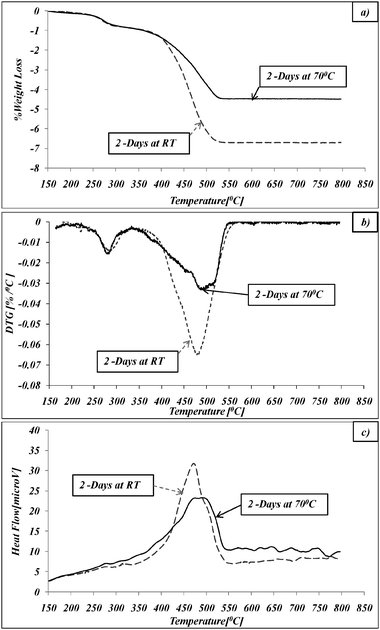 | ||
| Fig. 8 Thermal oxidative degradation of CR@Ag synthesized at RT and 70 °C: (a) TGA; (b) DTG; (c) DTA. | ||
Discussion
Three main questions need to be addressed in order to explain the results: (a) Why are the CR@Ag particles smaller and less aggregated as compared to the pure Ag particles? (b) Why does doped silver exhibit enhanced catalytic activity in the PMO process? (c) In what way do the synthesis time and temperature influence the doped silver morphology and its catalytic activity? We suggest the following possible answers to these questions:(a) We suggest that the organic dopant molecules interfere with the growth of large particles and prevent the formation of large hard aggregates (Fig. 1 and 9). Therefore CR@Ag differs from Ag in having smaller particles, less aggregated structures, lower bulk density, higher porosity and higher SSA (Fig. 1; Table 1).
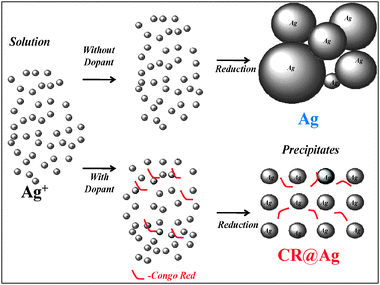 | ||
| Fig. 9 Schematic model of dopant effect on silver morphology (Dopant-CR). | ||
(b) The answer to the second question begins by noticing the significant increase in grains size of powders after the PMO process (Fig. 3), which is the result of solid state sintering (SSS) occurring during the catalytic procedure at ∼500 °C. We suggest that at this temperature the organic dopant undergoes thermal oxidative degradation5 into carbonaceous residues, located between the grains (seen as black zones between grains in Fig. 10). When the CR molecules are mainly placed on the outer surface of silver crystallites they do not prevent the sintering of the particles, thus inhibiting the catalytic activity. In addition they serve as barrier to chemisorption of reagent molecules on the active centres of the silver agglomerates. As a result, large sintered aggregates were formed (Fig. 3a), SSA decreased (Table 1) and the catalytic activity is lowered (Fig. 2b). In contrast, when CR residues are mainly located within the silver agglomerates (8 days aging), they serve as an efficient barrier for the silver sintering process. In this case, smaller catalyst particles were found in comparison with pure silver (Fig. 3), and a more porous morphology and higher SSA were observed (Table 1). The reduced sintering gives rise to an increase number of active catalytic centers that are located at the silver grain boundaries.5 As a result, an enhanced catalytic activity of doped silver in comparison with pure silver is achieved (Fig. 2).
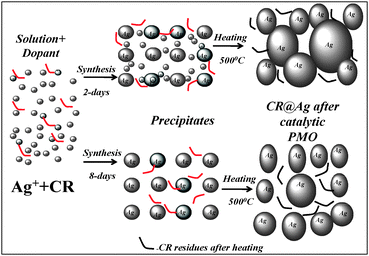 | ||
| Fig. 10 Schematic model on the effect of synthesis time on the catalyst morphology before and after the activation at 500 °C. | ||
(c) The effect of synthesis time shows up in the fact that in spite of full entrapment during 2 days of synthesis its catalytic activity is significantly lower than that of the catalyst formed after 8-days (Fig. 2).What process is taking place over the 6 extra days that might give rise to the improved activity? At the early stages of the synthesis there are numerous small Ag crystallites in the internal spaces of the aggregates that prevent the uniform penetration of CR molecules into Ag aggregates. As result, the main part of CR located at the periphery of the silver globules (Fig. 10). The sintering process of the small Ag particles is intense at 500 °C, resulting in rapid particle growth (Fig. 3a). The sintered catalyst has low SSA (Table 1) and, in addition, part of the developed pores and grain boundaries are blocked by the carbon residue of the organic components. This negative effect explains the significant decrease in selectivity of doped catalysts prepared in 2 days (Fig. 2b). On the other hand, when the synthesis spans over 8 days, the fraction of very small Ag particles is significantly decreased. As a result, the penetration of CR into the silver aggregates is not blocked and the CR distribution is more uniform (Fig. 10). These changes are expected to positively affect the catalytic activity and give rise to the significant selectivity increase of that 8-days catalyst (Fig. 2b). Finally, as shown above, the long synthesis times at RT can be avoided by raising the synthesis temperature. Our synthesis at 70 °C for 2 days gave equivalent catalytic activity to the samples prepared at RT in 8 days.
Conclusions and outlook
In summary, a new concept in metal catalysis has been shown: doping of the catalytic metal with an organic dopant. An understanding of the entrapment mechanism and the effects of synthesis parameters on the final material properties are crucial for optimizing the performance of organic@metal. We have provided here an in-depth study of the silver case and the question arises if it can be implemented with other dopants and with other catalytic metals. Other dopants have been indeed tested (such as thionin), but their performance was found to be inferior to CR. We are not ready yet to answer the question of what is special in the structure of that dopant as a catalyst promoter. As for other metals, preliminary results of doping Cu with CR indeed provide a positive outlook: A drastic increase in SSA was observed—from 36![[thin space (1/6-em)]](https://www.rsc.org/images/entities/char_2009.gif) 600 cm2 g−1 for pure Cu to 256
600 cm2 g−1 for pure Cu to 256![[thin space (1/6-em)]](https://www.rsc.org/images/entities/char_2009.gif) 000 cm2 g−1 for CR@Cu synthesized under the same conditions—and indeed, the catalytic activity in methanol oxidation over CR@Cu revealed ∼30% increase in conversion. This, however was accompanied by a∼25% decrease in selectivity; work in this direction is in progress.
000 cm2 g−1 for CR@Cu synthesized under the same conditions—and indeed, the catalytic activity in methanol oxidation over CR@Cu revealed ∼30% increase in conversion. This, however was accompanied by a∼25% decrease in selectivity; work in this direction is in progress.
Acknowledgements
Supported by the Israel Science Foundation (Grant #494/05), by a Tashtiot Infrastructure grant of the Israel Ministry of Science (Grant 3-6474),and by joint grant from the Committee for Planning and Budgeting of the Council for Higher Education and by the Center for Absorption in Science (Israel) under the KAMEA program.References
- H. Behar–Levy and D. Avnir, Chem. Mater., 2002, 14, 1736 CrossRef.
- H. Behar–Levy, G. E. Shter, G. S. Grader and D. Avnir, Chem. Mater., 2004, 16, 3197 CrossRef.
- H. Behar-Levy and D. Avnir, Adv. Funct. Mater., 2005, 15, 1141 CrossRef CAS.
- I. Yosef and D. Avnir, Chem. Mater., 2006, 18, 5890 CrossRef CAS.
- G. E. Shter, H. Behar-Levy, V. Gelman, G. S. Grader and D. Avnir, Adv. Funct. Mater., 2007, 17, 913 CrossRef CAS.
- H. Behar-Levy, O. Neumann, R. Naaman and D. Avnir, Adv. Mater., 2007, 19, 1207 CrossRef CAS.
- G. Nesher, G. Marom and D. Avnir, Chem. Mater., 2008, 20, 4425 CrossRef CAS.
- G. Nesher, M. Aylien, G. Sandaki, D. Avnir and G. Marom, Adv. Funct. Mater., 2009, 19, 1293 CrossRef CAS.
- R. Ben-Knaz, R. Pedahzur and D. Avnir, Adv. Funct. Mater., 2010, 20, 2324 CrossRef CAS.
- S. Krackl, A. Company, Y. Aksu and D. Avnirand M. Driess, ChemCatChem, 2011, 3, 227 CrossRef CAS.
- R. Ben-Knaz and D. Avnir, Biomaterials, 2009, 30, 1263 CrossRef CAS.
- L. D. Pachon, I. Yosef, T. Markus, R. Naaman, D. Avnir and G. Rothenberg, Nat. Chem., 2009, 1, 160 CrossRef.
- O. Sinai and D. Avnir, Chem. Mater., 2011 Search PubMed , in press.
- Geoffrey I. N. Waterhouse, Graham A. Bowmaker and James B. Metson, Appl. Catal., A, 2004, 266, 257 CrossRef CAS.
- M. V. Twigg, Catalyst Handbook, Manson, London, 2nd edn, 1996 Search PubMed.
- H. F. Rase, Handbook of Commercial Catalysts, CRC Press, Boca Raton, FL, 2000 Search PubMed.
- Charles L. Thomas, Catalytic Processes and Proven Catalysts, Academic, New York, 1970 Search PubMed.
- J. Tsuji, Transition Metal Reagents and Catalysts, Wiley, New York, 2000 Search PubMed.
- V. F. Kiselev and O. V. Krylov, Adsorption and Catalysis on Transition Metals and Their Oxides, Springer, New York, 1989 Search PubMed.
- L. Brandsma, S. F. Vasilevsky and J. D. Verkruijsse, Application of Transition Metal Catalysts in Organic Synthesis, Springer, New York, 1998 Search PubMed.
- D. Avnir, Handbook of Heterogeneous Catalysis, ed. G. Ertl, H. Knozinger and J. Weitkamp, Wiley-VCH, Weinheim, 1997, vol. 2, ch. 3.1.6 Search PubMed.
- T. Mallat and A. Baiker, Chem. Rev., 2004, 104, 3037 CrossRef CAS.
- A. Nagy and G. Mestl, Appl. Catal., A, 1999, 188, 337 CrossRef CAS.
- J. K. Walker, Formaldehyde, Reinhold, New York, 3rd edn, 1964 Search PubMed.
- B. A. J. Fisher, Formaldehyde, Encyclopedia of Chemical Technology, Wiley, New York, 4th edn, 1992, vol. 11, p. 929 Search PubMed.
- A. Nagy, G. Mestl, T. Ruhle, G. Weinberg and R. Schlogl, J. Catal., 1998, 179, 548 CrossRef CAS.
- G. J. Millar, M. L. Nelson and P. J. R. Uwins, Catal. Lett., 1997, 43, 97 CrossRef CAS.
- W.-L. Dai, J.-L. Li, Y. Cao, Q. Liu and J.-Fa. Deng, Catal. Lett., 2000, 64, 37 CrossRef CAS.
- A. N. Petryakov and V. V. Lunin, J. Mol. Catal. A: Chem., 2000, 158, 325 CrossRef.
- M. Vo, D. Borgman and G. Welder, Surf. Sci., 2000, 465, 211 CrossRef.
- M. Qian, M. A. Liauw and G. Emig, Appl. Catal., A, 2003, 238, 211 CrossRef CAS.
- A. N. Petryakov, V. V. Lunin and A. N. Devochkin, et al. , Appl. Catal. A: General, 2002, 227, 126 Search PubMed.
- W.-L. Dai, Y. Cao, L.-P. Ren, X.-L. Yang, J.-H. Xu, H.-X. Li, H.-Y. He and K.-N. Fan, J. Catal., 2004, 228, 80 CrossRef CAS.
- G. Reuss, W. Disteldorf, O. Grundler and A. Hilt, “Formaldehyde” in Ullmann's Encyclopedia of Industrial Chemistry, VCH, Weinheim, 5th edn, 1988, vol. A11, p. 619 Search PubMed.
- H. R. Gerberich and G. C. Seaman, “Formaldehyde” in Kirk-Othmer Encyclopedia of Chemical Technology, Wiley, New York, 4th edn, 1994, vol. 11, p. 92 Search PubMed.
- P. A. Webb, C. ORR. Analytical Methods in Fine Particle Technology, Micromeritics, USA, 1997 Search PubMed.
| This journal is © The Royal Society of Chemistry 2011 |
