Structure sensitivity of the Fischer–Tropsch reaction; molecular kinetics simulations
Rutger A.
van Santen
*a,
Mohammed Minhaj
Ghouri
b,
Sharan
Shetty
b and
Emiel M. H.
Hensen
b
aSchuit Institute of Catalysis and Institute for Complex Molecular Systems, Eindhoven University of Technology, P. O. Box 513, Eindhoven 5600MB, The Netherlands. E-mail: r.a.v.santen@tue.nl; Fax: +31 40 245 5054; Tel: +31 40 247 3082
bSchuit Institute of Catalysis, Eindhoven University of Technology, P. O. Box 513, Eindhoven 5600MB, The Netherlands
First published on 25th July 2011
Abstract
Strong interest in the Fischer–Tropsch reaction that converts synthesis gas into hydrocarbons is reappearing because it is basic to one of the major routes that convert natural gas into liquid energy carriers. For catalytic science it provides amongst others an opportunity to revisit still open mechanistic issues of the Fischer–Tropsch conversion reaction. New approaches as computational advances and development of model systems are tools that may provide new insights. In this paper we will review our current understanding of the kinetics and its relation to catalyst structural parameters that determine the selectivity of the reaction. In the introductory section we formulate the key questions that we will address. Especially we will discuss the reason for particle size dependence of metallic catalysts as Co and Ru when particles are in the nanosize range and also the apparent paradox that step–edge sites are necessary for the chain growth reaction, where the CO molecule has to dissociate but that such sites should not be poisoned by the presence of the growing hydrocarbon chains or deactivating carbonaceous residue. One of the main selectivity issues of this reaction is the desire to produce long chain hydrocarbon molecules, without co-production of light gas molecules as methane. We will begin the presentation with the elementary kinetic expressions that enable calculation of the selectivity from a microkinetics reaction scheme. This will highlight that the rate of chain growth termination has to be one of the slow reaction steps and also that CO dissociation has to be fast. Since the past decade has seen major advances in the understanding of the structure sensitivity of transition metal catalysed surface reactions, the kinetic analysis helps to understand how structure sensitivity affects Fischer–Tropsch selectivity. Quantum chemical computational studies now can be used to analyse reaction paths and estimate reaction intermediate adsorption energies. Also activation free energies can be deduced for elementary surface reactions. We will illustrate this by discussing a so-called dual site model of the reactive catalyst center. On this reaction center we will discuss in detail CO dissociation and initiation of the chain growth reaction. It appears that synchronized subsequent reaction events involving reaction intermediate diffusion to different positions at the reaction center leads to accommodation of hydrocarbon chain growth while CO dissociation is not suppressed. Ultimately the mechanistic model deduced from the quantum-chemical studies will have to be used in kinetic equations to predict overall catalytic conversion rates. We will demonstrate how this can be done in a Kinetic Monte Carlo scheme, in which no assumption on the rate limiting step has to be made. We will present the results of some initial simulations where we allow for growth of short hydrocarbon chains. These results can be used in an insightful way using the kinetic model equations presented earlier in the paper. The paper is concluded by discussing the implications of these model results for our general mechanistic understanding of the Fischer–Tropsch reaction.
1. Introduction
The Fischer–Tropsch reaction catalytically converts synthesis gas to liquid hydrocarbons.1 This is an important reaction within the overall process that converts natural gas or coal to liquid hydrocarbons. Through the Fischer–Tropsch reaction gasification of biomass would provide a renewable source of high density liquid hydrocarbons. There is considerable interest to improve the selectivity of the conversion of synthesis gas. When liquid hydrocarbons are produced, formation of light gases has to be suppressed. For production of chemicals selective production of ethylene, propylene and oxygenates is desirable.In addition to expected dependence on catalyst composition, it appears that product selectivity and catalyst activity are a strong function of structure or particle size of the transition metal catalyst particles2 for particles of a few nanometres. For larger particles such structure sensitivity has not been observed.3 Also conditions are very important. For instance we have recently shown that at low temperatures small Ru particles have an extremely high oxygenate product selectivity.4
A first question one has to ask about a heterogeneous catalysed reaction is whether all the atoms exposed to the reagent gas or liquid are responsible for catalyst reactivity. This question of the number of reactive centers, selective for chain growth has been studied through transient kinetics experiments as SSITKA.5–9 The issue is an important one but difficult to experimentally establish. This is partially due to the changes of the surface that occur during the Fischer–Tropsch reaction itself.10 There appears to be general agreement that on metals as Co or Ru the number of reactive centers is small. This suggests that unique rarely present sites are responsible for selective chain growth. This is a view consistent with the theory we present here.
Because many reaction steps are necessary to conclude the reaction cycle and selectivity sensitively depends on surface concentrations of reaction intermediates and relative surface reaction rates, a kinetic analysis is indispensable to relate molecular reactivity information with catalyst performance.
Microkinetics approaches11 have been developed to predict the overall rate of catalytic reactions based on a kinetic scheme of elementary reaction rates. The rate constants of the elementary rates then are used without assuming a rate controlling step. Also kinetic Monte Carlo calculations, more convenient when lateral interactions or surface structure details have to be incorporated, provide a tool to simulate overall kinetics of surface reactions from molecular elementary rate constants based on the topology of a chosen surface.12
We will initiate our discussion of Fischer–Tropsch selectivity based on kinetic expressions that follow from the microkinetics approach. We will conclude this review with a short discussion of some initial results using kinetic Monte Carlo simulations.
The kinetic scheme of a reaction that typically consists of a network of parallel or subsequent elementary reaction schemes describes the reaction mechanism of a catalytic reaction. Many different reaction mechanisms have been proposed for the Fischer–Tropsch reaction.5,13–23 By a comparison of calculated elementary rate constants corresponding to the different proposed mechanism theory can assist experiment to discriminate between the different options.
Since in the Fischer–Tropsch reaction C–C bonds are formed and the carbon atoms to be incorporated in the growing hydrocarbon chain derive from CO, cleavage of the CO bond plays a crucial role in all of the different mechanisms that have been proposed. A major debate relates to the question of whether the reaction chain is initiated by CO dissociation, the carbide mechanism,24 or that the C–O bond cleaves once CO has been inserted into the growing chain, the Pichler–Schulz CO insertion chain growth mechanism.15 Many variations are possible and have been proposed based on these two opposing views.25
Since its invention nearly a century ago the molecular level understanding of the reaction mechanism of the Fischer–Tropsch reaction has increased significantly. For instance there is now a near general consensus that the chain growth occurs through the carbide mechanism.13
Within the carbide mechanism there are still many options for the chain growth reaction and hydrocarbon termination reactions. For instance there is a debate as to whether CH or CH2 is incorporated into the growing chain and on the nature of the growing chain. Originally it has been mostly proposed to be an alkyl chain.13 Two alternatives have been proposed and again there are many variations on these two major chain growth proposals. As strongly supported by Maitlis18–20 the growing intermediate is alkenyl, whereas Gaube23 favours alkylidene terminated hydrocarbon chains. The chain growth reaction, as we will see, is not a single elementary reaction step in which a C–C bond is formed, but also hydrogen addition steps are involved. A detailed study of this can be found in the work of Ciobica et al.26
Obviously with so many options for the chain growth reaction there are also many different proposals on the chain growth termination step. For instance most important for the growing alkyl chain is the question whether a hydrogen atom is added or removed. It generates an alkane or alkene molecule in the gas phase. Also termination can occur through CO insertion. This will lead to oxygenates as the product. Related options for chain growth termination exist for the other types of chain growth. For a more exhaustive discussion of these different mechanisms we refer to ref. 27.
Obviously all these different possibilities can be computationally investigated and several important studies have recently appeared.26,28–33 There are still many options to be investigated, especially how the longer chains are formed. What has become quite clear is that which chain growth path actually occurs depends sensitively on the reaction site structure as well as on the type of metal one studies. In this paper we will focus on computational results generated on a Ru(11![[2 with combining macron]](https://www.rsc.org/images/entities/char_0032_0304.gif) 1) surface,34 that we consider most adequate to simulate a reactive Fischer–Tropsch center of the Ru metal. Ru is a metal that is an excellent catalyst especially for the production of long chain hydrocarbon waxes.1
1) surface,34 that we consider most adequate to simulate a reactive Fischer–Tropsch center of the Ru metal. Ru is a metal that is an excellent catalyst especially for the production of long chain hydrocarbon waxes.1
Fe is the basis of Fischer–Tropsch catalysts used to convert synthesis gas derived from coal. Its water-gas shift activity helps to adjust the H2/CO ratio for optimum hydrocarbon chain formation.1 During reaction iron metal is converted into the carbide phase. Whereas important computational studies have appeared on the reactivity of surfaces of these phases,35–38 they are not as complete as the studies done so far on Co and Ru on which we will base this paper.
The current interest in Co as Fischer–Tropsch catalyst relates to its price and the absence of water-gas shift activity, useful for synthesis gas derived from natural gas.
Whereas during the Fischer–Tropsch reactions Fe is converted to the carbide, the metal catalysts have also found to change structure during reaction. Very important is the observation of strong restructuring of the Co catalyst surface during reaction14,39 as well as the suggestion40 that particular sites, similar to step edge sites are the primary sites responsible for selective reaction. During restructuring on the larger metal particles smaller metal islands are created that cover the surface of large particles. These smaller sized particles are proposed to be terminated with the selective step–edge sites. It possibly explains for Co the activity and selectivity independence of particle size observed for metal particles larger that 20 nm.3 On open Co surfaces active for the Fischer–Tropsch reaction adsorbed CO has been observed with a very low vibrational frequency (1285 cm−1) that gives low dissociation energy of the corresponding adsorbed CO.41
As we will explain in detail in the next section, that primarily deals with the kinetic consequences of the carbide mechanism for the Fischer–Tropsch reaction selectivity a low activation barrier of CO dissociation is essential for long chain hydrocarbon selectivity.
A low barrier of CO dissociation occurs on the step edge type of sites as found for the open Co or Ru surfaces.42–45 The probability of such surfaces to be present on the catalyst is low because of their relatively high surface energy. One can estimate the probability of the presence of such sites from the differences in surface energies. These can be used in a so-called Wulff construction,46,47 to determine the shape of a particle terminated by surfaces of different energy. The ratio of respective surface areas is inverse proportional to their surface energies. We estimate that only Ru particles of 10 nm or larger can stabilize the step-of edge type of sites needed for low activation energy dissociation of CO. Because of the small size of the Co atom, for Co this size will be approximately 6 nm. The impossibility to stabilize step–edge type sites on such small particles is reminiscent of similar proposals to explain the reduction of ammonia synthesis activity on small Ni particles, proposed initially by Van Hardeveld48 and later by Honkala et al.49 for Ru. Whereas in the Fischer–Tropsch reaction the activation barrier of CO dissociation becomes too high, in the ammonia synthesis reaction isoelectronic N2 dissociation becomes inhibitive.
Experimentally a significant decrease in activity and selectivity of Co particles has been observed in this size regime under conditions where oxidation of the small Co particles can be excluded.50,51 However the proposal that a decrease in the rate of CO dissociation is responsible for this phenomenon is not generally accepted. It has been also suggested that due to increased C adatom and O adatom as well as CO adsorption energies on the smaller particles the surface sites becomes blocked for CO dissociation and further reactions.9
To make further progress it is essential to understand in more detail the relation between the presence of the step-edge sites with catalyst performance. For instance it is not understood how the presence of such step–edge sites can be reconciled with stable operation of the catalyst. The question is why such a site is not poisoned by the growing hydrocarbon chain at such a site, inhibiting further reaction. We will discuss in detail the dual site model that resolves this problem.
The proposition that unique sites present at low concentration are responsible for Fischer–Tropsch selectivity implies that significant parts of the metal catalyst are in a state not relevant for selective Fischer–Tropsch activity. The stable terraces of little reactivity because of their high CO activation energies will be highly covered with CO. Also as we will show within the carbide mechanism such surfaces should give methane as their main product.
Another topic is the dependence of the chain growth reaction on temperature. We have recently observed in low temperature conversion reactions catalysed by Ru particles less than 3 nm that the chain growth probability of oxygenates increases with temperature. This is in contrast with the observed regular temperature dependence of olefin chain formation that decreases with temperature. We will show that this behaviour is consistent with a relative slow rate of CO dissociation on these particles.
2. The microkinetic model
Whereas we will present later a full atomistic mechanistic picture of the Fischer–Tropsch reaction here we will present a highly simplified kinetic model that leads to very illuminating insights into the dependence of selectivity of the Fischer–Tropsch reaction on the relative rate constants of essential intermediates. Two important fundamental references to the kinetics of the Fischer–Tropsch reaction on which part of this section is based are ref. 52 and 53.The following reactions are considered:
– CO adsorption and desorption
– CO dissociation; it generates a C1 species that can be incorporated into the growing hydrocarbon chain or can produce methane.
– Chain growth of adsorbed hydrocarbon intermediates through incorporation of the C1 species.
– Formation of gas phase hydrocarbons through chain growth termination by desorption of hydrocarbons from the surface.
The initial products of the Fischer–Tropsch reaction are dominantly linear n-alkanes or 1-alkenes. Also linear aldehydes, carboxylic acids or alcohols are formed. In our kinetic analyses we will only consider explicit termination as alkane or alkene.
We assume Oads removal to be fast, so that Oads does not have to be considered explicitly. In the later presented KMC simulations the presence of Oads and its rate of removal by hydrogenation are explicitly taken into account. This is the dominant process of oxygen removal from Co and Ru metal surfaces.
There are two reaction paths for CHx formation; CO dissociation followed by H atom addition to adsorbed C, or first addition of Hads to adsorbed CO with formation of intermediate adsorbed CHO species followed by cleavage of the CO bond.42,54,55 When dissociation of CO has a high activation barrier, the reaction path through the formyl intermediate dominates. However at reactive surface sites where the activation energy for direct CO dissociation is low, intermediate formyl formation usually has the higher barrier.43
As we discussed in the previous section the activation energy for CO dissociation is a strong function of the structure of the reaction center.56 Whereas at dense surfaces of CO or Ru the activation energies can be higher than 200 kJ mol−1, on step–edge sites this activation barrier may become less that 100 kJ mol−1.
Only for such low reaction barriers CO dissociation is fast enough that it can be considered quasi-equilibrated during the Fischer–Tropsch chain growth reaction. As we will see, the rate of C1ads intermediate formation that is incorporated into the growing chain has to be fast compared to the chain growth and chain termination reaction rates.
In the simplified kinetic model considered in this section the reactive C1 species is considered to be formed directly from CO.
In a next reaction step the C1 species is assumed to be incorporated into the growing hydrocarbon chain. Incorporation of the C1 species into the growing hydrocarbon chain is simplified to one reaction step, with a rate constant independent of the hydrocarbon chain length. In the KMC simulations of section 5 we will include explicitly the hydrogen atom transfer processes that are part of the surface hydrocarbon chain growth reaction.
There is no discrimination between CHads or CH2ads that are lumped together in the C1 species. It also implies that all hydrogen transfer steps involving the C1 species are implicit. Also the hydrocarbon chain termination reaction involves exchange of H atoms. Therefore the reaction rates in this model are not independent of hydrogen pressure, but this will not be considered explicitly in this model. Whereas the equations that result are extremely useful to discuss general aspects of the relation between selectivity and mechanism, validation of these assumptions through simulations with a truly atomistic model such as the KMC method, as presented in section 5, is essential.
2.1 The expressions for the chain growth probability α
The selectivity of the Fischer–Tropsch reaction is given by the relative rates of gas phase product formation as a function of chain length n. We will consider only formation of gas phase olefins since these are the main primary products of Co and Ru catalysis. The rate of formation of a single product is given by expression (1): | (1) |
The expression for the chain growth probability α then is given by eqn (2):
 | (2) |
 | (3) |
 | (4) |
 | (5) |
Expression (5) can be made more interesting by calculating the steady state expression for θ(n1):
 | (6) |
We will deduce different approximate expressions for θ(n1) that will highlight the different kinetics that result from differences in surface C1 coverage.
We will consider the two extreme cases of high and low C1ads surface coverage:
Case 1:
We will assume the rates of CO dissociation and surface O removal to be fast compared to the other kinetic constants in expression (6). Under this condition θ(n1) is close to 1 and adsorbed CO is in quasi-equilibrium with adsorbed C and O atoms.
The two conditions imply:
Condition 1:
Condition 2:
Then the following expression for α follows:
 | (7) |
 | (8) |
 | (9) |
To obtain a high value for the chain growth probability parameter α, κ has to be zero. Then the rate of CO dissociation has to be fast compared to the other reaction rates. Under this condition κ will be close to zero. From the many studies available on methane activation57–61 the activation energy for the hydrogenation of CHxads to give methane is well known, it varies between 100 and 170 kJ mol−1 when different surfaces and metals are compared. This gives an upper boundary to the apparent activation energy of CO dissociation for κ to be zero. We have to account properly for the differences in the activation entropies of the different reaction rates. The transition state of CO dissociation can be described as a tight transition state,62 with low mobility. The activation entropy of surface dissociation reaction is close to zero or slightly negative. The activation entropy for methane formation from adsorbed CHx species is large because methane transfers to a high mobility state in the gas phase. This leads to a difference of reaction rate pre-exponents at least of the order of 104. At a temperature of 500 K this may lead to a lowering of activation free energy by 40–60 kJ mol−1. This implies that for high selectivity of the reaction the activation energy of CO dissociation should not be higher than 110 or 130 kJ mol−1.
We will discuss later that on reactive catalytic centers and low reaction temperature the rates of methanation and hydrocarbon chain termination tend to be slower than the dissociation rate of CO, but at the higher temperatures this may inverse, with a dramatic consequence for the selectivity.
From expression 5 it is clear that the rate of hydrocarbon chain growth has to be fast compared to the rate of hydrocarbon chain termination.
Case 2:
Whereas in case 1 we analysed conditions for high selectivity when the rate of chain growth competes with the rate of CO dissociation or C1 formation, here we will consider the case that the rate of chain growth is fast and that the rate of hydrocarbon chain termination is slow. CO dissociation can be considered equilibrated. It implies a high surface coverage with growing hydrocarbon chains.
The maximum value for θ(n1) has to be consistent with the total surface coverage. For a uniform surface this leads to the relation (10):
 | (10) |
When we consider the surface to be nearly completely occupied with growing hydrocarbon chains an elegant relation, eqn (14) between θn1 and α can be deduced.
Since:
| θ(ni) = αi−1θ(ni); i ≥ 2 | (11) |
In expression (11), we assume the rate of hydrocarbon chain termination to be equal to the rate of C1hydrogenation to methane.
We find from (12):
 | (12) |
 | (13) |
and hence:
| θ(n1) = (1 − α) | (14) |
Substitution of eqn (14) into expression (5) for α gives an implicit relation for α that for high value of α has as approximate solution (15):
 | (15) |
We find that the surface checker board model leads to lower α values than expected for relation (5) assuming θn1 = 1. It is because the growing hydrocarbon chains block the surface for C1 species to be generated.
A dual site model as we will discuss in detail later improves this situation. In the dual site model CO dissociation and chain growth sites do not interfere. Now θ(n1) is independent of α. For the difference in predicted α values one finds (eqn (16)):
 | (16) |
Since rterm/r(ni,ni−1) is much smaller than 1, this implies a significant increase in chain growth probability for a dual type site.
2.2 The carbide mechanism versushydrocarbon chain growthviaCO insertion
The expression for the chain growth probability α(PS) is very similar for the Pichler, Schulz CO insertion chain growth mechanism compared to that of the carbide mechanism (17): | (17) |
The essential difference is that the monomer that is incorporated into the growing chain is the adsorbed CO molecule. For a high chain growth probability no initial CO dissociation is required. The mechanism is consistent with the presence of a high CO coverage. The precursor that initiates chain growth can be a C1ads species formed by dissociation of CO. Since this would require a site of low CO activation energy a step–edge site will be needed. This would be consistent with the presence of a low number of reactive centers on the catalyst surface.
In order to have a high chain growth probability the rate of chain propagation has to be fast compared to the rate of chain termination. Few calculations are available on the chain growth step through CO insertion. An important study is by Saeijs et al.29 For the Co (0001) surface they have computationally studied reaction intermediates and activation energies of the corresponding elementary reaction steps (see Fig. 1).
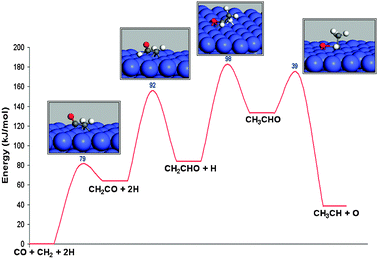 | ||
| Fig. 1 The reaction energy diagram of CO insertion into adsorbed CH2 and subsequent CO dissociation (adapted from ref. 29). | ||
Whereas CO insertion in a growing alkyl chain has a high activation energy, this barrier is low when CO is inserted into a carbene terminated hydrocarbon chain. However the overall barrier for C–C bond formation, including H addition and C–O bond cleavage is found to be 180 kJ mol−1. One has to conclude that the corresponding rate of propagation is slow compared to the estimated rate of termination. This excludes the Pichler–Schulz mechanism from being a relevant chain growth reaction path.
The high CO coverage experimentally observed are only in apparent contradiction to the low CO coverages we considered in the previous section dealing with the carbide mechanism. According to the carbide mechanism the selective sites for chain growth are sites with a low barrier of CO dissociation. According to the KMC calculations to be discussed later optimum rate occurs at approximately half coverage with CO. CO has to desorb partially in order to create vacancies for CO to dissociate. On the sites of low selectivity that predominantly produce methane, the terraces with a higher barrier of CO dissociation, where CO predominantly will dissociate through the hydrogen assisted formyl path (with a typical overall barrier of 130 kJ mol−1), the CO coverage tends to be higher because the rate of CO dissociation is much less. The experimental observation of a high surface coverage of CO therefore does not contradict chain growth catalysis that proceeds according to the carbide mechanism.
2.3 Temperature dependence of chain growth parameter α
We will now analyze regular and anomalous temperature dependence of the chain growth parameter α within the carbide mechanism.Since the activation energy for the rate of chain termination has to be larger than that of chain growth, expression (5) of α predicts a decrease of α with temperature as long as the temperature dependence of θ(n1) is not relevant.
This temperature dependence will be small, when CO dissociation can be considered equilibrated since then the barriers of activation will be low.
The start of the synthesis reaction above a minimum temperature relates to the increase in removal rate of surface intermediates that do not desorb from the surface at lower temperature. When CO does not inhibit the reaction, the relevant reactions are surface hydrogenation processes such as methane formation and related hydrocarbon chain termination reactions.
When on the other hand, at a low temperature, the rate of CO dissociation is slow because a high surface coverage of CO prevents dissociation, reaction starts when by temperature increase CO starts to desorb. Here we will discuss an example of such behavior.
When θn1, is low its initial concentration is given by expression (18):
 | (18) |
In the extreme limit of very slow rate of CO dissociation, the expression for the chain growth probability α then becomes (19):
 | (19) |
This can be rewritten as (20):
 | (20) |
The chain growth rate increases strongly with temperature because of a rapid increase in the concentration of C1ads species that results from the increase in rate of CO dissociation. This increase in rate of CO dissociation is due to the rapid decrease of the high initial apparent activation energy Eactapp(CO) with decreasing CO coverage (eqn (21) and (22):
 | (21) |
| Eactapp(CO) = Eactdiss(CO) + (1 − 2θCO)Eads(CO) | (22) |
The apparent activation energy is strongly temperature dependent due to its dependence on CO coverage. At very high CO coverage and low temperature the adsorption energy of CO (of the order of 120–150 kJ mol−1) is to be added to the activation energy of dissociation. This will increase the apparent activation energy to a value higher than the activation energy of methanation or chain termination. At higher temperatures CO will desorb. At the resulting lower coverage of CO the desorption energy has now only to be added fractionally to the intrinsic activation energy barrier of CO dissociation or can even be subtracted fractionally from the CO activation energy of dissociation.
One concludes that at low temperature when the coverage with CO is high the rate of CO dissociation is slow compared to the rate of methanation. Hence selectivity of the reaction will be low. When temperature increases and CO starts to desorb, the apparent activation energy for CO dissociation decreases and now the rates of methanation and hydrocarbon chain termination become competitive with the rate of CO dissociation.
Whereas in this mechanistic model at low temperature initially κ in expression (7) is large, it reduces to a low value at higher temperature. α has a maximum value when κ becomes zero. Once this temperature has reached a further increase in temperature will increase the relative rate of the termination reaction (with the then slowest relative rate and the higher activation energy) compared to the other elementary reaction rates and α will decrease. Therefore one expects a maximum in α as a function of temperature. This behavior is schematically illustrated in Fig. 2.
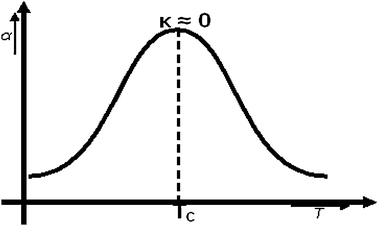 | ||
| Fig. 2 Schematic dependence of α as a function of temperature. The increase of α with temperature occurs as long as dissociation is inhabited by coadsorbed CO. | ||
An interesting illustration of this anomalous behavior of α has been found for low temperature synthesis gas conversion on very small Ru (2–3 nm) particles in a water solution.4 In this reaction the chain growth parameter α for oxygenate formation shows a temperature dependent behavior opposite from that of olefin formation (Fig. 3).
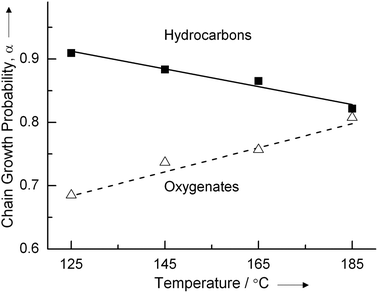 | ||
| Fig. 3 Chain growth probabilities of hydrocarbon and oxygenates formation measured at low temperatures for Ru particles of 2–3 nm in the water phase (ref. 4). | ||
At the lowest temperature of the experiment the Ru particle is saturated with CO and the rate of CO dissociation will be slow. When oxygenates are produced as aldehydes or alcohols chain termination occurs by insertion of CO into the growing hydrocarbon chain. At low temperature the selectivity of oxygenate formation is 80%. This agrees with the slow rate of CO dissociation. When temperature increases desorption of CO increases the CO dissociation rate relative to termination by CO insertion. This increases the chain growth probability of oxygenate formation. In agreement with experiment at the same time overall selectivity towards oxygenate formation will decrease.
The decrease in chain growth probability α for alkene formation shows the regular observed temperature dependence. Apparently alkene formation occurs on different sites from oxygenate formation. CO dissociation is already fast and quasi equilibrated at the lower temperature. As we will see in the KMC simulations then hydrocarbon chain removal from the surface initiates product formation at the lower temperature.
3. The surface reactivity model, quantum chemistry of C–C bond formation
3.1 Background
It is now well understood that surface structure dependence is different for the type of reactant chemical bond that is activated or formed.29,56,62 Structure sensitivity of the Fischer–Tropsch reaction is complex since the types of reactions that occur consecutively or parallel on the catalyst surface are quite different. One has to distinguish activation of CO bonds that have π character from formation or cleavage of CH bonds that are of σ character. Dissociation of the π bonds of CO initiates formation of the CHx intermediates that are inserted into the growing hydrocarbon chain. In the termination reaction reactions σ CH bond formation occurs.The activation energy for bond cleavage of CO is very sensitive to surface structure. Low activation energy barriers require step–edge or as they are also called B5 type sites on metals as Co and Ru,30,45 the metals that are considered here. CH bond formation is rather independent of surface structure. It proceeds typically over the top of surface atoms.57,58,60
CHx–CHy bond formation has been also been extensively studied.28,29,31,32,58 The activation energies depend strongly on the number of hydrogen atoms attached to the reacting intermediates. This also determines significantly its dependence on the details of surface site structure.
CHads can be formed in two ways. On surfaces with a high barrier for CO activation a competitive path to CO cleavage is through intermediate formation of adsorbed HCO.42,43,54 Upon cleavage of the CO bond a surface CH intermediate is formed. On Ru it has been found that this C–O dissociation path is rather structure insensitive. The lower bound to the activation energy for this reaction is 130 kJ mol−1.43 The structure insensitivity of the C–O dissociation path through the formyl intermediate is in sharp contrast to the reaction path for CH formation through successive direct CO dissociation and consecutive CH formation through Hads addition to the adsorbed C atom. On corrugated Ru surfaces activation energies of CO dissociation as low as 50 kJ mol−1 haven't been found. Barriers for consecutive CH formation tend to be higher then this low value of direct CO dissociations. It can vary from 50 to 90 kJ mol−1.
The overall activation energy for CHads formation has to be low compared to that of growing chain termination. The latter activation free energy barrier value is typically between 100–130 kJ mol−1. Hence on a step-edge B5 type site the two step reaction path, with prior CO dissociation and subsequent CH formation is the preferred pathway. It will have an overall activation barrier less than 100 kJ mol−1.
The removal of Oads generated by decomposition of the CO bond to form H2O is generally an easy reaction. The preferred path for H2O formation is the reaction of Hads with Oads to give OHads, and subsequent recombination of OHads intermediates to give H2O and Oads.63–65 On a Co(0001) or Rh(111) surface a typical value of the barrier of OH formation is 90 kJ mol−1. On corrugated surfaces as the fcc(211) surface a value lower by 30 kJ mol−1 is found. Values for the activation energies of OH recombination are typically 60 kJ mol−1 on the dense terraces. On stepped surfaces activation energies as low as 5 kJ mol−1 can occur.
3.2 The site regeneration mechanism
In this subsection we will summarize DFT computed reaction energies and activation energies as calculated using the PW91 functional as implemented in VASP, for CO dissociation and CH–CH bond formation on the Ru(11![[2 with combining macron]](https://www.rsc.org/images/entities/char_0032_0304.gif) 1) surface, representative of a B5 reaction site model.48 In particular we are interested in the question of how CH–CH formation can occur without suppressing CO activation.
1) surface, representative of a B5 reaction site model.48 In particular we are interested in the question of how CH–CH formation can occur without suppressing CO activation.
Starting with an initial C atom generated at the site of CO dissociation, Fig. 4 shows consecutive H addition, CO adsorption and CO dissociation.
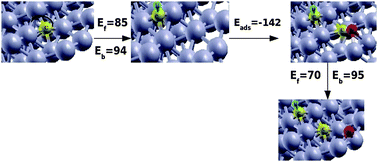 | ||
Fig. 4 CH formation and CO dissociation in the presence of coadsorbed CH on Ru(11![[2 with combining macron]](https://www.rsc.org/images/entities/char_0032_0304.gif) 1) surface. Grey, yellow, red and blue spheres correspond to Ru, C, O and H atoms respectively. Ef and Eb correspond to forward and backward reaction barriers respectively; Eads is the adsorption energy of CO in the presence of CH. Energies are given in kJ mol−1. 1) surface. Grey, yellow, red and blue spheres correspond to Ru, C, O and H atoms respectively. Ef and Eb correspond to forward and backward reaction barriers respectively; Eads is the adsorption energy of CO in the presence of CH. Energies are given in kJ mol−1. | ||
The preferred mode of CO adsorption is in the fourfold hollow site within the step edge of the (11![[2 with combining macron]](https://www.rsc.org/images/entities/char_0032_0304.gif) 1) surface. This leads to a very stable fivefold coordinated Cads species after dissociation. This mode of CO adsorption directs the O-atom not to the top edge of the B5 type site but to its bottom. The CO is initially parallel adsorbed to the surface with its C atom attached to the fourfold site that is part of the vertical step edge. Interestingly such adsorption modes have been predicted twenty years ago based on Extended Huckel calculations.66 This initial parallel orientation of CO is important since it will generate O on the bottom of the step edge, whereas as we will see C–C bond formation will occur on top of the step edge.
1) surface. This leads to a very stable fivefold coordinated Cads species after dissociation. This mode of CO adsorption directs the O-atom not to the top edge of the B5 type site but to its bottom. The CO is initially parallel adsorbed to the surface with its C atom attached to the fourfold site that is part of the vertical step edge. Interestingly such adsorption modes have been predicted twenty years ago based on Extended Huckel calculations.66 This initial parallel orientation of CO is important since it will generate O on the bottom of the step edge, whereas as we will see C–C bond formation will occur on top of the step edge.
The activation energy of CH bond formation of 85 kJ mol−1 has been calculated with reference to the energies of an adsorbed hydrogen atom and adsorbed carbon atom at an infinite distance from the reactive site. Its reaction energy is only 10 kJ mol−1. The CHads species is unstable in its fourfold site and moves with low activation energy to a three fold site atop of the step edge. This liberates the fourfold site with the step edge for adsorption of CO, which has of course a lower adsorption energy compared to the situation in the absence of coadsorbed CH. The computed adsorption energy of CO is now −142 kJ mol−1 to be compared to −206 kJ mol−1 for low coverage CO.
Based on the discussion in the previous section we will assume that O removal is fast. So in the actual reaction a vacant site next to CO is available, CO then can dissociate and will again give an O atom at the bottom of the reaction center. This oxygen atom will be removed quickly. The activation energy for CO activation of 70 kJ mol−1 is unchanged compared to the barrier found in the absence of coadsorbed CH. It has reaction energy of −25 kJ mol−1.
There is now the question whether the C adatom will react directly with CH atop of the step edge or that the C atom in the fourfold site will react first with H and then the two CH species recombine. On a different step edge site Liu and Hu32 proposed the first reaction to have the lower barrier. On this site Cads was adsorbed in a three fold coordination site. However with Cads in the fourfold site the barrier of this reaction becomes 100 kJ mol−1 higher. Instead on the surface site we consider here fourfold Cads first to be hydrogenated to give CH. It will recombine with a barrier of 88 kJ mol−1 with CH on the top of the edge. However the resulting HCCH intermediate will now block the site for CO activation.
There appears to be an alternative reaction path. The CH species initially located atop of the step–edge diffuses with a low barrier to a neighboring site. The second CH species diffuses from its initial fourfold site within the step edge to the now vacant three fold site atop of the step edge. This is indicated in the red line of Fig. 5.
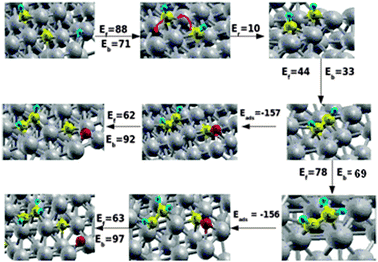 | ||
| Fig. 5 Second CH formation, CH–CH coupling reaction, CH–CH2 formation and CO dissociation in the presence of coadsorbed CH–CH and CH–CH2 intermediates on Ru surface. Grey, yellow, red and blue spheres correspond to Ru, C, O and H atoms respectively. Ef and Eb correspond to forward and backward reaction barriers respectively, Eads is the adsorption energy of CO in the presence of CH and Er is the reaction energy of the diffused CH + CH state. The red lines describe the diffusion of the CH intermediates. Energies are given in kJ mol−1. | ||
The corresponding diffusion barriers are respectively 45 and 53 kJ mol−1 as indicated in Fig. 6 that shows the overall reaction energy diagram. This arrangement of CH species vacates the active site for CO dissociation. The barrier for consecutive CH–CH bond formation is only 44 kJ mol−1.
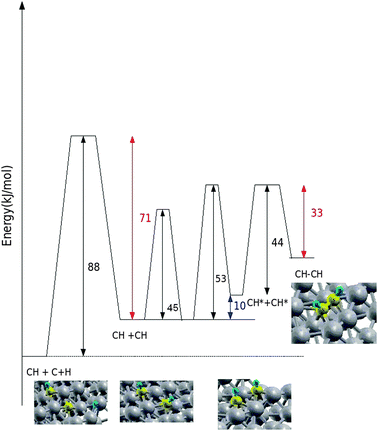 | ||
| Fig. 6 The reaction energy diagram that corresponds to the CH–CH bond formation reaction steps considered in Fig. 4 and 5. | ||
Formation of CH2ads has a barrier of 85 kJ mol−1 and hence is slower than CH diffusion or HC–CH bond formation. The HCCH intermediate can be hydrogenated to vinyl species with a barrier of 78 kJ mol−1 (Fig. 5). The hydrogen addition reaction is slightly endothermic by 9 kJ mol−1.
Earlier we proposed26 that consecutive chain growth proceeds from this intermediate through incorporation of CH intermediates. These two results together provide a consistent framework for the proposal that CH instead of CH2, as often proposed13 is the key C1 species to be incorporated into the growing hydrocarbon chain.
The next crucial step is to verify whether low barrier CO dissociation is still achieved in the presence of the HCCH or HCCH2 intermediate. As is illustrated in Fig. 5CO can readsorb with adsorption energy of −157 kJ mol−1 and will dissociate with a barrier of only 62 kJ mol−1.
This sequence of reaction steps resolves the issue of possible site poisoning of the B5 site by the growing hydrocarbon chain. It confirms the proposal of Beitel et al.40 that formation of hydrocarbons occurs in the vicinity of the defect or stepped sites.
The self-blocking of the active sites by the growing chain is prevented by a synchronized motion of C1 species. Upon hydrogenation they move from the fourfold coordination sites within the step–edge to a three fold coordination site on top of the step–edge where they insert into the growing carbene type hydrocarbon chain.
In essence the dual site model decouples the optimum site requirement for CO dissociation from that of C–C bond formation in the growing chain that takes place on a different site position.
4. The resulting chain growth reaction mechanism and its kinetics
Many variations on the carbide-intermediated chain growth mechanism have been proposed. For a recent summary we refer to ref. 27. Essential questions relate to the nature of the growing chain, e.g. alkyl or alkenyl type and the nature of the C1 species, CH versusCH2 that are incorporated into the growing chain. As mentioned earlier the details appear to be metal as well as site structure dependent. Below we will analyse the consequences of the chain growth model on the dual site represented by the Ru(11![[2 with combining macron]](https://www.rsc.org/images/entities/char_0032_0304.gif) 1) surface.
1) surface.
At the Ru(11![[2 with combining macron]](https://www.rsc.org/images/entities/char_0032_0304.gif) 1) site we find that initial formation of the first C–C bond occurs by recombination of two CHads species that forms strongly adsorbed acetylene. Hydrogen atom addition provides a low energy path to the vinyl intermediate. This intermediate we identified previously26 as relevant to the next chain growth reaction step that involve insertion of another CH intermediate. Chain growth then occurs through carbene terminated alkene chains that undergo H addition in consecutive reaction steps. Chain termination by addition of a hydrogen atom to the chain terminating C atom with rate
1) site we find that initial formation of the first C–C bond occurs by recombination of two CHads species that forms strongly adsorbed acetylene. Hydrogen atom addition provides a low energy path to the vinyl intermediate. This intermediate we identified previously26 as relevant to the next chain growth reaction step that involve insertion of another CH intermediate. Chain growth then occurs through carbene terminated alkene chains that undergo H addition in consecutive reaction steps. Chain termination by addition of a hydrogen atom to the chain terminating C atom with rate  results in adsorbed olefin, addition of a hydrogen atom to the C atom of the hydrocarbon chain β with respect to the terminating chain carbon atom with rate
  gives an intermediate suitable for insertion of another CH species or for consecutive alkane formation. Note that rates rH depend implicitly on hydrogen coverage. The resulting reaction mechanism is related to the Maitlis proposals of chain growth.17,18 The ratios of rates
  versus
 bias the reaction to be terminated or to continue chain growth. This reaction scheme will also be the basis for the KMC simulations presented later.
We will analyse here the consequences of the mechanistic scheme outlined above to molecular kinetics. The corresponding reaction energy diagrams, necessary to actually select the rate constants will be presented in the next section.
Ignoring re-adsorption, the rate of olefin formation normalized per unit surface area is given by (23):
 | (23) |
Assuming the rates of olefin desorption to be independent of hydrocarbon chain length the expression for the chain growth parameter α is:
 | (24) |
 | (25) |
since:
 | (26) |
 is the rate of bond cleavage of the corresponding CH bond.
We will work this out for the example of ethyleneversuspropylene formation. Then:
 | (27) |
Expression (28) relates θ(CH–CH–CH3) with θ(CH–CH3):
 | (28) |
The steady state expression for θ(CH–CH2–CH3) can be easily found. It gives a relation with θ(CH–CH–CH3). As a result we find the following relation (29) between θ(CH–CH–CH3) and θ(CH–CH3):
 | (29) |
 is the rate of hydrogen atom addition to the growing alkyl chain to form gas phase alkane.
The relation (30) between θ(CH–CH2) and θ(CH–CH3) can be easily deduced:
 | (30) |
 is the rate of the corresponding CH cleavage reaction.
The chain growth parameter α now not only depends on kcc and chain termination rate  , but also on
  and
and  . α becomes:
 | (31) |
In case the elementary rate constant for C–C bond formation is large compared to the rate constants of H-atom transfer expression (31) reduces to:
 | (32) |
This is an interesting result. It shows that within the alkenyl chain growth mechanism the ratio of rates of H atom addition to the different unsaturated C atoms in the hydrocarbon chain control hydrocarbon chain length selectivity to a significant extent.
Expression (32) has been deduced with the implicit assumption that the C–C bond formation reaction is irreversible. This is usually assumed in Fischer–Tropsch kinetics. At the end of section 5 we will discuss the expression that results when reversibility of the C–C bond formation is explicitly accounted for.
5. Kinetic Monte Carlo simulations
5.1 The method
Kinetic Monte Carlo12,67 techniques are employed in this work to study the overall kinetics of the Fischer–Tropsch process. A precise analysis of the surface kinetics involves a two-fold approach: (i) an accurate description of the involved elementary processes including the adsorption and desorption as well as surface diffusion and surface reactions with a high level quantum mechanical study; and (ii) an actual occurrence of the individual elementary processes with regards to the different reaction mechanisms. KMC comes in to play as the most effective tool to obtain the latter part of this objective. It does this mainly by coarse-graining the time evolution of the relevant rare-event dynamics.68 Our approach to KMC employs a so-called lattice-gas model, where the KMC is based on the concept that atoms or molecules adsorb onto well-defined positions called sites that form a regular grid or a lattice.The evolution of a system as a function of (real) time can be described by means of the chemical Master Equation (ME), which can be derived from first principles (33):
 | (33) |
In this set of equations, Pα denotes the probability to find the system in configuration α at time t; Wαβ is the transition probability per unit time of the reaction that transfers configuration β into α. These transition probabilities per unit time in our case specify the rate at which the layer of adsorbates on the surface changes due to reactions. They have an Arrhenius form of temperature dependence and are determined by the elementary rate constants we use. ME is a gain–loss equation. The first term on the right stands for increases in Pα due to reactions that change other configurations β into the configuration α of the adsorbates on the surface. The second term stands for all reactions that convert the current configuration α of the adsorbates on the surface into some other configuration.
The algorithm that we used is called the First Reaction Method.12 In this algorithm, a tentative time is calculated for every possible reaction. All reactions together with their tentative times are stored in an event list. The algorithm proceeds by repeatedly performing the following steps: select the reaction with minimal time from the event list, advance the system time to the time of this reaction, adjust the lattice according to the reaction, and update the event list.
The KMC calculations have been performed on a 2 × 2 fcc-(111) type grid with a dimension of 66*66 sites. All reactions take place on three-fold hollow sites. Of particular importance is to comprehend the site occupation rules we use. Fig. 7 below shows the schematic representation of the sites occupation and blocking rules we use in our KMC simulations. The red crosses in the scheme represent the sites which are blocked for other species to either adsorb or to diffuse to. Once CO or H adsorbs onto a site, their nearest neighboring sites are blocked from further adsorption. Similar is the site occupation rule when CO dissociates. This blocking of sites which is employed in this work is the acute form of repulsive interaction between the adsorbates.
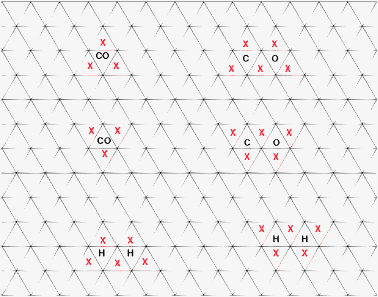 | ||
| Fig. 7 Schematic to show the site occupancy rules in KMC simulations of the fcc(111) surface. Red crosses show the sites which are blocked for other adsorbates to either diffuse or adsorb onto. | ||
The simulation grid we choose implies a choice of a uniform surface, simpler than the dual site surface model discussed in the previous section. Below we will indicate how we use the data from the previous section to create an elementary rate constant database.
The simulations can be run once the reaction mechanism is mapped onto a reaction energy diagram that prescribes adsorption energies and activation energies. Using standard transition state reaction rate theory elementary reaction rates constants can be deduced when for each elementary reaction step also the pre-exponent frequencies are defined that depend on the corresponding activation entropies.
The simulations compute changes in surface concentration and amount of gas phase product formed as a function of time. Product re-adsorption and gas phase concentration change is not accounted for. We will only collect data that represent the steady state of the reaction. The Kinetic Monte Carlo method is a stochastic method so that data have to be averaged in time. Also concentrations have to converge to a steady value. Regarding diffusion of various adsorbates, all adsorbates have same hopping probability between occupied and neighboring unoccupied site. The pre-exponents of 1013s−1 are used for all the surface reactions and a barrier of 15 kJ mol−1 is used for the diffusion of each species among its neighboring sites. This implies that diffusion is fast compared to the other limiting processes.
The surface states that are used for all the calculations presented in this paper are prepared following a particular procedure that gave reproducible results with a significant speed up of the calculations. A bare surface was first covered up to 70% with C. This was then introduced to hydrogen gas pressure at a temperature of 400 K for up to a time of 5 × 10⁻⁴ s. CHx species were allowed to form with the same rates as they are used in production runs. This resulted in the reduction of C up to 50% and CH formation up to 12–14% and little amounts of CH2 and CH3 on the surface. This surface was then used as the initial surface for all the subsequent results presented in this paper. All the calculations were performed with a time step of 10−5 s for a total of 200 steps. Starting from the surface described earlier, calculations were performed in steps of 0.002 s in such a way that subsequent calculation is started with the previous final configuration, until the system reaches steady state, without significant changes in the surface concentrations. At this stage, the calculation was repeated for one more time and the average reactivity (no. of molecules desorbed per catalyst atom per second) in this calculation is reported. When using proper initial concentration guesses we find convergence typically after a few days processor time. The error bar on the accuracy of the calculations varies. For low production figures it can however be as high as 25%. This can be improved when larger grid sizes are used.
An insightful way to represent the reaction rate simulation data is to plot product formation as a function of temperature. Generally the rate of a catalytic reaction shows a maximum as a function of temperature, which is characteristic of each reaction. Additionally changes in surface concentrations can be analyzed. One can extract information on the relative rates of individual reaction steps by analyzing the frequency of the corresponding elementary reaction steps.
5.2 The reaction energy diagrams
In this paper we will describe KMC simulations of the chain growth selectivity leading to methane, ethylene, and propylene within the mechanistic model that we outlined in the previous section. We limited the simulations to the surface topology of the simple grid explained in section 5.1. We have constructed artificial reaction energy diagrams that contain energetic data close to those calculated quantum-chemically for the Ru (11![[2 with combining macron]](https://www.rsc.org/images/entities/char_0032_0304.gif) 1) surface discussed in section 3.
1) surface discussed in section 3.
The philosophy chosen to develop the reaction diagrams has been to have close agreement between calculated overall reaction energies and experimental known overall reaction energies. The overall experimental reaction energies of methane and ethylene formation are 206 kJ mol−1 and 220 kJ mol−1 respectively. These are to be compared with the calculated reaction energies of 196 kJ mol−1 and 210 kJ mol−1. For CO and H2 adsorption, energies have been adjusted to experimentally acceptable values (temperature of desorption of CO and H2 at respectively 520 K and 480 K at CO pressure of 5 bar and H2 pressure of 15 bar) and the pre-exponents of the reaction rates have been adjusted to give desorption temperature profiles in line with experiment. Comparison with experimental data can only be approximate because in the simulations lateral interactions have not been included.
The other choice made is to consider the chain growth reaction parameters independent of chain length.
Water formation reaction energies agree closely with parameters known from theory and experiment. Actual Oads removal occurs through initial OHads formation and consecutive recombination of the OHads species. However the respective barriers are only low on different surfaces. This implies that surface diffusion of OHads is important. Since we use a grid with only one type of reaction center we decided to simplify the kinetics of water removal to two consecutive reaction steps in which Oads converts to OHads and OHads is directly removed as H2O gas, with energies selected to match the overall thermodynamics of reductive water formation as if two different surfaces are present. The overall activation barrier is set equal to the thermodynamic barrier of Oads removal by hydrogen. Chosen parameters give a reduction temperature of the adsorbed oxygen atoms exposed to 15 bar H2 of 360 K. This number is to be compared with a recently measured temperature of reduction of O on the dense Co (0001) surface of 390 K.69 Obviously different oxygen reduction temperatures can be easily modeled by allowing for higher activation energy of the OH removal step.
The reaction energy diagrams contain ground state energies as well as transition state energies of reaction intermediates and their respective elementary reaction steps. We will compare the results of simulations in which we vary activation energies (e.g. the CO activation energy for dissociation), without altering the thermodynamics of such steps.
Fig. 8–10 give representative reaction energy diagrams for methane, ethylene and propylene formation respectively.
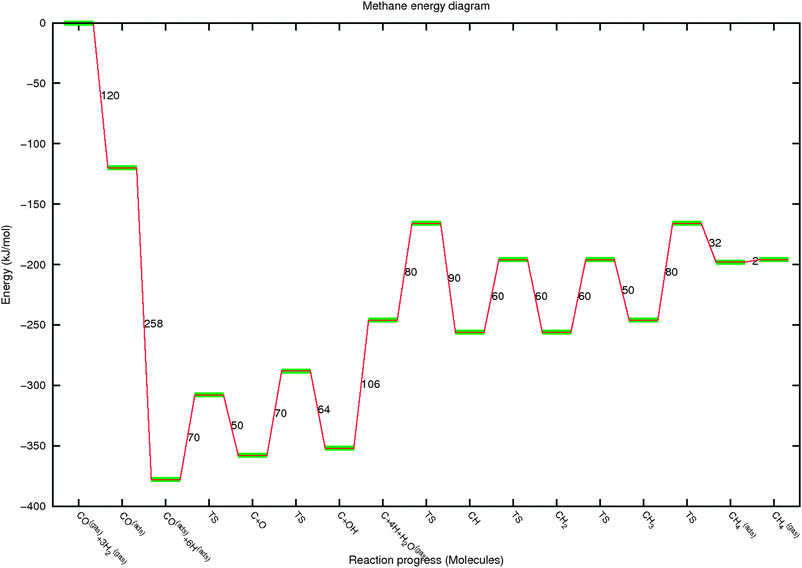 | ||
| Fig. 8 The reaction energy diagram for methane and H2O formation from gas phase CO and 3H2. Relative energies of reaction intermediates and their reactions are indicated as a function of reaction progress. In the figure the different stages of the reaction are indicated by the formation of reaction intermediates. | ||
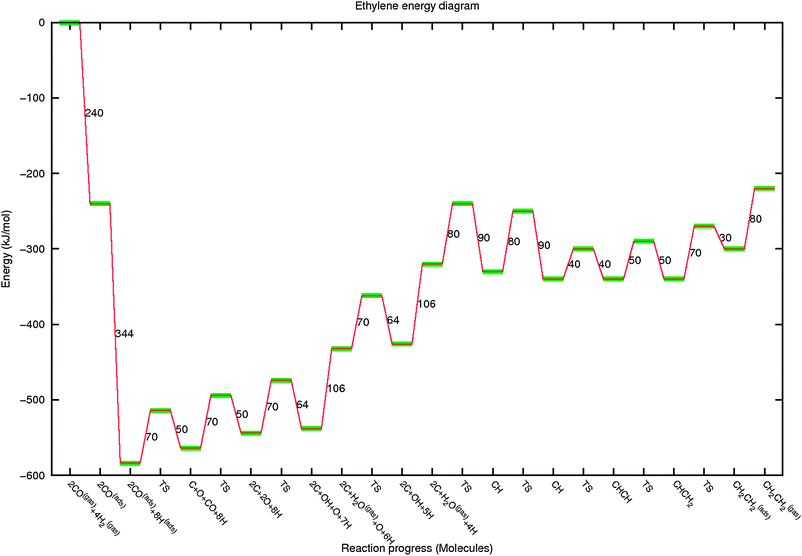 | ||
| Fig. 9 The reaction energy diagram for ethylene formation from 2CO and 4H2. See also the legend of Fig. 8. | ||
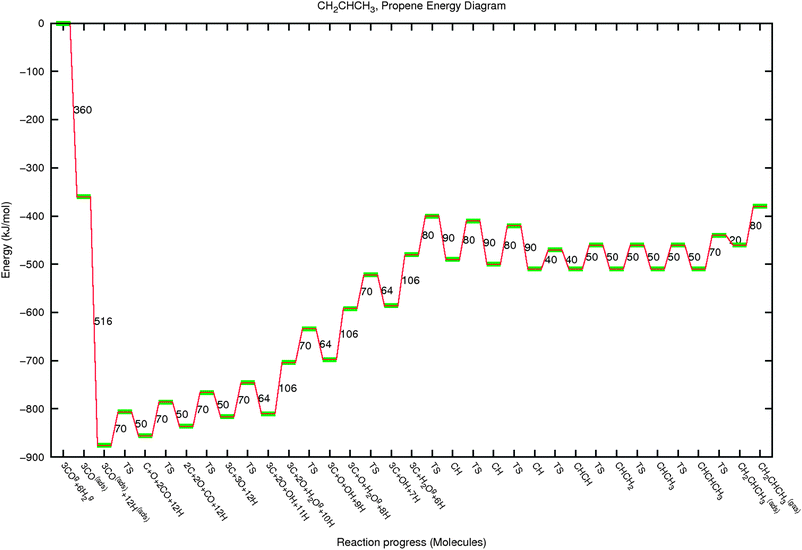 | ||
| Fig. 10 The reaction energy diagram of propylene formation. See also the legend of Fig. 8. | ||
In Fig. 8 we note that the following sequential steps have been chosen. Initial CO adsorption is followed by dissociative adsorption of three H2 molecules. Then CO dissociates and Oads is removed. Finally Cads is hydrogenated in four steps to give methane. We have simplified the reaction energy diagram by choosing the relative energies of CH, CH2 to be similar and slightly more stable than C and CH3. There is no actual need to do this, but it helps in initial interpretation of the simulations.
In Fig. 9 and 10, the reaction diagrams have been extended and modified for formation of ethylene and propylene respectively.
In the reaction energy diagram for ethylene, C–C coupling is included. CO activation, O removal and CH formation is treated similarly as for methane formation. For ease of interpretation we have selected the relative energies of CH, CHCH and CHCH2 to be similar. This is based on the data on Ru(0001) by Ciobica et al.26 as well as those on C–C bond formation, discussed above. Comparable data collected on the Fe(100) surface can be found in ref. 31 and in ref. 28 for different Co surfaces. Note that all reaction steps are necessarily reversible. The values derived from quantum-chemical calculations are very different from those used previously based on the approximate UBI-QEP method, as for instance used in a microkinetics study by Storsaeter et al.70
Fig. 10 presents the chosen sequence of elementary reaction steps for propylene formation from gas phase CO and H2. The energetics of the initial C–C bond formation has been taken as similar for ethylene. This has been extended with the same parameters for the formation of the higher hydrocarbon. Note that there is no a priori reason for this. Again this choice helps in the interpretation of our simulations. Notice the chemically different hydrogen addition reactions for methane and ethylene formation as well as the chemical difference in C–C bond formation in ethylene formation compared to that of propylene. This provides the reason for the non Schulz–Flory behaviour of methane and ethylene in contrast to that of the hydrocarbons with more than two carbon atoms.
The rates for methane formation from surface CHx species or chain growth termination are slow as long as temperature is not too high. The rates are comparable to that of H2O formation. At increasing temperature the high pre-exponents of the rate constants of formation of gas phase molecules for higher activation energies and lower pre-exponents of the surface reactions. The activation energy of CO dissociation is low so that at hydrocarbon formation condition CO dissociation will be equilibrated. The rate of CHads formation from C will be slower and it will be the rate constant that competes with methane formation or hydrocarbon chain termination.
Whereas the reaction energy diagrams of the different products have been presented here separately in the simulations they act in parallel.
For the determination of the reaction rates also activation entropies have to be chosen. Table 1 gives the list of the pre-exponents that have been used for the elementary rate constants. For most of the surface reactions the activation entropies have been assumed to be zero. Except for the case of water formation, where we assumed OH to be mobile. This was necessary in order to have enough build up of OHads intermediates for efficient H2O removal.
| Reaction | υ (s−1) | Reverse reaction | υ (s−1) |
|---|---|---|---|
| CO (gas) → CO (ads) | * | CO (ads) → CO (gas) | * |
| H2 (gas) → H (ads) + H (ads) | * | H (ads) + H (ads) → H2 (gas) | * |
| CO → C + O | 1013 | C + O → CO | 1013 |
| C + H → CH | 3.21*1013 | CH → C + H | 2.81 × 10¹³ |
| CH + H → CH2 | 2.10*1013 | CH2 → CH + H | 1.00 × 10¹³ |
| CH2 + H → CH3 | 1.25*1014 | CH3 → CH2 + H | 4.53 × 10¹³ |
| CH3 + H → CH4 | 1.01*1017 | CH4 → CH3 + H | 1013 |
| CH4 (ads) → CH4 (gas) | 1013 | — | — |
| CH + CH → CHCH | 1013 | CHCH → CH + CH | 1013 |
| CHCH + H → CHCH2 | 1013 | CHCH2 → CHCH + H | 1013 |
| CHCH2 + H → CHCH3 | 1013 | CHCH3 → CHCH2 + H | 1013 |
| CHCH3 + CH → CHCHCH3 | 1013 | CHCHCH3 → CHCH3 + CH | 1013 |
| CHCHCH3 + H → CH2CHCH3 | 1013 | CH2CHCH3 → CHCHCH3 + H | 1013 |
| CH2CHCH3 (ads) → CH2CHCH3 (gas) | 1017 | — | — |
| CHCH2 + H → CH2CH2 | 1013 | CH2CH2 → CHCH2 + H | 1013 |
| CH2CH2 (ads) → CH2CH2 (gas) | 1017 | — | — |
| O + H → OH | 1013 | OH → O + H | 1010 |
| OH + H → H2O (gas) | 4.45 × 10¹⁶ | — | — |
In the actual simulations we have included also formation of butene and pentene. Their corresponding reaction energy schemes are very similar to that of propylene formation, except for the inclusion of more reaction chain growth steps to allow for formation of the longer hydrocarbon chains.
5.3 Results of simulations
We will present initial results of simulations of methane, ethylene, and propylene formation. Molar rates of product formation are plotted as a function of temperature. Gas phase concentrations of CO and H2 have been kept constant. The CO/H2 gas phase pressure ratio is 3 and total pressure 20 bar. The main goal is to study the dependence of the selectivity of the chain growth reaction on the relative rates of C1ads formation, that relates to the dissociation rate of COversus that of the rate of chain growth termination.Termination of the simulations with chain growth up to a particular chain length, leads to accumulation of that product. This can be artificially adjusted by introducing a competitive reaction for the product of maximum chain length. We introduced formation of the alkane next to the alkene. Fig. 11 and 12 illustrate this difference in behaviour for simulations where we limit chain growth to formation of C1, C2 and C3 products. We used the parameters given by Fig. 8–10 and Table 1.
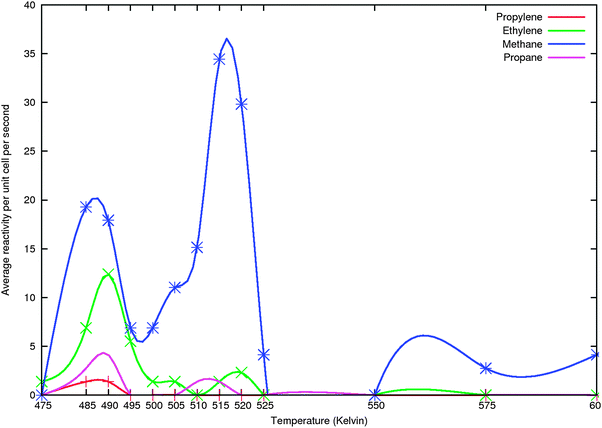 | ||
| Fig. 11 KMC simulation of molar methane, ethylene and propylene production as a function of temperature in a simulation that does not include products of hydrocarbon chain length of four carbon atoms and more. Fast propane formation (see text) is included. Parameters similar to Fig. 8–10 and Table 1. | ||
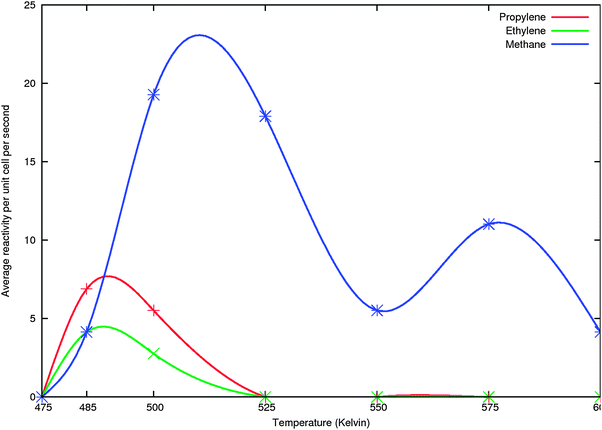 | ||
| Fig. 12 The results of KMC simulations not including propane formation with same parameters as used in Fig. 9, but less data points have been included. Points are smoothly connected through c-spline. | ||
In the simulation of Fig. 11 we included formation of the CHCH2CH3ads species with the same parameters as for CHCH3 formation. Subsequent hydrogen atom additions were treated as surface reactions with activation barriers of 50 kJ mol−1 and 0 reaction energies. Propane was desorbed with an activation barrier of 70 kJ mol−1 and a pre-exponent of 1017s−1. We observe three maxima in methane formation and higher hydrocarbon production mainly in the lower temperature methane production peak. We will show later that this type of behavior is also reproduced when we extend the simulations to the production of also butene and pentene. The simulation presented in Fig. 12 is similar to that of Fig. 11 but does not include the propane formation step. Also less data points have been collected than for Fig. 11. That is why the double peaked structure of methane production in the lower temperature is not observed. However we now find, because of the accumulation effect that propene production is higher than that of ethylene. Note the much higher product formation rate of methane and higher selectivity of ethyleneversuspropylene in the simulations when propane formation is included. It indicates that inclusion of the propane formation valve biases the simulation towards a proper prediction of Fischer–Tropsch product formation yield.
In order to validate the observation of different maxima in production rate especially as a function of temperature, we show in Fig. 13 the results for methane, ethylene and propylene formation in a simulation when product formation up to pentene is included. Analogous to the simulations presented in Fig. 11 we now include rapid pentane formation. Butene and pentene production are too low to be reliable. In the later Fig. 15 we compare simulations for several different values of the activation energies of CO dissociation and recombination (in parallel with the activation energy of CO dissociation we varied the activation energies for Cads and Oads recombination in order to keep the corresponding reaction energies unchanged).
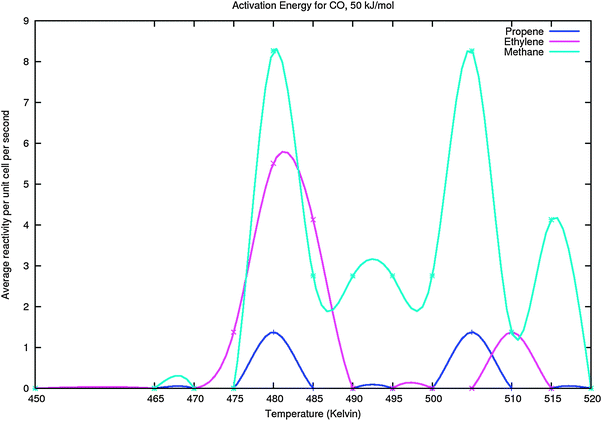 | ||
| Fig. 13 Methane, ethylene and propylene formation in the C1–C5 simulations including pentane formation studied as a function of temperature. Edissact(CO) equals 50 kJ mol−1. The other parameters are similar to those of Fig. 11, except that of propane formation has been excluded. They have been extended to include formation of butene, pentene and pentane. | ||
The twin peak behaviour of methane production in the lower temperature regime also observed in Fig. 11 is again observed.
An important general observation is the large effect of reaction temperature on the selectivity of the reaction. Significant chain growth only occurs in the low temperature regime of the reaction under the first production peak maximum of methane formation. This is due to the higher activation energy barriers of methanation and chain-growth termination versus the other respective reaction activation energy barriers. With increasing temperature the difference between chain growth rate and rate of termination and methanation increases. This is completely in line with the microkinetics analysis we presented in section 2.
The onset of reaction is controlled by the increase in the rate of hydrogenation of the surface species. The plot of surface coverage versus temperature shown in Fig. 14 corresponding to the simulation of Fig. 11 shows this nicely.
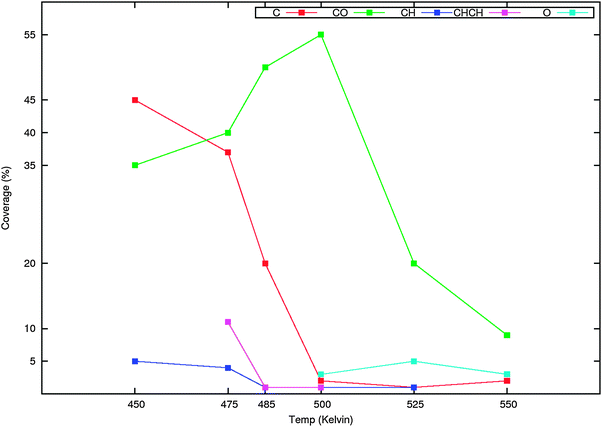 | ||
| Fig. 14 The changes in surface coverage as a function of temperature in the simulation of product formation presented in Fig. 11. | ||
At a temperature where there is not yet product formation, the main surface coverage is by Cads, also substantial CHads surface species are present. It implies that CO dissociation is occurring before gas phase product formation starts. The driving force for Cads formation is the removal of surface oxygen. Once gas phase product formation starts there is a drop in C1ads concentration and an increase in CO coverage. Longer hydrocarbons are formed because of the relative slow rate of the hydrocarbon chain growth termination. Adsorbed CO starts to appear because the rate of Oads removal competes with the rate of hydrocarbon removal and recombination of Cads and Oads is a rapid process. At the first minimum in methane production, CO coverage is maximum and C1ads coverage has become close to its minimum value. It indicates that another reaction step now has become rate controlling. Possibly CO adsorption now suppresses hydrogen adsorption, which will be reduced when at the higher temperatures CO starts to desorb. The third maximum in methane production of Fig. 11 occurs at low CO coverage. Then the apparent activation energy for CO dissociation has become negative and hence C1ads formation is very fast. In this temperature regime the high pre-exponents of the rates of the reactions that remove carbonaceous surface intermediates forming the surface will compensate for the slightly higher value of their respective activation rates. The surface rate processes now become rate controlling.
In Fig. 15a and b the molar rates of methane, ethylene and propylene production are shown for activation energies of CO dissociation of 60 and 70 kJ mol−1 respectively in the low temperature maximum chain growth regime.
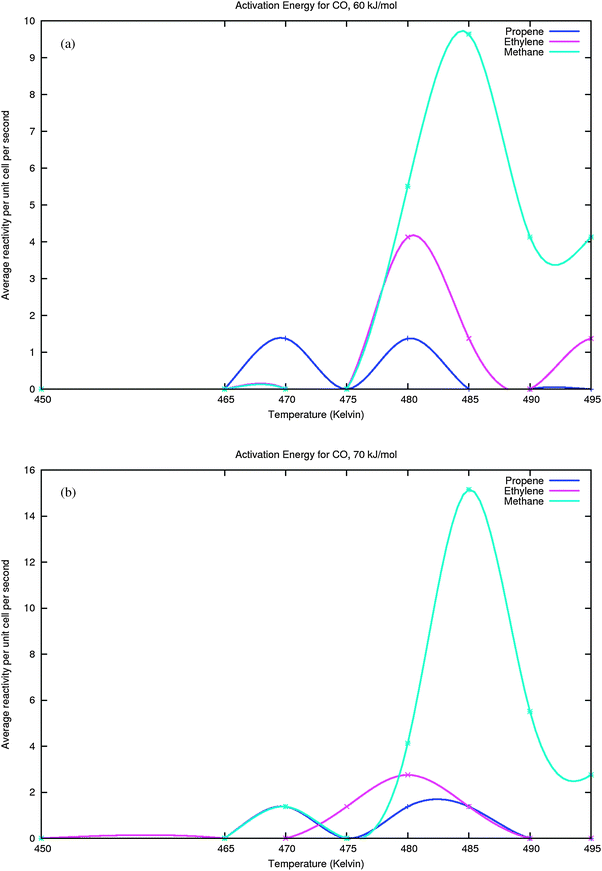 | ||
| Fig. 15 (a) Activation energy of CO dissociation is 60 kJ mol−1. (b) Activation energy of CO dissociation is 70 kJ mol−1. | ||
Fig. 15 Molar rates of methane, ethylene and propylene production as a function of temperature. Only low temperature data are collected. Same parameters have been used as for Fig. 11, except for CO dissociation and recombination.
Fig. 15a and b compare the rates of production of methane, ethylene and propylene as a function of activation energy of CO dissociation at 60 and 70 kJ mol−1. There are several interesting points to note.
First of all when integrated over the temperature interval there is an increase in overall methane production when the activation energies of CO dissociation and recombination increase. The maximum of the methane production rate maximum tends to shift to a higher temperature. Within the region of the first methane production maximum, overall methane production is substantially increased compared to formation of C2 and C3olefins. This agrees with the earlier analysis in section 2 that selectivity for C2+ formation should decrease when rate of methane formation increases compared to the rate of chain growth that has the lower activation energy barrier. In the current model no re-adsorption of product is included. This implies amongst others that H2O re-adsorption is ignored. At the higher temperatures oxygen removal will be enhanced and hence the competition of C1ads conversion towards formation of intermediate CHxads will become favored over Cads and Oads recombination. This may explain the overall increased methane production whereas the CO dissociation rate has slowed down.
A different way to analyse the results of Fig. 13 and 15 is to compare the molar production rates at the same temperature. We will do this at 480 K. When Edissact(CO) equals 50 kJ mol−1 at 480 K methane as well as ethylene and propylene show their production maxima. At 480 K comparison of methane production rates with increasing Edissact(CO) shows a decrease in methane production rates (respectively 8, 5.5 and 4 production units) as well as that of the C2 and C3olefins. As we will discuss at the end of the chapter, the overall rate of CO consumption is not controlled by the slowest reaction steps. In this case the overall consumption rate of CO is not controlled by the rates of hydrocarbon chain-growth termination, but by the rate of C1 formation and the consecutive rate of its incorporation into the growing adsorbed hydrocarbon chains. For instance, a slower rate of CO dissociation will lead to less chain growth when the rate of chain termination remains constant.
Interestingly the selectivities of product formation are nearly constant and independent of the activation energy of CO dissociation. We find C2/C1 = 0.75 and C3/C2 = 0.31. The independence of the selectivities of the activation energy of CO dissociation when compared for the same temperature agrees with our earlier conclusion that with our parameter choices for the activation energies of CO dissociation and CHads formation from Cads. CHads formation can be considered equilibrated with the rate of CO dissociation. The relative high production rate of ethylene is in agreement with the experimentally also exceptional behavior of ethylene production. A proper evaluation of the chain growth parameter requires a more extensive study of the Fischer–Tropsch selectivity towards formation of longer hydrocarbons than considered here.
One essential difference between the kinetics scheme on which the KMC simulations are based and the classical kinetic expressions as expressions (4) or (5) of section 2, is that the classical kinetic expressions assume non reversible chain growth. It is obvious from the reaction energy diagrams for ethylene or propylene formation (Fig. 9 and 10) that the elementary reaction of C–C bond formation has to be considered reversible.
There are some indications in the experimental literature of such reversibility.14
Within the same microkinetics approach as used in section 2, the corresponding expression for chain growth parameter αrev becomes:
 | (34a) |
 | (34b) |
 | (34c) |
The solution for αrev is:
 | (35) |
 is the forward rate of C–C bond formation,
  is the reverse rate of C–C bond cleavage.
When  expression (35) reduces to expression (5). A different simple expression (36) results when the rates of C–C bond formation and cleavage are fast compare to rt:
 | (36) |
Expression (35) can be solved once an expression for θ1 is available. In section 2 we discussed several approximations.
It is useful to remember that θ1 can also be deduced from the mass balance of the rate of C1 formation, i.e., the rate of CO consumption and the rate of carbon mass removal from the surface. The former is the right half of expression (37), the latter the left half of expression (37).
 | (37) |
As we mentioned before, it is interesting to realize that a change in the rate of chain termination rt will have little effect on the rate of CO consumption. Since mass balance is maintained with a decrease in rt the distribution of growing chains will shift to generation of longer hydrocarbon chains.
We are still far from a definitive understanding of the Fischer–Tropsch reaction. There are many additional pathways for hydrocarbon chain growth, than the single one studied here, that have to be explored. Extension of the simulations to a longer range of chain lengths and further exploration of the relation between variations in reaction energy diagram parameters is needed. We have discovered here the interesting effect of adsorbed O on the kinetics of hydrocarbon formation. This is consistent with importance of H2O partial pressure to overall kinetics of the Fischer–Tropsch reaction.53 Further theoretical studies on the role of adsorbed O are urgently needed.
6. Conclusion
In this paper we have presented an atomistic view of elementary reaction steps and related kinetics of short chain hydrocarbon formation in the Fischer–Tropsch reaction. The study is limited to primary hydrocarbon synthesis. The consequences of the carbide mechanism have been analyzed.Microkinetics considerations indicate that chain growth selectivity may be affected when the rate of CO dissociation or CHxads formation becomes slow compared to the rate of chain growth termination. Then a too low surface concentration of CHx intermediates retards formation of long hydrocarbon chains. It can even lead to anomalous chain growth behavior with a decrease of α with temperature.
Quantum chemical studies on Ru(11![[2 with combining macron]](https://www.rsc.org/images/entities/char_0032_0304.gif) 1) surface show that low activation energy CO dissociation at step edge type sites leads to CHx intermediates that give C–C coupling with low barriers. The studies of the Ru(11
1) surface show that low activation energy CO dissociation at step edge type sites leads to CHx intermediates that give C–C coupling with low barriers. The studies of the Ru(11![[2 with combining macron]](https://www.rsc.org/images/entities/char_0032_0304.gif) 1) surface lead to a mechanistic scheme in which CHCH3ads intermediates and their longer chain analogues form the growing adsorbed chain and chain growth proceeds via incorporation of CHads species. On the Ru(11
1) surface lead to a mechanistic scheme in which CHCH3ads intermediates and their longer chain analogues form the growing adsorbed chain and chain growth proceeds via incorporation of CHads species. On the Ru(11![[2 with combining macron]](https://www.rsc.org/images/entities/char_0032_0304.gif) 1) surface chain growing intermediates do not develop on the same site as where CO dissociation occurs. Microkinetics analysis indicate that such a dual site model increases the value of chain growth parameter α especially for high values of α.
1) surface chain growing intermediates do not develop on the same site as where CO dissociation occurs. Microkinetics analysis indicate that such a dual site model increases the value of chain growth parameter α especially for high values of α.
Kinetic Monte Carlo simulations using adapted versions of quantum-chemically calculated reaction energy diagrams indicate that Fischer–Tropsch catalysis occurs preferentially at the low temperature end of the temperature-activity regime. Then the concentration of CHxads species is a maximum.
The initial KMC simulations presented here consider only low activation energy barriers for CO dissociation. The product distributions indicate that C1ads formation is in equilibrium with CO dissociation.
The microkinetics analysis of the Fischer–Tropsch reaction presented in this paper leads to important conclusions with respect to the surface sensitivity and particle size dependence of this reaction. The high structure sensitivity of the CO dissociation energy plays an essential role.
Whereas also the energies of CO adsorption and C or O adsorption change, the changes of the activation energy of CO dissociation are substantially more significant. Since the activation free energies for chain growth termination are between 100 and 130 kJ mol−1, the activation energy of CO dissociation has to be substantially less. This implies that Fischer–Tropsch active sites with a high selectivity towards alkane or alkene formation will only occur on step–edge type sites as the B5 sites. Since such sites are not available on transition metal particles less than 6–10 nm, this would possibly explain experimental observations that Fischer–Tropsch activity decreases strongly with particle size in the nanometre regime.50 The increase in methane selectivity then occurs for the same reason. On a very small particle the activation energy for CO dissociation is high and chain growth is disfavored, because of the consequential low coverage with reactive CHx species. On dense surfaces without step–edge type sites the selectivity for methane formation is expected to be high. According to the view presented here this is not because the elementary rate constant of C–C bond formation is suppressed on such surfaces or due to an increase in rate of methanation from adsorbed C1 species, but due to the decreased rate of CO dissociation.
The KMC simulation model has to be extended to include the case of relatively high activation energies of CO dissociation to explicitly demonstrate this. The results presented here are also limited because the dual site model and long hydrocarbon chain growth has not been included.
The proposition that the decrease in activity of small metal particles is due to a higher coverage with adsorbed CO9 is consistent with the idea that CO dissociation is suppressed on the small particles.
Whereas the microkinetics analysis we provided in section 2 is general, the KMC simulations presented have to be considered as model simulations. Interesting is the observation of the more than one maximum that methane production shows as a function of temperature. At lower temperature the rate of methanation will be slow compared to CHx formation but at higher temperatures, because of the higher activation entropy, the rate of CO dissociation and CHx formation will start to compete with methanation. There is low C2+ production since the rate of hydrocarbon chain growth termination has increased considerably over that of C–C bond formation.
Transient kinetics will prove very different when B5 sites are present or absent. In agreement with this proposition on the larger particles the SSITKA experiments2,9 indicate a shorter residence time for CHx fragments and longer residence time of CO. The former is consistent with the faster rate of CO dissociation and the latter with the increased concentration of surface vacancies for CO to adsorb on the self-regenerating B5 reactive centers.
The dominant role of CO dissociation is consistent with the preference for Fe, Co and Ru as Fischer–Tropsch catalysts. They are the metals with the lower activation energies of CO. Because of their higher reactivity, the more reactive metals as Fe or Re become converted into the corresponding carbides. The carbided iron surface is also an excellent Fischer–Tropsch catalyst, because not only CO dissociation is still relatively rapid, but interaction with surface carbon is strong enough to lower the rate of methanation versus that of chain growth.62 In Fig. 16a the schematic dependence of the Fischer–Tropsch reaction selectivity on the interaction energy of carbonaceous intermediates (which also relates to the activation energy of CO) is shown.
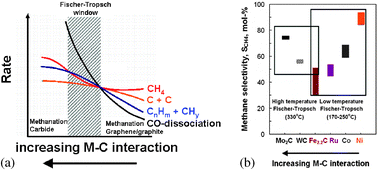 | ||
| Fig. 16 (a) Schematics of the changes in the reaction rates of key reaction steps as a function of Metal–Carbon interaction energies. (adapted from ref. 27). (b) Comparison of the experimental methane production rates as a function of catalyst material composition.71 | ||
Maximum chain growth probability occurs in a selectivity window of interaction energies. When the interaction energies are small the surface concentration of C1 species is low and hydrogenation and methanation will be fast. Hence methane or methanol is the dominant product. Because of the weak M–C interaction energy product formation will compete with deactivating graphene type carbon formation. When the M–C bond becomes stronger, the surface concentration of C1 species increases and chain growth becomes competitive. When on the other hand the M–C bond becomes too strong, C–C bond formation becomes disfavored over carbide formation or methanation.62 The experimental methane selectivities indicated in Fig. 16b are consistent with this interpretation of the Fischer–Tropsch reaction selectivity.
One should note that our results apply to Fischer–Tropsch kinetics aspects in the stage where no re-adsorption of olefins or diffusion aspects plays a role. The only mechanism for chain growth considered is through incorporation of “C1” species.
Whereas we did not discuss deactivating coke deposition, the quantum-chemical analysis of the dual site model solved the question why the B5 type step–edge sites essential for selective Fischer–Tropsch catalysis are not poisoned by carbon atoms generated at these sites. Coke formation is prevented by rapid hydrogenation of the C atoms to CH species that move to other positions of the reaction center. Deactivating coke formation occurs on a slower time-scale than the kinetic processes we considered here. Coke forming precursors can be formed at the step–edge sites72 as well as on the terraces.73,74
Carbon will be formed at a higher rate at the step edges. On the terraces the main dissociation path for carbon formation will be the hydrogen assisted CO dissociation path. Then competition between the rates of hydrogenation and C–C bond formation will determine the rate of most likely graphene type deactivating coke. Whereas at the step edges the concentration of Cads species will be higher, because of the stronger interaction with the surfaces will be slower than at the terraces. Experimental indications are that the coke formation is initiated at the step edges. This remains an important question for further investigation.
Acknowledgements
We thank Dr A. P. J. Jansen for useful help to this project regarding the KMC simulations.References
- Fischer–Tropsch Technology, ed. A. P. Steynberg and M. E. Dry, Elsevier, Amsterdam, 2004 Search PubMed.
- J. P. den Breejen, P. B. Radstake, G. L. Bezemer, J. H. Bitter, V. Frøseth, A. Holmen and K. P. de Jong, J. Am. Chem. Soc., 2009, 131, 7197–7203 CrossRef CAS.
- E. Iglesia, S. L. Soled and R. A. Fiato, J. Catal., 1992, 137, 212–224 CrossRef CAS.
- X.-Y. Quek, Y. Guan, W. G. M. Verhoeven, R. A. van Santen and E. J. M. Hensen, 2011.
- A. T. Bell, Catal. Rev., 1981, 23, 203–232 CAS.
- C. S. Kellner and A. T. Bell, J. Catal., 1981, 70, 418–432 CAS.
- H. A. J. van Dijk, Technische Universiteit Eindhoven, 2001.
- H. A. J. van Dijk, J. H. B. J. Hoebink and J. C. Schouten, Stud. Surf. Sci. Catal., 2000, 130, 383–388 CrossRef.
- J. Yang, E. Z. Tveten, D. Chen and A. Holmen, Langmuir, 2010, 26, 16558–16567 CrossRef CAS.
- H. Schulz, Appl. Catal., A, 1999, 186, 3–12 CrossRef CAS.
- J. A. Dumesic, R. D. F. and L. M. Aparicio, The microkinetics of heterogeneous catalysis, American Chemical Society, Washington, D.C., 1993 Search PubMed.
- R. J. Gelten, R. A. van Santen and A. P. J. Jansen, in Molecular Dynamics: From Classical to Quantum Methods, ed. P. B. Balbuena and J. M. Seminario, Elsevier Science, 1999 Search PubMed.
- P. Biloen and W. M. H. Sachtler, Adv. Catal., 1981, 30, 165–216 CAS.
- H. Schulz, Top. Catal., 2003, 26, 73–85 CrossRef CAS.
- H. Pichler and H. Schulz, Chem. Ing. Tech., 1970, 42, 1162–1174 CAS.
- H. Schulz, Stud. Surf. Sci. Catal., 2007, 163, 177 CrossRef CAS.
- B. E. Mann, M. L. Turner, R. Quyoum, N. Marsih and P. M. Maitlis, J. Am. Chem. Soc., 1999, 121, 6497–6498 CrossRef CAS.
- P. M. Maitlis and V. Zanotti, Catal. Lett., 2007, 122, 80–83.
- M. P. M., Q. R., L. H. C. and T. M. L., Appl. Catal., A, 1999, 186, 363–374 CrossRef.
- P. M. Maitlis and V. Zanotti, Chem. Commun., 2009, 1619–1634 RSC.
- H. Schulz, in Advances in Fischer–Tropsch Synthesis, Catalysts, and Catalysis (Chemical Industries), ed. B. H. Davis and M. L. Occelli, CRC Press, Taylor and Francis group, Boca Raton, 2009 Search PubMed.
- M. J. Overett, R. O. Hill and J. R. Moss, Coord. Chem. Rev., 2000, 206–207, 581–605 CrossRef CAS.
- J. Gaube and H. F. Klein, J. Mol. Catal. A: Chem., 2008, 283, 60–68 CrossRef CAS.
- F. Fischer and H. Tropsch, Brenstoff-Chem., 1926, 7, 97 Search PubMed.
- B. H. Davis, Fuel Process. Technol., 2001, 71, 157–166 CrossRef CAS.
- I. M. Ciobîcă, G. J. Kramer, Q. Ge, M. Neurock and R. A. van Santen, J. Catal., 2002, 212, 136–144 CrossRef CAS.
- R. A. van Santen, E. van Steen and I. Ciobica, Advances in Catalysis, Volume 54, Academic Press, New York Search PubMed, ISBN: 978-0-12-387772-7.
- J. Cheng, X.-Q. Gong, P. Hu, C. M. Lok, P. Ellis and S. French, J. Catal., 2008, 254, 285–295 CrossRef CAS.
- M. Zhuo, K. F. Tan, A. Borgna and M. Saeys, J. Phys. Chem. C, 2009, 113, 8357–8365 CrossRef CAS.
- Q. Ge and M. Neurock, J. Phys. Chem. B, 2006, 110, 15368–15380 CrossRef CAS.
- J. M. H. Lo and T. Ziegler, J. Phys. Chem. C, 2008, 112, 13681–13691 CrossRef CAS.
- Z.-P. Liu and P. Hu, J. Am. Chem. Soc., 2002, 124, 11568–11569 CrossRef CAS.
- J. Chen and Z.-P. Liu, J. Am. Chem. Soc., 2008, 130, 7929–7937 CrossRef CAS.
- S. Shetty, E. J. M. Hensen and R. A. van Santen, Chem. Commun., (under review) Search PubMed.
- A. P. Steynberg, J. A. van den Berge and W. J. van Rensburg, J. Phys.: Condens. Matter, 2008, 20, 064238 CrossRef.
- M. A. Petersen, J. A. van den Berge and W. J. van Rensburg, J. Phys. Chem. C, 2010, 114, 7863–7879 CrossRef CAS.
- M. Ojeda, R. Nabar, A. U. Nilekar, A. Ishikawa, M. Mavrikakis and E. Iglesia, J. Catal., 2010, 272, 287–297 CrossRef CAS.
- C.-F. Huo, Y.-. Wang Li, G. Wang and H. Jiao, J. Am. Chem. Soc., 2009, 131, 14713 CrossRef CAS.
- J. Wilson and C. de Groot, J. Phys. Chem., 1995, 99, 7860–7866 CrossRef CAS.
- G. A. Beitel, C. P. M. de Groot, H. Oosterbeek and J. H. Wilson, J. Phys. Chem. B, 1997, 101, 4035–4043 CrossRef CAS.
- J. J. C. Geerlings, M. C. Zonnevylle and C. P. M. de Groot, Surf. Sci., 1991, 241, 315–324 CrossRef.
- I. M. Ciobîcă and R. A. van Santen, J. Phys. Chem. B, 2003, 107, 3808–3812 CrossRef CAS.
- S. Shetty, A. P. J. Jansen and R. A. van Santen, J. Am. Chem. Soc., 2009, 131, 12874–12875 CrossRef CAS.
- Q. Ge, M. Neurock, H. A. Wright and N. Srinivasan, J. Phys. Chem. B, 2002, 106, 2826–2829 CrossRef CAS.
- S. Shetty, A. P. J. Jansen and R. A. van Santen, J. Phys. Chem. C, 2008, 112, 14027–14033 CrossRef CAS.
- G. Wulff, Z. Kryst. Mineral., 1901, 34 Search PubMed.
- W. L. Winterbottom, Acta Metall., 1967, 15, 303–310 CrossRef CAS.
- R. van Hardeveld and A. van Montfoort, Surf. Sci., 1966, 4, 396–430 CrossRef CAS.
- K. Honkala, A. Hellman, I. N. Remediakis, A. Logadottir, A. Carlsson, S. Dahl, C. H. Christensen and J. K. Nørskov, Science, 2005, 307, 555–558 CrossRef CAS.
- G. L. Bezemer, J. H. Bitter, H. P. C. E. Kuipers, H. Oosterbeek, J. E. Holewijn, X. Xu, F. Kapteijn, A. J. van Dillen and K. P. de Jong, J. Am. Chem. Soc., 2006, 128, 3956–3964 CrossRef CAS.
- A. M. Saib, A. Borgna, J. van de Loosdrecht, P. J. van Berge and J. W. Niemantsverdriet, J. Phys. Chem. B, 2006, 110, 8657–8664 CrossRef CAS.
- R. B. Anderson, The Fischer–Tropsch Synthesis, Academic Press, New York, 1984 Search PubMed, ISBN: 978-0-12-058460-4.
- M. Claeys and E. van Steen, Stud. Surf. Sci. Catal., 2004, 152, 601 CrossRef CAS.
- O. R. Inderwildi, S. J. Jenkins and D. A. King, J. Phys. Chem. C, 2008, 112, 1305–1307 CrossRef CAS.
- M. P. Anderson, F. Abild-Pedersen, I. N. Remedias, T. Bligaard, G. Jones, J. Engbaek, O. Lytken, S. Horch, J. H. Nielsen, J. Sehested, J. R. Rostrup-Neilsen, J. K. Norskov and I. Chorkendorff, J. Catal., 2008, 255, 6 CrossRef CAS.
- R. A. van Santen, Acc. Chem. Res., 2009, 42, 57–66 CrossRef CAS.
- I. M. Ciobîcă, F. Frechard, R. A. van Santen, A. W. Kleyn and J. Hafner, J. Phys. Chem. B, 2000, 104, 3364–3369 CrossRef CAS.
- I. M. Ciobîcă and R. A. van Santen, J. Phys. Chem. B, 2002, 106, 6200–6205 CrossRef CAS.
- S. Shetty, A. P. J. Jansen and R. A. van Santen, J. Phys. Chem. C, 2010, 114, 22630–22635 CrossRef CAS.
- B. S. Bunnik and G. J. Kramer, J. Catal., 2006, 242, 309–318 CrossRef CAS.
- B. S. Bunnik, G.-J. Kramer and R. A. van Santen, Top. Catal., 2010, 53, 403–416 CrossRef CAS.
- R. A. van Santen, M. Neurock and S. Shetty, Chem. Rev., 2010, 110, 2005–2048 CrossRef CAS.
- P. W. van Grootel, E. J. M. Hensen and R. A. van Santen, Surf. Sci., 2009, 603, 3275–3281 CrossRef CAS.
- X.-Q. Gong, P. Hu and R. Raval, J. Chem. Phys., 2003, 119, 6324 CrossRef CAS.
- X.-Q. Gong, R. Raval and P. Hu, J. Chem. Phys., 2005, 122, 024711 CrossRef.
- A. D. van Langeveld, A. de Koster and R. A. van Santen, Surf. Sci., 1990, 225, 143–150 CrossRef CAS.
- A. P. J. Jansen, in Computational Methods in Catalysis and Materials Science: An Introduction for Scientists and Engineers, ed. R. A. v. Santen and P. Sautet, WILEY-VCH Verlag GmbH & Co. KGaA, Weinheim, 2009 Search PubMed.
- K. Reuter, in Modeling Heterogeneous Catalytic Reactions: From the Molecular Process to the Technical System, ed. O. Deutschmann, Wiley-VCH, Weinberg, 2009 Search PubMed.
- K.-J. Westrate, Personal Communication, 2011.
- S. Storsaeter, D. Chen and A. Holmen, Surf. Sci., 2006, 600, 2051–2063 CrossRef CAS.
- E. van Steen, Private Communications.
- K. F. Tan, J. Xu, J. Chang, A. Borgna and M. Saeys, J. Catal., 2010, 274, 121–129 CrossRef.
- J. C. W. Swart, E. van Steen, I. M. Ciobîca and R. A. van Santen, Phys. Chem. Chem. Phys., 2009, 11, 803 RSC.
- J. C. W. Swart, I. M. Ciobîca, R. A. van Santen and E. van Steen, J. Phys. Chem. C, 2008, 112, 12899–12904 CrossRef CAS.
| This journal is © The Royal Society of Chemistry 2011 |


