Treating highly charged carbon and fullerene clusters as dielectric particles
Received
16th May 2011
, Accepted 13th July 2011
First published on 16th August 2011
Abstract
A model, recently developed for treating interactions between charged particles of dielectric materials (Bichoutskaia et al., J. Chem. Phys., 2010, 133, 024105), has been applied in an analysis of experimental data on the stability and fragmentation of highly charged carbon and fullerene clusters. Fragmentation data take the form of kinetic energy measurements that accompany the Coulomb fission of highly charged carbon clusters. For many of the examples chosen there is good agreement between the calculated and experimental results; however, the degree of uncertainty in some of the experimental data means that subtle features predicted by the model cannot be verified. When compared with an image charge model, treating carbon particles as a dielectric material reveals significant differences in the nature of the interaction potential.
1. Introduction
Fragmentation patterns associated with multiply charged clusters have been the subject of numerous experimental and theoretical studies during the past 30 years.1–9 For weakly bound collections of either atoms or molecules, attempts to observe the process of Coulomb fission in size-selected ions have met with variable success.3,10,11 In contrast, measurements on the energetics of Coulomb fission in systems with high binding energies, such as multiply charged fullerenes, have been very successful. Several groups have examined the stabilities and energetics of fragmentation of highly charged collections of fullerenes, (C60)z+n,12–14 and there have also been a number of measurements reported of the kinetic energy release that accompanies C+2 and C+4 loss from multiply charged fullerenes and carbon clusters in the range Cz+36–Cz+70 (z in these studies varies between 2 and 9).15–20 In order to analyze these data various models have been used, ranging from a simple liquid drop model that accounts for the stability of a cluster of a certain size within which z positive charges are confined,21 through to the calculation of fission barriers, where it is assumed that during fragmentation a point charge (C+2, for example) interacts with a charged sphere, for example C(z−1)+58, that has infinite conductance (an image charge model).16,22,23
What is still missing from many of the models currently being used to analyse data on Coulomb fission from both atomic and molecular clusters and from fullerenes is recognition of the fact that they are dealing with dielectric materials! However, image charge models that treat multiply charged fullerene anions as dielectric spheres have been used to analyse experimental data on electron detachment (see below).24,25 Very recently, Wu et al.11 used a dielectric liquid drop model to interpret data recorded following delayed Coulomb fission in (NH3)2+nclusters. The model accounted for the very asymmetric fragmentation pattern observed and for the magnitude of the centre-of-mass kinetic energy release induced in the fragments by the presence of a large (Coulombic) reverse activation barrier. At about the same time, Bichoutskaia et al.26 presented a new mathematical solution to the problem of calculating the electrostatic interaction between two charged dielectric spherical particles. The equations derived for this new treatment were shown to converge very rapidly and the solution is stable up to the point where the particles touch. A significant feature of this new solution is that it clearly demonstrates that the charge-induced interactions which exist between two like-charged particles of a dielectric material can be attractive, and that the degree of attraction is very sensitive to the magnitude of the dielectric constant. The results also show that an accurate account of the interaction requires a dynamical description of the surface charge on each particle.27 The solution is general and can be applied to charged particles ranging in size from small collections of atoms or molecules, through to nano- and micro-scale particles.26,27
There currently exists a wealth of experimental data on the fragmentation of highly charged fullerene and carbon clusters.12–20 This material has a comparatively low dielectric constant (somewhere in the range 3–5), and so the purpose of this publication is to show that a dielectric particle drop model as proposed by Bichoutskaia et al.26 can give an accurate account of the stability and fragmentation energetics of carbon clusters holding up to eight positive charges.
2. Theory
There are many examples in chemistry and physics where charged particles of dielectric materials interact with one another;28–30 however, it is only very recently that accurate analytical solutions have emerged to describe the electrostatic forces that exist between two such particles.26,31 The electrostatic force due to the presence of a permanent charge residing on the surface of each of two interacting spherical particles is given in ref. 26 as a generalization of Coulomb’s law for point charges, and has the following form:| |  | (1) |
where x1 and x2 are points on spheres 1 and 2, dQ1(x1) and dQ2(x2) are the electrical charges on each of the spheres, ẑ is a unit vector along the axis connecting the two spheres, h is their centre-to-centre separation and K = 1/4πε0 ≈ 9 × 10⁹ V mC−1 is a constant of proportionality. The first integral takes into account the charge residing on sphere 1, and the second integral is the potential generated by the charge residing on sphere 2. The last equality in eqn (1) is due to the cylindrical symmetry of the problem and requires that differentiation with respect to h is performed with the total surface charge density, σi, kept constant. The electrostatic force, F12, is evaluated by an expansion in Legendre polynomials of the electrical potential generated by the two spheres as they interact. Additional boundary conditions describe the behaviour of the electrical potential and its continuity on the surfaces of the spheres. The convention where F12 is negative for an attractive interaction and positive where the force is repulsive has been used. The permittivity of a sphere relative to that of vacuum is introduced as the dimensionless dielectric constant ki = εi/ε0, where ε0 = 8.8542 × 10⁻¹² F m−1. The dielectric material is assumed to be electrically neutral in its normal state with an unperturbed charge distribution and containing an equal number of positive and negative charges. The charge on each particle is assumed to be distributed uniformly over the surface, and no volume charge is present. Hence, the total surface charge density, σi, is related to the free and bound charge densities as σi = σf,i + σb,i. The net free charge, σf,i, on each particle is fixed, independent of the dielectric constant and does not vary with separation between the particles. The variation in electrostatic force acting on the system is the result of a polarisation of the bound charge density, σb,i, residing on the surface of one particle induced by an electric field due to the presence of charge on the second particle.
Once the magnitude of the charge on each sphere has been specified, the charge distribution can be computed as a function of the separation between spheres, h. The following analytical expression for the electrostatic force can then be obtained by integration of the charge distribution residing on the surfaces of the spheres:
| |  | (2) |
Complementary equations describing the multipole moments generated in each sphere have been presented:
26| |  | (3) |
for sphere 1, and
| |  | (4) |
for sphere 2. After eliminating
A2,l,
eqn (3) and (4) can be combined to yield the coefficients
A1,j1:
| | 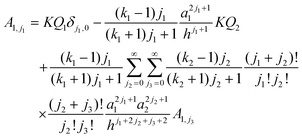 | (5) |
where
KQ1 = 4π
Ka21σf,1 and
KQ2 = 4π
Ka22σf,2. The relationship between the force,
F12, and the Coulomb interaction potential energy,
U, between the two charged spheres is given by:
| |  | (6) |
Equations for calculating
U have been given earlier;
26 however, a more efficient procedure for calculating both the electrostatic force and the potential energy, can be obtained by utilizing the matrix relationship in
eqn (5) to yield the coefficients
A1,l in terms of the radii of the spheres,
a1 and
a2, their separation,
h, their dielectric constants,
k1 and
k2, and their free charge densities,
σf,1 and
σf,2. The equations required to achieve such a solution are given in Appendix 1.
For the purposes of comparison with other models that have been used to treat the interaction between two charged particles, two limiting cases for U are considered. First, for the limit of two non-polarisable spheres or point charges the equations give:26
| |  | (7) |
which is the usual Coulomb relationship, and secondly, a point charge,
Q1, interacting with a polarisable sphere of radius
a2 and dielectric constant
k2:
26| |  | (8) |
For
m = 1 − 3, the leading three interactions derived from
eqn (8) vary as 1/
h4, 1/
h6 and 1/
h8, and these represent the ion-induced dipole, induced quadrupole and induced octupole polarisabilities that are the normal components of a multipole expansion of induced electrostatic interactions. Equivalent dependences on
h can be identified from relationships derived by Linse for the interaction between a point charge and a dielectric particle.
31 Likewise,
eqn (6) can be used to yield an expression from
eqn (8) for the force,
F12, between a point charge and a polarisable sphere and this is equivalent to that given very much earlier by Smythe.
32Eqn (8) is to be compared with
eqn (9), which represents an image charge model that is frequently used to analyse the interaction between a point charge and a conducting sphere. Here,
Q,
a,
k, and
h have the same definitions as before. For some calculations on charged
fullerenes,
k2 has been given a value of infinity.
16,22–25| |  | (9) |
The important distinction between
eqn (8) and (9) is that for the latter, the leading terms vary as 1/
h2 and 1/
h4,
i.e. there is a dipolar term that does not appear in the dielectric surface charge model,
eqn (8), and the image charge model also has a singularity at
h =
a2.
3. Results and discussion
The dielectric particle model has been used to undertake a systematic analysis of available experimental data on the stability and fragmentation of multiply charged fullerenes and clusters of carbon atoms. For a majority of the calculations a single set of parameters has been used to take into account variations in the sizes of the clusters. These parameters are:22 the radius of C+60 = 0.381 nm and the radii of C+2 and C+4 0.126 nm and 0.154 nm, respectively.22 A method for estimating the radii of other carbon clusters and fullerenes is discussed below. Since there is some uncertainty as to the exact value of the dielectric constant for C60,33,34 two values were explored: ki = 3 and 5; and these values have been adopted for all carbon clusters and fullerenes, irrespective of charge and/or size. One of a series of reactions that will be studied below involves the fragmentation of highly charged Cz+60, and this reaction in the form of:has been used to illustrate differences in the various models discussed above. Fig. 1 shows how the point charge – dielectric particle model behaves as a function of both particle separation, h, and the number of terms, m, included in the summation in eqn (8). At long range the interaction potential is dominated by the repulsive Coulomb term and it is only at very short interaction distances that the attractive second term in eqn (8) begins to take effect. However, because h is small the terms in h4, h6, h8 etc have a very significant influence on how the interaction behaves, and U finally converges to a strongly attractive interaction once m is ≥20. Of comparable significance for an over-the-barrier chemical process, such as (R1), is the observation that the additional terms in eqn (8) also contribute to a lowering of the reverse activation barrier. Fig. 2 shows results from the equivalent point charge – image charge model, but this time the dielectric constant, k2 has also been varied, with k2 = 3000 being taken as equivalent to a conducting particle. UIC is also strongly attractive at short range, but in this case it is due to the approaching singularity from the term  . Fig. 2 also shows that the magnitude of the dielectric constant has an influence both on the distance at which UIC starts to become attractive and on height of the reverse barrier.
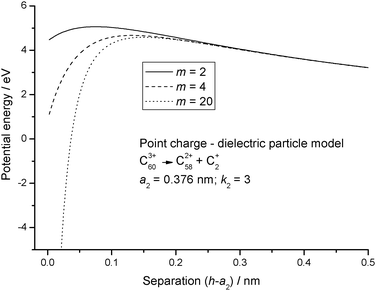 |
| | Fig. 1 Potential energy curves calculated for reaction step (R1) using eqn (8) for the point charge – dielectric particle model. Results are shown for an increasing number of terms in the summation. | |
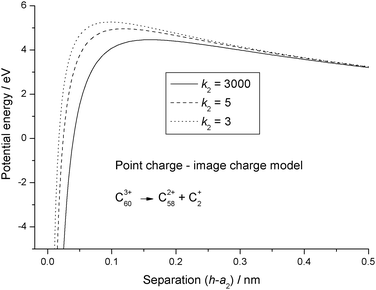 |
| | Fig. 2 Potential energy curves calculated for reaction step (R1) using eqn (9) for the point charge – image charge model. The results are for different values of the relative dielectric constant, k2. | |
Fig. 3 shows the consequences of using the full dielectric particle model, where C+2 has now been assigned a finite size and a range of values has been used for the dielectric constant. Although the potential energy curves still show a short range attraction between the particles, what is most significant is the fact that, even when the particles are touching, the potential energy is very much higher than any of the point charge results. Finally, Fig. 4 shows a comparison between the three most significant results taken from Fig. 1–3, and where a number of interesting observations can be made. First, the reverse barrier for the point charge – image charge model is almost 1 eV higher than for either of the dielectric particle models. Second, because the image charge model has no high order multipole terms, the onset of an attractive interaction is delayed for this particular example by more than 0.1 nm. Finally, as a result of treating each of the fragments as a dielectric particle, the nature of the interaction potential is markedly different from either of the other two results. However, for the latter the reverse barrier remains low because a mutual polarisation of the surface charge density on each of the particles leads to an attractive interaction at very short separation.27 Zettergren et al.22 also concluded that C+2 should not be treated as a point charge when calculating potential energy curves for the fragmentation of Cz+60 ions.
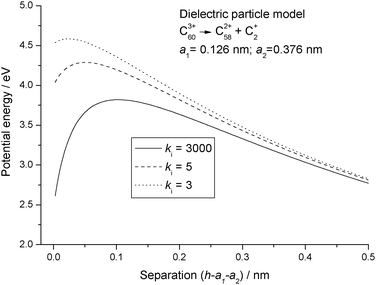 |
| | Fig. 3 Potential energy curves calculated for reaction step (R1) using the dielectric particle model with different values of the relative dielectric constant, ki. | |
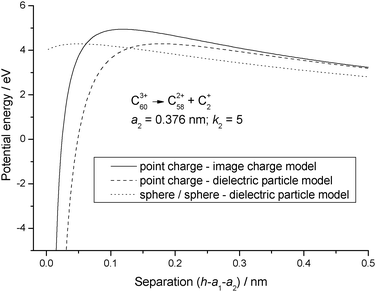 |
| | Fig. 4 Comparison between potential energy curves calculated for the image charge and dielectric particle models. | |
3.1 Stability of (C60)z+nclusters
Several experimental studies have investigated the stability of multiply charged clusters of the fullerene C60 in the form of (C60)z+n.12–14 These data have been the subject of an earlier theoretical analysis by Nakama and Hervieux21 using a contact sphere model to calculate an energy barrier for the loss of one or more charged fullerenes. Their model did take account of the dielectric nature of C60, but only in the context of a repulsive Coulomb contribution to the total energy of a charged cluster of C60 molecules. With a value of 3.45 for k1 and k2 these authors successfully reproduced the experimental data.13,14 Similarly, Zettergren et al.14 accounted for stable (C60)z+n structures by using a nearest-neighbour model that localised charge on individual C60 molecules in order to minimise Coulomb repulsion. In the calculations presented here, the stabilities of the clusters have also been determined from a model based on two spheres, but for one of them size has been calculated using a liquid drop approach, a2(n) = r0n1/3, where r0 is the radius of a single C60 molecule. Table 1 summarises the results of calculations to determine the stabilities of (C60)z+nclusters with respect to the loss of a single C+60. This pathway was identified as having the lowest energy barrier and for each value of z, n has been varied until the interaction between (C60)(z−1)+(n−1) + C+60 became attractive at short distances. This value of n was taken as the minimum stable size. Two values for the dielectric constant were investigated, ki = 3 and 5, and as can be seen from Table 1, the results are very sensitive to the value of ki and with a value of 5 it is possible to reproduce the experimental data quite accurately.
Table 1 Comparison between experimental data on the stability of (C60)z+n with respect to the process (C60)z+n → (C60)(z−1)+(n−1) + C+60 and results calculated from the dielectric particle model outlined in the text
|
z
|
Calculated minimum stable size (n) |
Expt.a |
Theoryb |
Theoryc |
|
k
i = 3 |
k
i = 5 |
k
i = 3.46 |
|
Experimental data taken from ref. 13 and 14.
Taken from ref. 21.
Taken from ref. 14.
|
| 2 |
8 |
6 |
5 |
7 |
5 |
| 3 |
18 |
11 |
10 |
13 |
10 |
| 4 |
33 |
20 |
21 |
23 |
23 |
| 5 |
50 |
33 |
33 |
31 |
— |
| 6 |
71 |
45 |
— |
35 |
— |
| 7 |
96 |
56 |
— |
38 |
— |
In a related series of calculations centre-of-mass kinetic energy releases have been calculated for three fragmentation steps:
| | | (C60)z+2 → C(z−1)60 + C+60 | (R2) |
| | | (C60)z+2 → C(z−2)60 + C2+60 | (R3) |
| | | (C60)z+2 → C(z−3)60 + C3+60 | (R4) |
It is assumed that fragmentation is an
over-the-barrier process and that kinetic energy is determined from a maximum in the potential energy barrier with respect to infinite separation of the fragments. The calculated results are shown in
Table 2 for
z ≤ 7 where they are compared with
experimental data taken from the work of Zettergren
et al.14 Kinetic energy releases have again been calculated for two values of
ki, and although the results are sensitive to the magnitude of the latter, far greater differences are to be seen from a comparison between the various reaction steps. Overall agreement with the experimental data is poor for
z ≤ 5, but is surprisingly good for reaction step
(R2) when
z is either 6 or 7. In their analysis of the experimental data, Zettergren
et al.14 assumed fragmentation involved a symmetric or near symmetric separation of charge on the grounds that for conducting spheres the charge is completely delocalised across the dimer. However, a much lower barrier and hence kinetic energy release is calculated for step
(R2) and this arises because the high charge density on the (
z − 1) fragment strongly polarises the C
+60 fragment. The strong attraction associated with this interaction between the two separating spheres reduces the magnitude of the outward reaction barrier. As a result, the onset of Coulomb repulsion is delayed to a larger fragment separation, and this leads to a reduced kinetic energy release. Zettergren
et al.14 have suggested that high levels of internal excitation in the reaction products might be responsible for the lack of agreement between the experimental data and their modelling of the results using image charge calculations.
Table 2 Comparison between experimental measurements of kinetic energy release from reactions (R2), (R3) and (R4) and results calculated from the dielectric particle model outlined in the text. All energies are in eV
|
z
|
Expt.a |
Calculated (ki = 5.0) |
Calculated (ki = 3.0) |
| (R2) |
(R3) |
(R4) |
(R2) |
|
Experimental data taken from ref. 14.
|
| 2 |
0.44 ± 0.02 |
1.60 |
— |
— |
1.68 |
| 3 |
1.1 ± 0.1 |
3.00 |
— |
— |
3.22 |
| 4 |
2.2 ± 0.2 |
4.08 |
6.46 |
— |
4.46 |
| 5 |
1.7 ± 0.3 |
5.02 |
9.60 |
— |
5.52 |
| 6 |
5.6 ± 0.7 |
5.89 |
12.00 |
14.49 |
6.50 |
| 7 |
7.9 ± 1.6 |
6.69 |
14.25 |
19.09 |
7.41 |
3.2 Fragmentation of Cz+nclusters and fullerenes
In an extensive series of experiments, Senn et al.16 have made measurements of the kinetic energy release that accompanies two fragmentation processes:| | | Cz+n → C(z−1)+(n−2) + C+2 | (R5) |
| | | Cz+n → C(z−1)+(n−4) +C+4 | (R6) |
Experimental results have been presented for n in the range 36–70 and for values of z between 3 and 6. Complementary data have been presented by Zettergren et al.20,22,35 for Cz+60 and Cz+70 undergoing the loss of C+2 with z up to 8. These latter results will be the subject of a separate analysis given below.
Again, it is assumed that fragmentation is an over-the-barrier process and no account is taken of a possible charge transfer step at or close to the top of the barrier. To account for a systematic variation in cluster radius, a(n), as a function of n, use has been made of a geometric relationship given by Voytekhousky.36 In this analysis of fullerene structures the radius of a fullerene containing ncarbon atoms is given by:
| | | a(n) = β(0.103374n − 0.4245845)1/2 | (10) |
Voltekhousky proposes that
β should have a value of 0.14 in order for
a(
n) to match the radius of C
60.
36 However, such a result does not agree with the radius adopted for the calculations above and so instead a value of 0.158 has been taken for
β and used across the range of
fullerenes studied here. In using
eqn (10) it is assumed that the larger of the two fragments in each of the steps above, C
(z−1)+(n−2) and C
(z−1)+(n−4), have
fullerene-like structures. In these calculations only
ki = 5 has been used.
Table 3 compares the calculated and experimental kinetic energy releases for reaction step
(R5) and
Fig. 5 shows a plot of the results as a function of
n. As can be seen, the model accurately predicts the decline in energy release as a function of increasing
fullerene size, and for
z equal to 3 and 4 the agreement between experiment and theory is very good across the entire data range. There is also reasonable agreement between the
z = 5
experimental data and the calculations. No experimental errors have been quoted by Senn
et al.16 Also given in
Fig. 5 are kinetic energy releases calculated using a point charge – image charge model as given by
eqn (9). The results were calculated with
z=4 and
k2=5, and as can be seen, the values across the range are approximately ∼1 eV above those calculated from the dielectric particle model, which is consistent with the potential energy curves plotted in
Fig. 4.
Table 4 and
Fig. 6 present results calculated for the loss of C
+4(R6) and this time it can be seen that the agreement between experiment and theory is excellent for
z = 3 and 4. In part the reason for this improved success when compared with C
+2 loss is that C
+4 is probably a better approximation to a polarisable sphere. In both examples, the decline in kinetic energy release as a function of increasing
n can be attributed to a gradual decline in surface charge density as the
fullerenes increase in size. Overall, the dielectric particle model can be expected to overestimate kinetic energy release data since an
over-the-barrier result makes no allowance for some of the excess energy appearing as vibrational excitation in the reaction products. The consequences of a subtle difference in size between C
+2 and C
+4 can be seen in
Fig. 7, where potential energy curves have been plotted for charged products as they begin to separate following the fragmentation of C
3+38 and C
3+68. The higher charge density on C
+2 leads to a more pronounced polarisation of charge on the larger of the two
fullerenes, C
3+68, with the result that the interaction remains attractive over a longer distance.
Table 3 Comparison between experimental measurements of kinetic energy release from the reaction (R5) and results calculated from the dielectric particle model outlined in the text. All energies are in eV
|
n
|
C3+n |
C4+n |
C5+n |
C6+n |
| Expt.a |
Theory |
Expt.a |
Theory |
Expt.a |
Theory |
Expt.a |
Theory |
|
Experimental data taken from ref. 16.
|
| 36 |
4.49 |
5.77 |
9.91 |
9.22 |
— |
— |
— |
— |
| 40 |
4.74 |
5.43 |
9.41 |
8.73 |
— |
— |
— |
— |
| 44 |
4.22 |
5.14 |
8.02 |
8.30 |
— |
— |
— |
— |
| 48 |
4.22 |
4.90 |
7.66 |
7.92 |
9.58 |
10.98 |
— |
— |
| 52 |
3.90 |
4.68 |
7.16 |
7.58 |
9.35 |
10.55 |
— |
— |
| 56 |
3.75 |
4.49 |
6.90 |
7.28 |
9.85 |
10.16 |
— |
— |
| 60 |
3.36 |
4.32 |
6.30 |
7.01 |
9.11 |
9.79 |
10.2 |
12.59 |
| 64 |
3.29 |
4.17 |
6.26 |
6.77 |
8.07 |
9.47 |
13.0 |
12.20 |
| 68 |
3.29 |
4.03 |
5.77 |
6.55 |
8.19 |
9.17 |
13.6 |
11.83 |
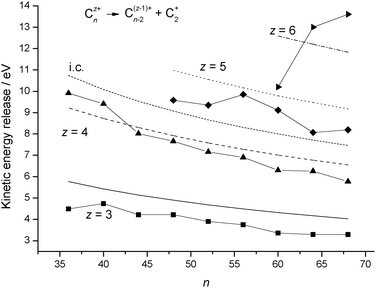 |
| | Fig. 5 Comparison between experimental kinetic energy release data for reaction step (R5)16 and results calculated from the dielectric particle model. The results are plotted as a function of cluster size, n, and for individual values of the charge, z. The experimental data are shown as discrete points and the continuous lines are calculated results. Marked as i.c. is the kinetic energy release calculated from a point charge – image charge model, eqn (9), with z = 4 and k2 = 5. | |
Table 4 Comparison between experimental measurements of kinetic energy release from the reaction (R6) and results calculated from the dielectric particle model outlined in the text. All energies are in eV
|
n
|
C3+n |
C4+n |
C5+n |
| Expt.a |
Theory |
Expt.a |
Theory |
Expt.a |
Theory |
|
Experimental data taken from ref. 16.
|
| 38 |
5.59 |
5.77 |
8.30 |
9.22 |
— |
— |
| 42 |
5.30 |
5.43 |
8.20 |
8.73 |
— |
— |
| 46 |
4.68 |
5.15 |
8.29 |
8.30 |
10.9 |
11.45 |
| 50 |
4.32 |
4.90 |
7.55 |
7.92 |
8.89 |
10.98 |
| 54 |
4.33 |
4.68 |
7.40 |
7.58 |
9.00 |
10.55 |
| 58 |
4.20 |
4.49 |
6.95 |
7.28 |
7.41 |
10.16 |
| 62 |
3.86 |
4.32 |
6.71 |
7.01 |
8.13 |
9.79 |
| 66 |
3.89 |
4.17 |
6.97 |
6.77 |
8.13 |
9.47 |
| 70 |
3.74 |
4.00 |
6.75 |
6.55 |
10.8 |
9.17 |
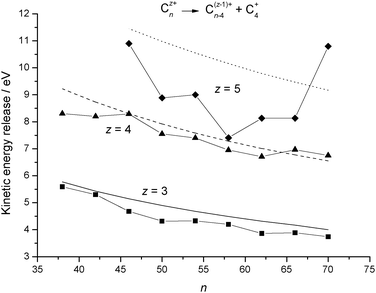 |
| | Fig. 6 Comparison between experimental kinetic energy release data for reaction step (R6)16 and results calculated from the dielectric particle model. The results are plotted as a function of cluster size, n, and for individual values of the charge, z. The experimental data are shown as discrete points and the continuous lines are calculated results. | |
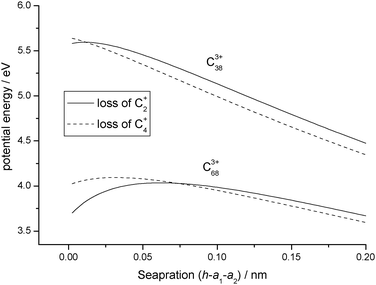 |
| | Fig. 7 Comparison between potential energy curves calculated for C3+38 and C3+68 undergoing either reaction step (R5) or (R6). | |
The final series of kinetic energy measurements to be examined are for Cz+60 and Cz+70 undergoing the loss of C+2 and combines the data taken from several experimental studies and where measurements have been made for z out to 8.15–20 These results are shown in Table 5 where it can be seen that, at each value of z, there is a very considerable spread in experimental results, however, for z ≤ 6, most of the calculated results do fall within the bands shown. When comparing calculations on Cz+60 and Cz+70 for a given value of z, the lower surface charge density on the latter leads to a reduction in kinetic energy release, and the difference should be of the order of 1 eV once z ≥ 6. Such a trend is exhibited in experimental data presented by Haag et al.20
Table 5 Comparison between experimental measurements of kinetic energy release from the reaction (R5) for n = 60 and 70 and results calculated from the dielectric particle model outlined in the text. All energies are in eV
|
z+
|
Cz+60 |
Cz+70 |
| Expt.a |
Theory |
Expt.b |
Theory |
|
Spread in experimental data taken from ref. 20 which presents a summary of results taken from ref. 15–19.
Taken from ref. 16 and in parenthesis from ref. 20.
|
| 3 |
2–4 |
4.32 |
3.25 |
3.97 |
| 4 |
3–6 |
7.01 |
6.12 (5) |
6.45 |
| 5 |
3–9 |
9.79 |
10.8 (6) |
9.02 |
| 6 |
7–11 |
12.59 |
12.3 (7) |
11.66 |
| 7 |
8–13 |
15.32 |
— (9) |
14.27 |
| 8 |
9–15 |
17.98 |
— (11) |
16.83 |
4. Conclusion
The results presented here show that by treating highly charged clusters of carbon and fullerenes as dielectric materials it is possible to reproduce a wide range of experimental results where chemical reactivity and fragmentation are influenced by the nature of the interaction potential. In terms of how charged particles interact with one another, the calculations also reveal significant differences between point charge – image charge models and the equivalent equations for a pair of dielectric particles.
Appendix 1
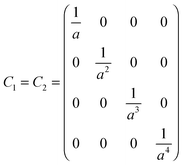
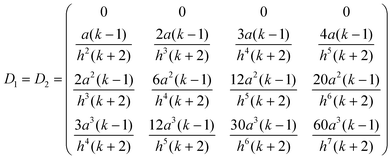
Eqn (3) and (4) can be written in matrix notation as:where
| |

| (A3) |
By choosing the sizes of the matrices as a cut-off for the evaluation of the electrostatic force, Gaussian elimination can be used to solve
eqn (A1) and (A2) for the coefficients
A1 and
A2. For example,
eqn (A2) can be rearranged to give
which can then be substituted into
eqn (A1) to give
| | | b1 = C1A1 + D1[C−12(b2 − D2A1)] | (A4) |
To obtain asymptotic values for the coefficients
A1,
eqn (A4) is first inverted
| A1 = [C1 − D1C−12D2]−1(b1 − D1C−12b2) |
and then rearranged to give
| A1 = [1 − C−11D1C−12D2]−1C−11(b1 − D1C−12b2) |
which is now in a form that can be expanded as [1−
U]
−1 = 1 +
U +
U2 +
U3 + ⋯ to give
| | | A1 = [1 + (C−11D1C−12D2) + (C−11D1C−12D2)2 + ⋯]C−11(b1 − D1C−12b2) | (A5) |
From
eqn (A5) the following perturbative terms can be defined:
| A(2)1 = +C−11(D1C−12)(D2C−11)b1 |
| | | A(3)1 = −C−11(D1C−12)(D2C−11)(D1C−12)b2; etc. | (A6) |
such that
A1 now reads as
| | | A1 = A(0)1 + A(1)1 + A(2)1 + A(3)1 + ⋯ | (A7) |
To achieve a precision of the order of
O(
h−N) it is necessary to use a
matrix of size (
N − 1)
2 in the evaluation of
A1. However, to achieve such precision, only the coefficients to an order of approximately
A(
N−2)/2 if
N is even and
A(
N−3)/2 if
N is odd are required.
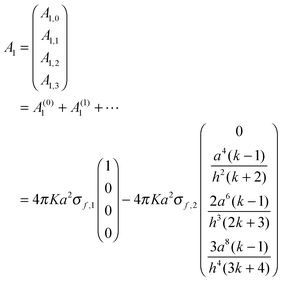
The following example helps to clarify this point regarding precision and also serves to illustrate the dependence between A1 and h, the separation between spheres. With coefficients of O(h−5) the electrostatic force is calculated to the same precision. For simplicity the spheres are assumed to have the same radius (a1=a2=a) and dielectric constant (k1=k2=k), but different free surface charge densities (σf,1 ≠ σf,2). Since the precision order is five, the size of the matrix needs to be (4 × 4) (l,m = 0,1,2,3). Hence
Substituting these terms into
eqn (A6) and keeping only terms of order (
h−4) gives
| | 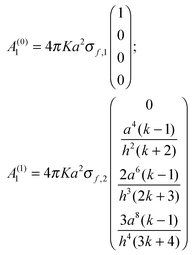 | (A8) |
Coefficients of higher order (
A(2)1,
A(3)1,…) contain terms of order
h−5 and above and so can be ignored. It then follows that:
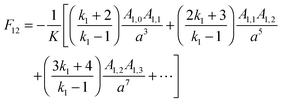
The electrostatic force between the two spheres can then be expressed as:
Taking into account the coefficients given in
eqn (A8) we have:
| |  | (A9) |
and since
Qi = 4π
a2σf,1a2,
eqn (A9) can be written in the more familiar form:
Higher levels of precision can be achieved by extending the procedure outlined above. For example, the force to
O(
h−15) can be expressed as follows:
where
| u1,2 = z2 + z8(14v21)+z10(54v1v2) + z12(66v22 + 88v1v3) + z14(104v41 + 260v2v3 + 130v1v4) |
| u1,1 = z5(2v1) + z7(3v2) + z9(4v3) + z11(20v31 + 5v4) + z13(126v21v2 + 6v5) + z15(315v1v22 + 224v21v3 + 7v6) |
and
Acknowledgements
EB gratefully acknowledges financial support from an EPSRC-GB Career Acceleration Fellowship (EP/G005060).
References
- U. Näher, S. Bjørnholm, S. Frauendorf, F. Garcias and C. Guet, Phys. Rep., 1997, 285, 245 CrossRef.
- R. Casero, J. J. Sáenz and J. M. Soler, Phys. Rev. A: At., Mol., Opt. Phys., 1988, 37, 1401 CrossRef CAS.
- O. Echt, D. Kreisle, E. Recknagel, J. J. Saenz, R. Casero and J. M. Soler, Phys. Rev. A: At., Mol., Opt. Phys., 1988, 38, 3236 CrossRef CAS.
- N. G. Gotts and A. J. Stace, Phys. Rev. Lett., 1991, 66, 21 CrossRef CAS.
- C. Bréchignac, Ph. Cahuzac, M. de Frutos, P. Garnier and N. Kebaili, Phys. Rev. B: Condens. Matter, 1996, 53, 1091 CrossRef.
- S. Krückeberg, G. Dietrich, K. Lüzenkirchen, L. Schweikhard and J. Ziegler, Phys. Rev. A: At., Mol., Opt. Phys., 1999, 60, 1251 CrossRef.
- I. Last, Y. Levy and J. Jortner, J. Chem. Phys., 2005, 123, 154301 CrossRef.
- I. Mähr, F. Zappa, S. Denifl, D. Kubala, O. Echt, T. D. Mark and P. Scheier, Phys. Rev. Lett., 2007, 98, 023401 CrossRef.
- M. Hoener, C. Bostedt, S. Schorb, H. Thomas, L. Foucar, O. Jagutzki, H. Schmidt-Böcking, R. Dörner and T. Möller, Phys. Rev. A: At., Mol., Opt. Phys., 2008, 78, 021201 CrossRef.
- D. Kreisle, K. Leiter, O. Echt and T. D. Märk, Z. Phys. D: At., Mol. Clusters, 1986, 3, 319 CrossRef CAS.
- G. Wu, X. Chen, A. J. Stace and P. Linse, J. Chem. Phys., 2011, 134, 031103 CrossRef.
- M. Hedén, K. Hansen and E. E. B. Campbell, Phys. Rev. A: At., Mol., Opt. Phys., 2005, 71, 055201 CrossRef.
- B. Manil, L. Maunoury, B. A. Huber, J. Jensen, H. T. Schmidt, H. Zettergren, H. Cederquist, S. Tomita and P. Hvelplund, Phys. Rev. Lett., 2003, 91, 215504 CrossRef CAS.
- H. Zettergren, H. T. Schmidt, P. Reinhed, H. Cederquist, J. Jensen, P. Hvelplund, S. Tomita, B. Manil, J. Rangama and B. A. Huber, J. Chem. Phys., 2007, 126, 224303 CrossRef.
- P. Scheier, B. Dünser and T. D. Märk, Phys. Rev. Lett., 1995, 74, 3368 CrossRef CAS.
- G. Senn, T. D. Märk and P. Scheier, J. Chem. Phys., 1998, 108, 990–1000 CrossRef CAS.
- L. Chen, J. Bernard, G. Berry, R. Brédy, J. Désesquelles and S. Martin, Phys. Scr., 2001, 92, 138 Search PubMed.
- S. Tomita, H. Lebius, A. Brenac, F. Chandezon and B. A. Huber, Phys. Rev. A: At., Mol., Opt. Phys., 2003, 67, 063204 CrossRef.
- J. Jensen, H. Zettergren, H. T. Schmidt, H. Cederquist, S. Tomita, S. B. Nielsen, J. Rangama, P. Hvelplund, B. Manil and B. A. Huber, Phys. Rev. A: At., Mol., Opt. Phys., 2004, 69, 053203 CrossRef.
- N. Haag, Z. Berényi, P. Reinhed, D. Fischer, M. Gudmundsson, H. A. B. Johansson, H. T. Schmidt, H. Cederquist and H. Zettergren, Phys. Rev. A: At., Mol., Opt. Phys., 2008, 78, 043201 CrossRef.
- M. Nakamura and P. Hervieux, Chem. Phys. Lett., 2006, 428, 138–142 CrossRef CAS.
- H. Zettergren, J. Jensen, H. T. Schmidt and H. Cederquist, Eur. Phys. J. D, 2004, 29, 63–68 CrossRef CAS.
- H. Zettergren, H. T. Schmidt, H. Cederquist, J. Jensen, S. Tomita, P. Hvelplund, H. Lebius and B. A. Huber, Phys. Rev. A: At., Mol., Opt. Phys., 2002, 66, 032710 CrossRef.
- C. Jin, R. L. Hettich, R. N. Compton, A. Tuinman, A. Derecskei-Kovacs, D. S. Marynick and B. I. Dunlap, Phys. Rev. Lett., 1994, 73, 2821–2824 CrossRef CAS.
- Q. Shi and S. Kais, Mol. Phys., 2002, 100, 475–481 CrossRef CAS.
- E. Bichoutskaia, A. L. Boatwright, A. Khachatourian and A. J. Stace, J. Chem. Phys., 2010, 133, 024105 CrossRef.
- A. J. Stace, A. L. Boatwright, A. Khachatourian and E. Bichoutskaia, J. Colloid Interface Sci., 2011, 354, 417–420 CrossRef CAS.
- H. T. Ochs III and R. R. Czys, Nature, 1987, 327, 606 CrossRef.
- A. A. Sickafoose, J. E. Colwell, M. Horányi and S. Robertson, Phys. Rev. Lett., 2000, 84, 6034 CrossRef CAS.
- J. Q. Feng, Phys. Rev. E: Stat. Phys., Plasmas, Fluids, Relat. Interdiscip. Top., 2000, 62, 2891 CrossRef CAS.
- P. Linse, J. Chem. Phys., 2008, 128, 21405 CrossRef.
-
W. R. Smythe, Static and Dynamic Electricity, McGraw-Hill, New York, 2nd edn, 1950 Search PubMed.
- R. Antoine, Ph. Dugourd, D. Rayane, E. Benichou, M. Broyer, F. Chandezon and C. Guet, J. Chem. Phys., 1999, 110, 9771 CrossRef CAS.
- A. F. Hebard, R. C. Haddon, R. M. Fleming and A. R. Kortan, Appl. Phys. Lett., 1991, 59, 2109–2111 CrossRef CAS.
- H. Cederquist, J. Jensen, H. T. Schmidt, H. Zettergren, S. Tomita, B. A. Huber and B. Manil, Phys. Rev. A: At., Mol., Opt. Phys., 2003, 67, 062719 CrossRef.
- Y. L. Voytekhovsky, Acta Crystallogr., Sect. A: Found. Crystallogr., 2003, 59, 193–194 CrossRef.
|
| This journal is © the Owner Societies 2011 |
Click here to see how this site uses Cookies. View our privacy policy here.  Open Access Article


 . Fig. 2 also shows that the magnitude of the dielectric constant has an influence both on the distance at which UIC starts to become attractive and on height of the reverse barrier.


