ZnO-based dye solar cell with pure ionic-liquid electrolyte and organic sensitizer: the relevance of the dye–oxide interaction in an ionic-liquid medium
E.
Guillén
a,
J.
Idígoras
a,
T.
Berger
a,
J. A.
Anta
*a,
C.
Fernández-Lorenzo
b,
R.
Alcántara
b,
J.
Navas
b and
J.
Martín-Calleja
b
aDepartamento de Sistemas Físicos, Químicos y Naturales, Universidad Pablo de Olavide, 41013 Sevilla, Spain. E-mail: anta@upo.es
bDepartamento de Química Física, Universidad de Cádiz, 11510, Cádiz, Spain
First published on 26th October 2010
Abstract
The use of non-volatile electrolytes and fully organic dyes are key issues in the development of stable dye-sensitized solar cells (DSCs). In this work we explore the performance of ZnO-based DSCs sensitized with an indoline derivative coded D149 in the presence of a pure ionic-liquid electrolyte. Commercial nanostructured zinc oxide and an electrolyte composed of iodine plus (1) pure 1-propyl-3-methyl imidazolium iodide (PMII) and (2) a blend of PMII with low-viscosity ionic liquids were employed to construct the devices. Without further additives, the fabricated devices exhibit remarkable short-circuit photocurrents and efficiencies under AM1.5 simulated sunlight (up to 10.6 mA cm−2, 2.9% efficiency, 1 sun, active area = 0.64 cm2) due to the high surface area of the ZnO film and the high absorptivity of the D149 dye. Impedance spectroscopy is used to characterize the devices. It is found that the addition of the low-viscosity ionic-liquid improves the transport features (leading to a better photocurrent) but it does not alter the recombination rate. The robustness of the dye–oxide interaction is tested by applying continuous illumination with a Xenon-lamp. It is observed that the photocurrent is reduced at a slow rate due to desorption of the D149 sensitizer in the presence of the ionic liquid. Exploration of alternative ionic-liquid compositions or modification of the ZnO surface is therefore required to make stable devices based on ZnO and fully organic dyes.
Introduction
Due to the promising potential of dye-sensitized solar cells (DSCs)1,2 as practical alternatives to conventional silicon-based solar cells, huge research efforts have been devoted in recent years to improve the efficiency of this type of cells and make them more competitive. Some of the more active current research is focused on the following fronts: (1) to increase the electron diffusion length by using photoanodes based on vertically aligned nanostructures,3–5 (2) to improve stability with the use of solvent-free hole conducting materials6–9 and (3) to replace the common dyes based on the precious metal ruthenium with fully organic sensitizers.With regard to point (1) above, zinc oxide is a popular alternative due to its suitability for easy fabrication of vertically aligned nanostructures with relative long electron diffusion lengths10–12 and exciting optical properties.13–15 In addition ZnO has a band gap and electron injection efficiency similar to that of TiO2,16,17 better transport properties18 and additional advantages like good performance with organic dyes.19–22 In connection with point (2) the use of Room Temperature Ionic Liquids (RTIL) is one of the most interesting choices to achieve stable devices6,23–26 due to their virtually zero vapour pressure.27 Ionic liquids have large ionic conductivities and are very versatile so that smart mixtures of RTIL can be explored to improve the photovoltage8 and the overall transport properties of the devices without losing the stability features.23,28,29 Finally, regarding point (3), new organic dyes have been successfully tested in DSCs.19,30–33 Among them, some of the most efficient ones are those based on indoline derivatives.33 These dyes have absorption coefficients several times higher than the common N719 dye at the maximum of the solar spectrum.22,34 Specifically, the indoline dye coded D149, with an absorption coefficient up to five times larger than the common N719 at the maximum of the solar spectrum, has been reported to show the highest efficiency for TiO2.35 Besides, the colour of the indoline dyes is tunable by changing their orbital system.36 These stimulating features encourage research on these dyes.
The combination of solvent-free DSCs with highly absorptive sensitizers is especially interesting since the poor transport properties and high recombination losses in RTIL-based devices24,37 produce short electron diffusion lengths and require very thin devices. However, in the case of ZnO-based devices, this possibility has not been explored yet. It must be born in mind that ZnO is chemically less stable than TiO2, especially in combination with acidic dyes.19,38,39
The purpose of this paper is to analyse the performance of the ZnO/indoline dye/ionic-liquid electrolyte combination to support further research on new ZnO-based nanostructures. To accomplish this we work with commercial nanoparticulate ZnO powder, which can be taken as a reference ZnO material. Thus, we can focus on the behaviour and stability of the ZnO–dye system, especially in the presence of an ionic liquid composed of a combination of imidazolium salts, commonly used in DSCs. The stability is a key issue in this context, since it may hinder the applicability of organic dyes in DSCs in combination with ZnO. It must be noted that in contrast to many other publications in this field the purpose of this work is not to optimize the cell configuration but to analyse carefully the chemical interactions between dye, oxide and electrolyte, and highlight the drawbacks.
Experimental
Commercial ZnO pastes were used to fabricate the semiconductor electrodes. The ZnO paste was prepared by mixing two commercial ZnO powders, Evonik VP AdNano@ZnO20 (approximate nanoparticle size of 20 nm) and PI-KEM (approximate nanoparticle size of 50 nm) in 1![[thin space (1/6-em)]](https://www.rsc.org/images/entities/char_2009.gif) ∶
∶![[thin space (1/6-em)]](https://www.rsc.org/images/entities/char_2009.gif) 1 proportion. The surface area of these powders after thermal activation (T = 150 °C) is 20 m2 g−1 and 12 m2 g−1, respectively, as determined by nitrogen physisorption at 77 K (Micromeritics, model ASAP2010). For thin film preparation the mixture was dispersed in water and ethanol (30
1 proportion. The surface area of these powders after thermal activation (T = 150 °C) is 20 m2 g−1 and 12 m2 g−1, respectively, as determined by nitrogen physisorption at 77 K (Micromeritics, model ASAP2010). For thin film preparation the mixture was dispersed in water and ethanol (30![[thin space (1/6-em)]](https://www.rsc.org/images/entities/char_2009.gif) ∶
∶![[thin space (1/6-em)]](https://www.rsc.org/images/entities/char_2009.gif) 70) and stirred overnight to obtain a colloidal suspension of 30 wt%. The suspension was spread onto a F-doped SnO2 transparent electrode (TCO15, Hartford Glass Company) with a glass rod using Scotch tape as spacer. The film was then heated at 420 °C for 30 minutes. The film thickness ranged between 7 and 8 μm after sintering (Fig. 1) as determined by Scanning Electron Microscopy (SEM-FEG Hitachi S480; acceleration voltage: 2 kV). The active area of the cells was 0.64 cm2.
70) and stirred overnight to obtain a colloidal suspension of 30 wt%. The suspension was spread onto a F-doped SnO2 transparent electrode (TCO15, Hartford Glass Company) with a glass rod using Scotch tape as spacer. The film was then heated at 420 °C for 30 minutes. The film thickness ranged between 7 and 8 μm after sintering (Fig. 1) as determined by Scanning Electron Microscopy (SEM-FEG Hitachi S480; acceleration voltage: 2 kV). The active area of the cells was 0.64 cm2.
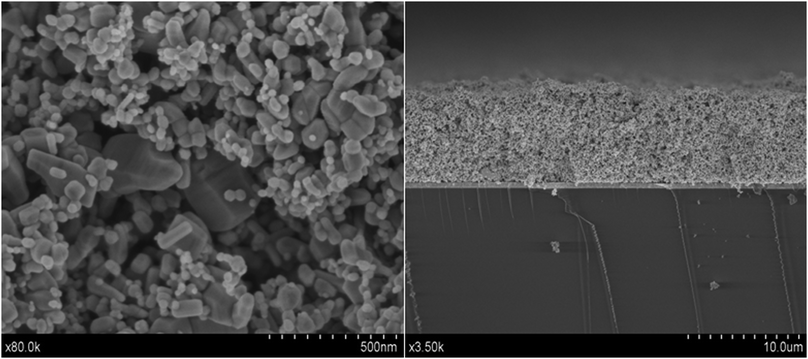 | ||
| Fig. 1 SEM images (front view and side view) of the mixture of the ZnO nanopowders utilized in this work. Scales are indicated on the micrographs. | ||
After cooling to 80 °C, sensitisation was performed by immersing the electrodes in a 0.5 mM solution of D149 (Mitsubishi Paper Mills Limited) and 0.7 mM of chenodeoxycholic acid for 30 minutes in tert-butyl alcohol–acetonitrile (1![[thin space (1/6-em)]](https://www.rsc.org/images/entities/char_2009.gif) ∶
∶![[thin space (1/6-em)]](https://www.rsc.org/images/entities/char_2009.gif) 1). The photoanode was then rinsed with the same solvents. The counter electrode was prepared by spreading a drop of hexachloroplatinic acid (0.01 M in isopropanol) on the conductive side of a TCO8 electrode (Hartford Glass) and subsequent annealing at 380 °C for 20 min. The two electrodes were clamped together to form a sandwich-type open cell.40
1). The photoanode was then rinsed with the same solvents. The counter electrode was prepared by spreading a drop of hexachloroplatinic acid (0.01 M in isopropanol) on the conductive side of a TCO8 electrode (Hartford Glass) and subsequent annealing at 380 °C for 20 min. The two electrodes were clamped together to form a sandwich-type open cell.40
Three electrolyte compositions were considered: (A) 0.05 mM I2 in pure 1-propyl-3-methyl-imidazolium iodide (PMII, Sigma-Aldrich), (B) 0.05 mM I2 in PMII plus 1-ethyl-3-methyl-imidazolium tetracyanoborate (EMIBCN) (2![[thin space (1/6-em)]](https://www.rsc.org/images/entities/char_2009.gif) ∶
∶![[thin space (1/6-em)]](https://www.rsc.org/images/entities/char_2009.gif) 3 volume fraction), and (C) 0.05 mM I2 in PMII plus 1-ethyl-3-methylimidazolium bis(trifluoromethylsulfonyl) imide (EMITFSA) (2
3 volume fraction), and (C) 0.05 mM I2 in PMII plus 1-ethyl-3-methylimidazolium bis(trifluoromethylsulfonyl) imide (EMITFSA) (2![[thin space (1/6-em)]](https://www.rsc.org/images/entities/char_2009.gif) ∶
∶![[thin space (1/6-em)]](https://www.rsc.org/images/entities/char_2009.gif) 1
1![[thin space (1/6-em)]](https://www.rsc.org/images/entities/char_2009.gif) ∶
∶![[thin space (1/6-em)]](https://www.rsc.org/images/entities/char_2009.gif) 1 volume fraction).
1 volume fraction).
The devices were characterized using a solar simulator with AM1.5G filter (ABET). A reference solar cell with temperature output (Oriel, 91150) was used for calibration. Additionally a 450 Xenon-lamp (ORIEL) with UV and IR cut-off filters was used for white light characterization and stability measurements. Photocurrents, photovoltages, current–voltage curves and impedance spectra were carried out by means of an Autolab/PGSTAT302N station (Ecochemie) coupled with a FRA2 frequency generator module. Impedance spectroscopy measurements were performed using a 10 mV perturbation in the 102–106 Hz range. Zview equivalent circuit modelling software was used to fit the data, including the distributed element DX11 (transmission line model).41 The absorption spectrum of the dye adsorbed on the oxide film was measured using an integrating sphere coupled to a UV/VIS detector (Ocean Optics).
To study the degradation of the cells in contact with D149, 50 μl of pure PMII was deposited on a sensitized film and left in contact overnight. The ionic liquid was then diluted in tert-butanol/ACN and an UV/VIS spectrum of the solution was recorded. On the other hand, the PMII pure spectrum diluted in the same proportion and in the same solvents was also recorded. Both measurements are shown in Fig. 2(c). The amount of dye adsorbed on the semiconductor film was evaluated from the absorbance of the solution after dye desorption in alkaline solution (1 mM KOH in ethanol/Milli-Q water (50![[thin space (1/6-em)]](https://www.rsc.org/images/entities/char_2009.gif) ∶
∶![[thin space (1/6-em)]](https://www.rsc.org/images/entities/char_2009.gif) 50) solution).
50) solution).
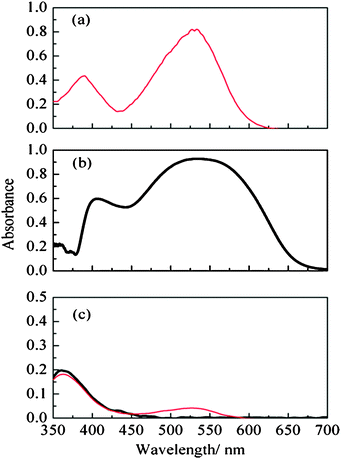 | ||
Fig. 2 (a) UV-Vis absorption spectra of D149 in solution (5.16 × 10⁻³ mM) in tert-butanol/acetonitrile, (b) D149 adsorbed on ZnO. (c) UV-Vis absorption spectra of PMII in tert-butanol/acetonitrile (1![[thin space (1/6-em)]](https://www.rsc.org/images/entities/char_2009.gif) ∶ ∶![[thin space (1/6-em)]](https://www.rsc.org/images/entities/char_2009.gif) 1) (thick line) and PMII diluted in tert-butanol/acetonitrile (1 1) (thick line) and PMII diluted in tert-butanol/acetonitrile (1![[thin space (1/6-em)]](https://www.rsc.org/images/entities/char_2009.gif) ∶ ∶![[thin space (1/6-em)]](https://www.rsc.org/images/entities/char_2009.gif) 1) after contact in the dark with a D149-sensitized ZnO film (thin line). In (b) the absorbance is defined as A = log(R0/R) where R and R0 are the reflectance of the sample and the reference respectively. 1) after contact in the dark with a D149-sensitized ZnO film (thin line). In (b) the absorbance is defined as A = log(R0/R) where R and R0 are the reflectance of the sample and the reference respectively. | ||
A Bruker IFS 66/S FTIR spectrometer was used to obtain IR spectra of the neat dye and the sensitized oxide particles in KBr. For this purpose 0.14 mg of neat dye were mixed with KBr and pressed into pellets. In the case of the adsorbed dye, part of the oxide film was detached mechanically from the conducting glass substrate after the sensitization step. 5 mg of the sensitized ZnO powder was then mixed with KBr and pressed. Spectra were obtained by averaging 100 scans at a resolution of 2.5 cm−1.
Results and discussion
In Fig. 1SEM images (both front and side view) of the ZnO substrate used in this work are presented. The micrographs show that the combination of the two types of ZnO powders provides a random mixture of big and small particles that lead to opaque films with a high surface area. On the other hand the film thickness is 7–8 μm. Dye desorption measurements provide dye-loading values ranging between 1.4 × 10⁻⁵ and 3 × 10⁻⁵ mmol cm−2.In Fig. 2, the UV-Vis absorption spectrum of the D149 dye is shown in three situations: in solution (a), adsorbed onto the ZnO film (b), and after desorption in the ionic-liquid medium used as electrolyte in the solar cell (c). In its isolated form, the dye exhibits strong absorption around 530 nm, close to the maximum irradiance of the solar spectrum.20 As reported previously,33 the spectrum gets broadened with respect to the free dye in solution, probably due to the interaction between the molecular orbitals of the dye molecules with the ZnO band structure.42 Since there is no appreciable shift of the spectrum maximum upon adsorption, dye aggregation34 is assumed to have only a minor effect in this case. This result is somehow expected since, as mentioned in the Experimental section, chenodeoxycholic acid is used as additive in the sensitizing solution to prevent dye aggregation.43 In Fig. 2(c), the UV-VIS spectrum of PMII after contact with a ZnO film sensitized with D149 and dissolved in tert-butanol/acetonitrile is presented. The presence of the characteristic absorption at 530 nm reveals that small amounts of dye get detached from the ZnO surface in the presence of PMII. The implications of this desorption in cell performance is discussed below.
The adsorption process of the D149 dye is analyzed in Fig. 3, where the short-circuit photocurrent for electrolyte composition A under white light illumination is plotted versus the immersion time of the ZnO film in the dye solution. In contrast to ruthenium-based dyes,19,44 no deterioration of the current at long immersion times is observed. This indicates that there are no undesirable chemical reactions45 between the dye and the oxide in this case. Based on this result a sensitizing time of 30 minutes was utilized for the cells fabricated and characterized in this work (as indicated in the Experimental section). In Fig. 4 the FT-IR spectra of the pure D149 dye is compared with that of dye-sensitized ZnO powder. Both spectra differ, upon dye adsorption, in the disappearance of two peaks at 1700 and 1750 cm−1 (attributed to carbonyl groups) and the appearance of a peak at 1600 cm−1 (corresponding to the COO asymmetric stretching). This observation is compatible to bidentate adsorption of the dye to the ZnO surface via the carboxylate group.46–48
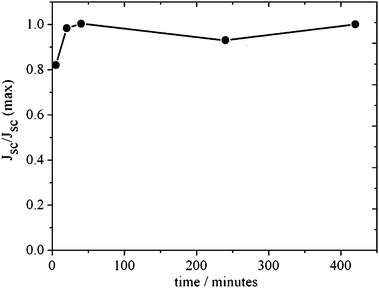 | ||
| Fig. 3 Short-circuit photocurrent as a function of immersion time for ZnO cells sensitized with D149 dye and electrolyte composition A under white light illumination (Xenon lamp with UV and IR filters). | ||
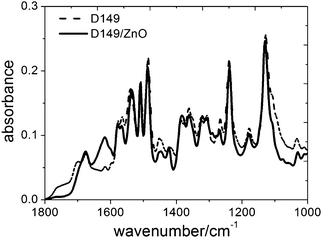 | ||
| Fig. 4 FT-IR spectra of pure D149 dye and D149 adsorbed onto ZnO. | ||
Photovoltaic parameters for the studied devices can be found in Table 1 and current–voltage curves of the solar cells with best performance are presented in Fig. 5. The good absorption properties of the dye together with the large surface area leads to short-circuit photocurrent between 7 and 10 mA cm−2 under simulated solar light conditions (AM1.5G, 1 sun), with best results obtained for the less viscous compositions B and C. Reproducibility of around ±1 mA cm−2 is achieved in all cases. In spite of the good performance at short circuit the constructed cells show open-circuit photovoltages of 480–520 mV and fill factors of around 0.55. This limits the photoconversion efficiency to 2–3% (2.9% for the best cell).
| Electrolyte | J SC/mA cm−2 | V OC/mV | FF | η (%) |
|---|---|---|---|---|
| A | 7.7 ± 0.5 | 489 ± 14 | 0.52 ± 0.04 | 2.0 ± 0.1 |
| B | 9.1 ± 0.9 | 505 ± 13 | 0.55 ± 0.05 | 2.5 ± 0.4 |
| C | 8.8 ± 1.4 | 507 ± 16 | 0.56 ± 0.04 | 2.5 ± 0.3 |
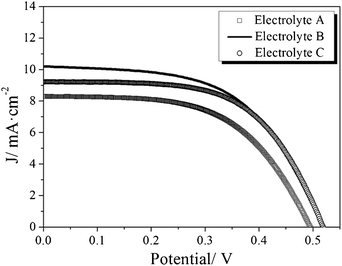 | ||
| Fig. 5 Best results for photocurrent–voltage curve of solvent-free ZnO solar cells sensitized with D149 under simulated solar light (AM1.5G) at 1 sun (100 mW cm−2), for the three electrolyte compositions considered in this work. | ||
The origin of the low photovoltage of the devices should be related to the composition of the electrolyte. Very low photovoltages have been reported before for DSCs with pure PMII in the electrolyte9,24 and D149-sensitized TiO2 cells with ionic liquid electrolyte.35 This is due to the high iodide concentration, which makes the redox potential of the iodide/tri-iodide couple too positive,8 to strong recombination24 and to the absence of species that produce negative band displacements of the semiconductor oxide.9 The mean value of the photovoltage is slightly improved for electrolytes B and C, and this is likely due to positive displacement of the redox potential of the iodide/tri-iodide redox couple when the concentration of iodide is reduced.8,9 According to Nernst equation the expected shift from reducing the concentration of iodide by a factor of 2/3 (electrolyte B) or 1/2 (electrolyte C) would be in the range of 5–9 mV for a two-electron redox reaction at room temperature. This calculated shift is quite close to the displacements actually observed for the photovoltage in the three electrolytes.
On the other hand, there is a clear correlation between the viscosity of the electrolyte and the photocurrent. The low JSC for electrolyte A is not due to high recombination, as it will be shown below, but to slow mass transport, which is characteristic in DSC with highly viscous ionic-liquid electrolytes.6,29 According to the literature,8,49 the viscosity of the ionic liquids used in this work lies between 1110 cP for pure PMII and 19.8 cP for EMIBCN at room temperature. There is also a well-known correlation between the viscosity of the solvent and the tri-iodide diffusion coefficient50 which explains the slow transport and the diffusion limitation occurring in the cells with the most viscous electrolyte, as reported previously.9 This result is confirmed below when the ion diffusion resistance is measured by impedance spectroscopy.
To analyse recombination we have performed Impedance Spectroscopy measurements of the fabricated cells in the dark at various applied voltages. Results can be found in Fig. 6–8. The spectra show the characteristic shape and evolution of DSCs based on ionic-liquid electrolytes,9,24 with three semicircles accounting for the TCO/ZnO and TCO/Pt/electrolyte interfaces (high frequencies), ZnO/electrolyte interface and electron diffusion (intermediate frequencies) and ionic diffusion (low frequencies and high voltages). To extract the recombination and transport behaviour we have fitted the spectra with the aid of the equivalent circuit of the transmission-line model41,51 (details can be found in ref. 9).
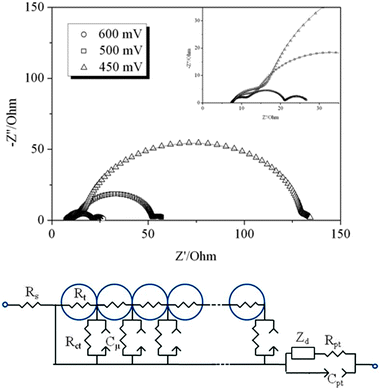 | ||
| Fig. 6 Impedance spectra of a ZnO dye solar cell sensitized with D149 and PMII electrolyte at different applied potentials in the dark. The dots represent the measured data points, and the straight lines are the fitting results based on the equivalent circuit model shown below. | ||
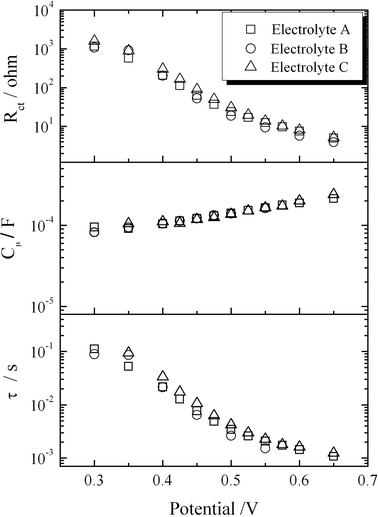 | ||
| Fig. 7 Results from impedance data in the dark: charge transfer resistance (a), chemical capacitance (b) and lifetime (c) for D149-sensitized ZnO solar cells as a function of applied voltage. | ||
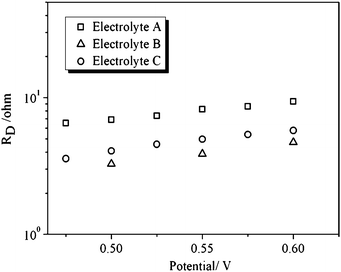 | ||
| Fig. 8 Ionic transport resistance (RD) as a function of applied voltage for the D149-sensitized ZnO solar cells studied in this work. | ||
Results for the charge-transfer resistance Rct and the chemical capacitance Cμ (assumed as the main contribution to the total capacitance in this case52) as a function of the applied bias are presented in Fig. 7. The charge transfer resistance exhibits approximate exponential behaviour within the studied range, with a slight change of slope as the potential is increased. A similar observation is reported for solvent-free TiO2 solar cells sensitized with N719 dye in ref. 24. The change of slope at high potentials is due to the effect of the series resistance of the cell, that becomes of the same order of magnitude than the charge transfer resistance. Correction for the potential drop produced by the series resistance of the cell, permits to refer the measured magnitudes to the real voltages applied in the film. However, in this case, in the vicinity of the open-circuit potential of the cell (0.5 V) the charge-transport resistance maintains the exponential behaviour, according to Rct = R0exp(−βV/kBT), with β being the transfer parameter. Fitting the experimental data to this theoretical expression yields values close to β = 0.5, for the three studied electrolyte compositions. Hence, a similar recombination behaviour is found for the three electrolytes.
The chemical capacitance Cμ shows also exponential behaviour except at low voltages. Here again there is a change in the slope as reported in ref. 24. Capacitance data can be fitted to an exponential function: Cμ = C0exp(αV/kBT) where α is the parameter that accounts for the depth of the trap energy distribution below the conduction band.52 The fit of the experimental data yields values close to α ≈ 0.1 for the three electrolytes. This suggests that the trap distribution is very deep in our case, probably due to a high-doping level of the ZnO substrate.5,53 The capacitance values are close to those reported in ref. 24 for PMII-based TiO2 solar cells sensitized with N719 dye.
The product of the charge-transfer resistance and the chemical capacitance yields the electron lifetime at each applied voltage: τn = RctCμ. Results are shown in Fig. 7. An approximate exponential behaviour is expected with a power exponent of γ = α − β, where β is the transfer coefficient, as discussed recently in ref. 54. In this case, a good fit is obtained at intermediate voltages with values close to γ = 0.4 for the three electrolytes. The value of the lifetime in the vicinity of the open-circuit potential is 0.005 seconds for the best cell constructed. This value is similar to the lifetimes measured at similar applied biases in N719-based ZnO cells with ionic liquid electrolyte,9N719-based TiO224 and much shorter than the lifetime observed in DSCs with organic solvent electrolytes.55 This observation strongly suggests that the performance of these devices is limited by large recombination through the oxide/electrolyte interface. On the other hand the recombination parameters obtained from the fitting to the equivalent circuit are basically the same for the three electrolytes studied. This indicates that there are no specific interactions between the constituent ions of the three electrolytes and the oxide and that the electrolyte composition does not affect the recombination rate. This is in contrast to other ionic liquids such as 1-methyl-3-methyl-imidazolium dicyanamide, which produces a negative displacement of the ZnO band edge and modifies the oxide chemical capacitance, as shown in previous work by some of the authors.9 The fact that the different electrolyte compositions do not modify the recombination rate explains why the open-circuit photovoltage varies only by a few millivolts (due to the small redox potential shift, as discussed above).
Impedance spectroscopy provides also information about charge transport in the solar cell device. In Fig. 8 results for the ionic transport resistance (RD) are presented for the three electrolyte compositions. The ionic transport resistance is related to the Warburg diffusion impedance ZD that appears as a single semicircle at low frequencies (ZD = RD tanh(jω/ωD)/(jω/ωD)).24 As expected, results for the RD of the most viscous composition (electrolyte A) tend to be larger than for electrolyte B and C. As regards electron transport, it has to be noted that the diffusion Warburg feature that commonly appears in many TiO2 solar cells as a 45°-slope straight line at high frequencies is not clearly seen in this case, hence complicating the fitting. This is evidenced by the fact that RT, although following an approximate exponential behaviour with respect to applied bias (results not shown), it does not yield the theoretical slope of 26 mV characteristic of the multiple-trapping model.51 This fact is attributed to the rapid electronic transport that is characteristic of ZnO materials. Further work should be attempted to try to clarify why many ZnO substrates tend to depart from the behaviour found in standard TiO2 dye solar cells.
“Solvent-free” DSCs are interesting because they do not present evaporation losses and they are good candidates for fabricating stable devices. In Fig. 9 the result of a stability test for a test device with electrolyte composition A and no sealing under continuous light soaking with a Xenon lamp coupled to UV and IR filters is presented. It must be noted that this illumination set-up presents a higher intensity in the spectral zone where the dye absorbs and it is used here to test the cell at more extreme conditions. At short times the photocurrent increases steadily due to the heating of the device, which reduces the viscosity of the electrolyte.24 Diffusion limitations have been shown before to influence the maximum photocurrent achievable by DSCs with ionic-liquid electrolytes.6,9 However, after this initial stage, the short-circuit photocurrent diminished in a 6% in three hours of exposition to white light. Stability tests with the solar simulator (AM1.5, 100 mW cm−2) exhibit a much slower degradation.
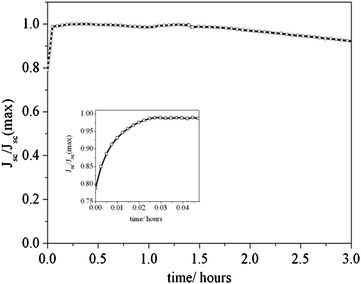 | ||
| Fig. 9 Photocurrent evolution of a D149-sensitized ZnO solar cell with electrolyte composition A and no sealing under continuous light soaking illumination using a Xenon lamp with UV and IR filters. The inset shows the behaviour at short times. | ||
To establish the origin of this degradation mechanism the presence of D149 in the electrolyte has been analyzed. As discussed above, the presence of the characteristic absorption at 530 nm in the solution obtained after contact with the PMII electrolyte (Fig. 2c) reveals that small amounts of dye get detached from the ZnO surface in the presence of PMII. This dye desorption is probably the reason for the deterioration of the photocurrent indicated above. Degradation mechanisms that are a consequence of dye desorption have been reported before for indoline dyes.36
It is illustrating to note that in a previous publication using the N719 sensitizer9 a different low-viscosity ionic-liquid (1-methyl-3-ethylimidazolium dicyanamide) was employed to reduce the iodide concentration and improve the transport properties and the photovoltage. This ionic liquid was found to reduce the recombination rate, due to band displacement. This observation was attributed to adsorption of the dicyanamide anion to the ZnO surface. However, when the same ionic liquid is employed in combination with the D149 sensitizer, complete desorption of the dye is observed. A similar outcome is found when using the common additive tert-butylpyridine. This indicates that species that tend to attach strongly to the oxide surface and that are helpful to reduce recombination and improve performance, may become troublesome in combination with weak dye–oxide interactions, as it seems to be the case. Further work on this line is currently being done in our group.
Conclusions
We have fabricated and characterized Dye-sensitized Solar Cells based on nanoparticulate ZnO films sensitized with the indoline dye coded D149 and with pure ionic-liquid electrolyte (non-volatile). The good absorption properties of the dye together with the large surface area of the mixture of commercial powders used leads to short-circuit photocurrent between 7 and 10 mA cm−2 under AM1.5G (1 sun) conditions, with best results obtained for the less viscous ionic-liquid compositions. The maximum energy conversion efficiency achieved was 2.9% at 1 sun.The devices yield open-circuit photovoltages of 480–520 mV, which is much lower than best-performing cells based on organic solvent electrolytes. Impedance data show that there exists a high recombination rate in this case, similar to other devices based on pure ionic liquid electrolytes, and much larger than those characteristic of organic solvent electrolytes. The addition of an ionic liquid of lower viscosity is found to improve the transport properties, but it does not alter the recombination rate. Imidazolium salts typically used in DSCs are found to induce desorption of the indoline dye from the ZnO surface, hence limiting the long-term stability. Exploration of alternative ionic-liquid electrolyte compositions or modification of the ZnO surface is, therefore, required for fabricating stable devices based on ZnO films sensitized with organic dyes.
Acknowledgements
We thank the Ministerio de Educación y Ciencia of Spain for project HOPE CSD2007-00007 (Consolider-Ingenio 2010) and a FPU studentship, and Junta de Andalucía under projects P07-FQM-02595, P07-FQM-02600, and P09-FQM-04938. V. Morales-Flórez, J. C. Millán Renquel and M. C. Jiménez de Haro have to be acknowledged for the nitrogen physisorption experiments and scanning electron microscopy performed at the Instituto de Ciencia de los Materiales de Sevilla, CSIC-US (Spain).References
- B. O'Regan and M. Gratzel, Nature, 1991, 353, 737–740 CrossRef CAS.
- M. Gratzel, Nature, 2003, 421, 586–587 CrossRef.
- X. Feng, K. Shankar, O. K. Varghese, M. Paulose, T. J. Latempa and C. A. Grimes, Nano Lett., 2008, 8, 3781–3786 CrossRef CAS.
- B. Liu and E. S. Aydil, J. Am. Chem. Soc., 2009, 131, 3985–3990 CrossRef CAS.
- A. B. F. Martinson, M. S. Góes, F. Fabregat-Santiago, J. Bisquert, M. J. Pellin and J. T. Hupp, J. Phys. Chem. A, 2009, 113, 4015–4021 CrossRef CAS.
- W. Kubo, S. Kambe, S. Nakade, T. Kitamura, K. Hanabusa, Y. Wada and S. Yanagida, J. Phys. Chem. B, 2003, 107, 4374–4381 CrossRef CAS.
- R. Kawano, H. Matsui, C. Matsuyama, A. Sato, M. Susan, N. Tanabe and M. Watanabe, J. Photochem. Photobiol., A, 2004, 164, 87–92 CrossRef CAS.
- D. B. Kuang, C. Klein, Z. P. Zhang, S. Ito, J. E. Moser, S. M. Zakeeruddin and M. Gratzel, Small, 2007, 3, 2094–2102 CrossRef CAS.
- E. Guillén, C. Fernández-Lorenzo, R. Alcántara, J. Martín-Calleja and J. Anta, Sol. Energy Mater. Sol. Cells, 2009, 93, 1846–1852 CrossRef.
- E. Galoppini, J. Rochford, H. H. Chen, G. Saraf, Y. C. Lu, A. Hagfeldt and G. Boschloo, J. Phys. Chem. B, 2006, 110, 16159–16161 CrossRef CAS.
- K. S. Leschkies, R. Divakar, J. Basu, E. Enache-Pommer, J. E. Boercker, C. B. Carter, U. R. Kortshagen, D. J. Norris and E. S. Aydil, Nano Lett., 2007, 7, 1793–1798 CrossRef CAS.
- I. Mora-Sero, F. Fabregat-Santiago, B. Denier, J. Bisquert, R. Tena-Zaera, J. Elias and C. Levy-Clement, Appl. Phys. Lett., 2006, 89, 203117–203120 CrossRef.
- H. Cheng, W. Chiu, C. Lee, S. Tsai and W. Hsieh, J. Phys. Chem. C, 2008, 112, 16359–16364 CAS.
- J. Elias, R. Tena-Zaera and C. Levy-Clement, J. Phys. Chem. C, 2008, 112, 5736–5741 CAS.
- C. Klingshirn, ChemPhysChem, 2007, 8, 782–803 CrossRef CAS.
- M. Quintana, T. Edvinsson, A. Hagfeldt and G. Boschloo, J. Phys. Chem. C, 2007, 111, 1035–1041 CAS.
- K. Keis, E. Magnusson, H. Lindstrom, S. E. Lindquist and A. Hagfeldt, Sol. Energy Mater. Sol. Cells, 2002, 73, 51–58 CrossRef.
- R. Konenkamp, K. Boedecker, M. C. Lux-Steiner, M. Poschenrieder, F. Zenia, C. Levy-Clement and S. Wagner, Appl. Phys. Lett., 2000, 77, 2575–2577 CrossRef CAS.
- E. Guillen, F. Casanueva, J. A. Anta, A. Vega-Poot, G. Oskam, R. Alcantara, C. Fernandez-Lorenzo and J. Martin-Calleja, J. Photochem. Photobiol., A, 2008, 200, 364–370 CrossRef CAS.
- T. Yoshida, J. Zhang, D. Komatsu, S. Sawatani, H. Minoura, T. Pauporte, D. Lincot, T. Oekermann, D. Schlettwein, H. Tada, D. Wohrle, K. Funabiki, M. Matsui, H. Miura and H. Yanagi, Adv. Funct. Mater., 2009, 19, 17–43 CrossRef CAS.
- T. Yoshida, K. Terada, D. Schlettwein, T. Oekermann, T. Sugiura and H. Minoura, Adv. Mater., 2000, 12, 1214–1217 CrossRef CAS.
- W. Chiu, C. Lee, H. Cheng, H. Lin, S. Liao, J. Wu and W. Hsieh, Energy Environ. Sci., 2009, 2, 694–698 CAS.
- Y. M. Cao, J. Zhang, Y. Bai, R. Z. Li, S. M. Zakeeruddin, M. Gratzel and P. Wang, J. Phys. Chem. C, 2008, 112, 13775–13781 CAS.
- F. Fabregat-Santiago, J. Bisquert, E. Palomares, L. Otero, D. B. Kuang, S. M. Zakeeruddin and M. Gratzel, J. Phys. Chem. C, 2007, 111, 6550–6560 CAS.
- N. Yamanaka, R. Kawano, W. Kubo, N. Masaki, T. Kitamura, Y. Wada, M. Watanabe and S. Yanagida, J. Phys. Chem. B, 2007, 111, 4763–4769 CrossRef CAS.
- P. Wang, S. M. Zakeeruddin, J. E. Moser, R. Humphry-Baker and M. Gratzel, J. Am. Chem. Soc., 2004, 126, 7164–7165 CrossRef CAS.
- T. Welton, Chem. Rev., 1999, 99, 2071–2083 CrossRef CAS.
- Y. Bai, Y. M. Cao, J. Zhang, M. Wang, R. Z. Li, P. Wang, S. M. Zakeeruddin and M. Gratzel, Nat. Mater., 2008, 7, 626–630 CrossRef CAS.
- P. Wachter, M. Zistler, C. Schreiner, M. Berginc, U. O. Krasovec, D. Gerhard, P. Wasserscheid, A. Hinsch and H. J. Gores, J. Photochem. Photobiol., A, 2008, 197, 25–33 CrossRef CAS.
- W. M. Campbell, K. W. Jolley, P. Wagner, K. Wagner, P. J. Walsh, K. C. Gordon, L. Schmidt-Mende, M. K. Nazeeruddin, Q. Wang, M. Gratzel and D. L. Officer, J. Phys. Chem. C, 2007, 111, 11760–11762 CAS.
- R. Caballero, E. M. Barea, F. Fabregat-Santiago, P. de la Cruz, L. Marquez, F. Langa and J. Bisquert, J. Phys. Chem. C, 2008, 112, 18623–18627 CAS.
- P. Chen, J. Yum, F. De Angelis, E. Mosconi, S. Fantacci, S. Moon, R. Baker, J. Ko, M. Nazeeruddin and M. Gratzel, Nano Lett., 2009, 9, 2487–2492 CrossRef CAS.
- T. Horiuchi, H. Miura, K. Sumioka and S. Uchida, J. Am. Chem. Soc., 2004, 126, 12218–12219 CrossRef CAS.
- R. Jose, A. Kumar, V. Thavasi and S. Ramakrishna, Nanotechnology, 2008, 19, 424004 CrossRef CAS.
- S. Ito, S. Zakeeruddin, R. Humphry-Baker, P. Liska, R. Charvet, P. Comte, M. Nazeeruddin, P. Pechy, M. Takata, H. Miura, S. Uchida and M. Gratzel, Adv. Mater., 2006, 18, 1202–1205 CrossRef CAS.
- H. Tanaka, A. Takeichi, K. Higuchi, T. Motohiro, M. Takata, N. Hirota, J. Nakajima and T. Toyoda, Sol. Energy Mater. Sol. Cells, 2009, 93, 1143–1148 CrossRef CAS.
- D. Shi, Y. M. Cao, N. Pootrakulchote, Z. H. Yi, M. F. Xu, S. M. Zakeeruddin, M. Graetzel and P. Wang, J. Phys. Chem. C, 2008, 112, 17478–17485 CAS.
- K. Keis, J. Lindgren, S. E. Lindquist and A. Hagfeldt, Langmuir, 2000, 16, 4688–4694 CrossRef CAS.
- L. Ke, S. B. Dolmanan, L. Shen, P. K. Pallathadk, Z. Zhang, D. M. Ying Lai and H. Liu, Sol. Energy Mater. Sol. Cells, 2010, 94, 323–326 CrossRef CAS.
- E. Hosono, Y. Mitsui and H. Zhou, Dalton Trans., 2008, 5439–5441 RSC.
- J. Bisquert, J. Phys. Chem. B, 2002, 106, 325–333 CrossRef CAS.
- K. Hara, T. Horiguchi, T. Kinoshita, K. Sayama, H. Sugihara and H. Arakawa, Sol. Energy Mater. Sol. Cells, 2000, 64, 115–134 CrossRef CAS.
- S. Ito, H. Miura, S. Uchida, M. Takata, K. Sumioka, P. Liska, P. Comte, P. Pechy and M. Graetzel, Chem. Commun., 2008, 5194–5196 RSC.
- K. Keis, C. Bauer, G. Boschloo, A. Hagfeldt, K. Westermark, H. Rensmo and H. Siegbahn, J. Photochem. Photobiol., A, 2002, 148, 57–64 CrossRef CAS.
- T. P. Chou, Q. F. Zhang and G. Z. Cao, J. Phys. Chem. C, 2007, 111, 18804–18811 CAS.
- T. Dentani, Y. Kubota, K. Funabiki, J. Jin, T. Yoshida, H. Minoura, H. Miura and M. Matsui, New J. Chem., 2009, 33, 93–101 RSC.
- P. Qin, X. Yang, R. Chen, L. Sun, T. Marinado, T. Edvinsson, G. Boschloo and A. Hagfeldt, J. Phys. Chem. C, 2007, 111, 1853–1860 CAS.
- G. Chen, K. Zheng, X. Mo, D. Sun, Q. Meng and G. Chen, Mater. Lett., 2010, 64, 1336–1339 CrossRef CAS.
- J. G. Huddleston, A. E. Visser, W. M. Reichert, H. D. Willauer, G. A. Broker and R. D. Rogers, Green Chem., 2001, 3, 156–164 RSC.
- P. Wachter, C. Schreiner, M. Zistler, D. Gerhard, P. Wasserscheid and H. J. Gores, Microchim. Acta, 2008, 160, 125–133 CrossRef CAS.
- F. Fabregat-Santiago, J. Bisquert, G. Garcia-Belmonte, G. Boschloo and A. Hagfeldt, Sol. Energy Mater. Sol. Cells, 2005, 87, 117–131 CrossRef CAS.
- J. Bisquert, Phys. Chem. Chem. Phys., 2003, 5, 5360–5364 RSC.
- C. He, Z. Zheng, H. Tang, L. Zhao and F. Lu, J. Phys. Chem. C, 2009, 113, 10322–10325 CAS.
- J. Bisquert, F. Fabregat-Santiago, I. Mora-Seró, G. Garcia-Belmonte and S. Giménez, J. Phys. Chem. C, 2009, 113, 17278–17290 CAS.
- M. Wang, P. Chen, R. Humphry-Baker, S. Zakeeruddin and M. Gratzel, ChemPhysChem, 2009, 10, 290–299 CrossRef CAS.
| This journal is © the Owner Societies 2011 |
