Replication NAND gate with light as input and output†
Manickasundaram
Samiappan
,
Zehavit
Dadon
and
Gonen
Ashkenasy
*
Department of Chemistry, Ben Gurion University of the Negev, Beer Sheva 84105, Israel. E-mail: gonenash@bgu.ac.il; Fax: +972 8-6472943; Tel: +972 8-6461637
First published on 11th November 2010
Abstract
Logic operations can highlight information transfer within complex molecular networks. We describe here the design of a peptide-based replication system that can be detected by following its fluorescence quenching. This process is used to negate the signal of light-activated replication, and thus to prepare the first replication NAND gate.
The Boolean logic offers simple and concise ways to analyze the output of processes that depend on more than one factor. Accordingly, the design and synthesis of chemical logic gates have been developed rapidly during the past decade, and many examples were performed, using different kinds of organic, inorganic, and bio-organic molecules.1–7 Our group, as well as others, studied the formation of logic operations within networks of replicating molecules.8–11 Such processes can highlight the information transfer within the networks and serve as a means for building more complex functions.10 The replication logic gates thus gained interest with respect to possible scenarios in the early molecular evolution and as models for the functionality of cellular networks. We report here on a novel experimental not–AND gate, NAND, within a small replication network. The design of this gate makes use of UV light as one of the inputs, and its output is read by following the changes in fluorescence at the visible light spectrum.
We have recently suggested that all the two-input logic gates can be performed within ternary replication networks, using for example peptides or DNA as inputs and outputs.9 While conceptually correct, the formation of some of these gates by using only chemical inputs was found to be experimentally difficult. In particular, the postulated chemically-triggered replication NAND gate that is shown in Fig. 1a9 was found to be one of the most difficult, since it required high sequence specificity to differentiate between competing pathways. Since the NAND gate12,13 is central for future development of higher level computation, because combinations of NAND gates can be used to accomplish all the basic functions, we were looking for alternative designs. Towards this end, we sought to exploit an AND gate, and to negate its signals by an inverter function (Fig. 1b), specifically by following the decrease of a dye fluorescence signal—due to Förster resonance energy transfer (FRET) from donor to acceptor—as an indication of productive replication (Fig. 1c).
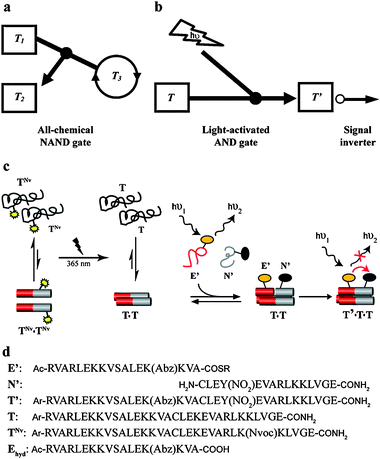 | ||
| Fig. 1 (a) Chemical NAND gate simulated to operate within a ternary replication network. In this example the NAND logic controls replication of the peptide T3, using T1 and E2, the starting material that produces T2, as inputs. The two inputs serve as ‘observers’ when each is introduced alone, while introduction of both diverts the network towards production of T2 and dismisses the replication of T3.9 (b) NAND gate based on light-induced replication AND operation, for which the output response to each inputs combination is inverted to produce the NAND. (c) Coiled coil replication NAND gate, based on the general configuration shown in (b), see text for detailed explanation of the design and characterization. (d) Names and sequences of peptides used in this study. Abz = 2-amino benzoic acid, Y(NO2) = 3-nitrotyrosine, Nvoc = 6-nitroveratryloxycarbonyl, Ar = 4-acetamido benzoic acid (ABA), Ac = acetyl, R = CH2–CH2–NH–CO–CH3. | ||
FRET experiments are frequently used to follow chemical or biochemical processes, but have rarely14 been practiced for monitoring the progress of self-replication, due primarily to the fact that attaching dyes to relatively small molecules can dramatically affect their structure and template reactivity. Accordingly, DNA and peptide replication experiments were followed ex situ by HPLC after quenching aliquots from the experiment solution,15–17 and replication of small organic molecules was followed mainly by NMR.18,19
We exploit here the coiled coil based replication system,8,16,20–23 which is to date the only peptide-based platform that provides ‘residue to residue’ recognition that can facilitate the sequence selectivity required for achieving the complex logic operations. To follow the replication by light we attached a FRET couple made of small fluorophores to electrophilic (E′) and nucleophilic (N′) peptide fragments, amino-benzoic acid (Abz) and nitro-tyrosine (Y(NO2)) as donor and acceptor, respectively24 (see sequences in Fig. 1d). As we show below, this allowed fast in situ tracking of the replication processes, obtaining results that are more accurate than before in terms of reproducibility in repeating experiments, and even some direct insight into the replication mechanism.
Each of the FRET moieties was attached at a solvent exposed position (f position along the helix heptad), in order to minimize the effect on the coiled coil structure. Additionally, attachment of both moieties near the prospected ligation site was chosen in order to induce close proximity after the formation of the ligation product (T′), i.e. the replicating molecule. We have calculated the separation between the donor and acceptor to be about 12 Å, much shorter than the ∼3 nm Förster radius of this couple,24 allowing efficient energy transfer.
The syntheses of all peptides required for the replication experiments (Fig. 1d) were carried out on solid phase, using the Fmoc based chemistry (see ESI† for details). A Boc-protected Abz group was attached to the ε-amine of Fmoc–Lys in solution, and the product was used for the solid phase synthesis of E′ and Ehydhyd, while the Fmoc-protected nitro-tyrosine was purchased and used as is for making N′. The template peptides (T and TNvNv) were synthesized by coupling the corresponding electrophilic and nucleophilic fragments by native chemical ligation.17 The identity and purity of all the peptides were analyzed by HPLC and MS, as shown in the experimental section (ESI†).
The rate of formation of T′ in mixtures containing E′ and N′, 100 μM each, in a buffer at pH 7.2, was followed by monitoring the quenching of the fluorescence intensity at 340–500 nm, over 12 hours (Fig. 2a). When the same experiment was carried out in the presence of a 22 μM premade template T, identical to the ligation product T′ but without the fluorophores, faster product formation was observed, featuring the enhanced ‘quasi self-replication’ (Fig. 2b). The same experiment was repeated with different amounts of seeded T (see spectra in Fig. S2 panels a–c; ESI†). The 420 nm fluorescence quenching (F0 − F) at each time point could be translated linearly to changes in product concentrations, using the asymptotic value for the quenching at complete conversion, and the result showed consistent increase in replication rates with increasing amounts of T (Fig. 2c). The results in Fig. 2c show the average product concentration and estimated errors for two repeating experiments, revealing significantly better reproducibility than was observed in our replication systems when followed by HPLC.17
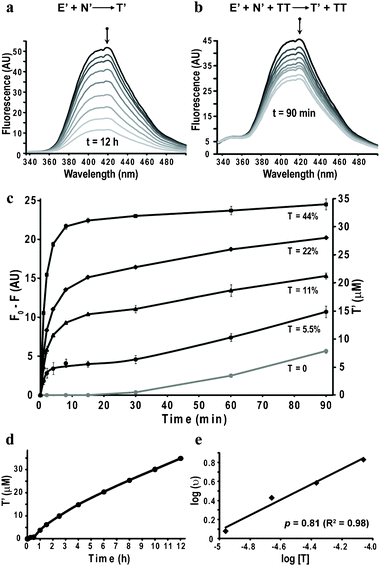 | ||
| Fig. 2 Monitoring peptide self-replication by FRET. (a) Fluorescence spectra obtained at different times (0, 1, 1.5, 2.5, 4, 6, 8, 10 and 12 h; spectra obtained at time < 1 h were not included for clarity) for reaction mixtures containing E′ and N′ (100 μM each). (b) Fluorescence spectra obtained at different times (0, 1, 2, 4, 8, 15, 30, 60 and 90 min) for reaction mixtures containing E′, N′ (100 μM each) and T (22 μM). (c) Kinetics of fluorescence quenching (F0 − F; 420 nm) and product formation (right Y axis) over 1.5 h for replication reactions seeded with different amounts of T, derived from the results shown in panel (b) and panels a–c in Fig. S2 (ESI†). The designated mole percentage next to each curve marks the concentration of T·T relative to E′ and N′. The kinetic profile of the background reaction, derived from the data in panel (a), is shown in gray for comparison. (d) Product formation over 12 h in the background reaction (panel a), showing the expected self-replication kinetics. (e) Logarithmic plot of the initial rate vs. initial seeded concentration of T, allowing us to calculate the replication order p = 0.8. | ||
The direct observation of replication of T′ was evidenced by analyzing the 12 hours data in Fig. 2a (Fig. 2c, gray trace, and Fig. 2d), showing a lag phase in product formation of about 0.5 h, followed by fast replication in the presence of the newly formed product/template, and then again slow replication rate when the product inhibition and reduction in starting materials become more pronounced. The rate of this background reaction in the new system was found to be about 2 times slower than in similar systems,17 due probably to the attachment of the relatively bulky dyes. This result practically allows larger differentiation between background and templated reactions.
Additional information about the replication mechanism was obtained by calculating the replication order (p), from the conventional logarithmic plot,25 showing p = 0.8 (Fig. 2e), which is similar or even slightly higher relative to similar systems studied before, and can be accounted to the slower background reaction rate or to a lower product inhibition. Interestingly, in a control experiment done with the hydrolyzed version of the electrophile (Ehydhyd) that can self-assemble on the template but is non-reactive, no quenching was observed (Fig. S2d, ESI†), allowing for the first time direct evidence of the short life time of the intermediate complex (E′N′TT; Fig. 1c). Thus, these data allow to conclude, as was postulated before, that the rate limiting step is the formation of the E′N′TT complex and usually not the ligation chemical reaction.
In order to construct the replication NAND gate, we have coupled the FRET system with a light-induced replication protocol (Fig. 1c). The NAND gate's output is “1” when neither or either of the inputs is present, and “0” when both of the inputs are present. The two following inputs were chosen: (i) a caged template molecule (TNvNv, Fig. 1d) having the photo-cleavable moiety 6-nitroveratryloxycarbonyl (Nvoc) attached at a Lys residue crucial for inter-helix recognition, and (ii) UV light at 365 nm. Introduction of TNvNv alone, in the dark, is not expected to enhance the ligation, since it interferes with the formation of tertiary structures, thus reducing significantly the concentrations of dimeric template and quaternary intermediate complexes (Fig. 1c). Upon shining light for a short time and removal of the Nvoc group, a new peptide (T) is formed, which can fold and aggregate correctly and thus enhance the replication.26
The NAND logic behavior of this system is shown in Fig. 3. The ligation experiment was studied four times, in the absence or presence of TNvNv, and in the dark or after shining light for 15 minutes (365 nm; 8 W cm−2). The donor fluorescence signal (420 nm), observed 60 minutes after initiating the reaction, was utilized as a negating signal of the product formation. Very little product formation, correlated with less than 7% signal quenching, was observed for the template free reactions in the dark (input 0,0) or after shining light (0,1), and thus interpreted as an “1” output. A slightly lower signal (17% quenching) was observed for the reaction in the presence of TNvNv in the dark (input 1,0), still regarded as a “1”, while a much lower signal (50% quenching), reflecting a “0” output, was obtained when the latter reaction was carried out after shining light (input 1,1).
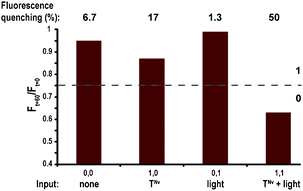 | ||
| Fig. 3 Fluorescence data of the replication NAND gate. The reaction mixture made of E′ and N′ (100 μM each), and carried out with four different combinations of TNvNv and UV light as inputs, was monitored after 60 minutes. The percentage of quenched signal due to FRET is emphasized above each column. | ||
We have described in this communication the first peptide-based replication system that can be both activated by shining light and followed by fluorescence measurements. Since replication processes are used to wire arrays of molecules within replication networks,27–29 we suggest that this methodology should be valuable for future in situ control and analysis of network behavior.30 The light energy that flows in-and-out can change the reactivity of specific pathways at will, and also reports on structural and dynamic changes associated with specific molecule(s), in response to environmental changes and/or interactions with other molecules.
This research is supported by a grant from the Israeli Science Foundation (ISF 1291/08). We thank E. Y. Safranchik for helping in early stages of the project, Drs E. Nir and N. Wagner for fruitful discussions, and Dr R. Cohen-Luria for help in the lab.
Notes and references
- A. P. de Silva and S. Uchiyama, Nat. Nanotechnol., 2007, 2, 399–410 CrossRef CAS.
- A. Credi, Angew. Chem., Int. Ed., 2007, 46, 5472–5475 CrossRef CAS.
- G. Seelig, D. Soloveichik, D. Y. Zhang and E. Winfree, Science, 2006, 314, 1585–1588 CrossRef CAS.
- T. Gupta and M. E. van der Boom, Angew. Chem., Int. Ed., 2008, 47, 5322–5326 CrossRef CAS.
- M. N. Stojanovic, Prog. Nucleic Acid Res. Mol. Biol., 2008, 82, 199–217 Search PubMed.
- I. Willner, B. Shlyahovsky, M. Zayats and B. Willner, Chem. Soc. Rev., 2008, 37, 1153–1165 RSC.
- E. Katz and V. Privman, Chem. Soc. Rev., 2010, 39, 1835–1857 RSC.
- G. Ashkenasy and M. R. Ghadiri, J. Am. Chem. Soc., 2004, 126, 11140–11141 CrossRef CAS.
- N. Wagner and G. Ashkenasy, Chem.–Eur. J., 2009, 15, 1765–1775 CrossRef CAS.
- N. Wagner and G. Ashkenasy, J. Chem. Phys., 2009, 130, 164907 CrossRef.
- V. C. Allen, C. C. Robertson, S. M. Turega and D. Philp, Org. Lett., 2010, 12, 1920–1923 CrossRef CAS.
- A. Saghatelian, N. H. Voelcker, K. M. Guckian, V. S. Y. Lin and M. R. Ghadiri, J. Am. Chem. Soc., 2003, 125, 346–347 CrossRef CAS.
- J. Zhou, M. A. Arugula, J. Halamek, M. Pita and E. Katz, J. Phys. Chem. B, 2009, 113, 16065–16070 CrossRef CAS.
- H. Schoneborn, J. Bulle and G. von Kiedrowski, ChemBioChem, 2001, 2, 922–927 CrossRef CAS.
- D. Sievers and G. von Kiedrowski, Nature, 1994, 369, 221–224 CrossRef CAS.
- D. H. Lee, J. R. Granja, J. A. Martinez, K. Severin and M. R. Ghadiri, Nature, 1996, 382, 525–528 CrossRef CAS.
- G. Ashkenasy, R. Jagasia, M. Yadav and M. R. Ghadiri, Proc. Natl. Acad. Sci. U. S. A., 2004, 101, 10872–10877 CrossRef CAS.
- M. Kindermann, I. Stahl, M. Reimold, W. M. Pankau and G. von Kiedrowski, Angew. Chem., Int. Ed., 2005, 44, 6750–6755 CrossRef CAS.
- E. Kassianidis and D. Philp, Angew. Chem., Int. Ed., 2006, 45, 6344–6348 CrossRef CAS.
- K. Severin, D. H. Lee, J. A. Martinez and M. R. Ghadiri, Chem.–Eur. J., 1997, 3, 1017–1024.
- S. Yao, I. Ghosh, R. Zutshi and J. Chmielewski, Nature, 1998, 396, 447–450 CrossRef CAS.
- X. Li and J. Chmielewski, J. Am. Chem. Soc., 2003, 125, 11820–11821 CrossRef CAS.
- C. Jaeckel, M. Salwiczek and B. Koksch, Angew. Chem., Int. Ed., 2006, 45, 4198–4203 CrossRef.
- K. Pagel, K. Seeger, B. Seiwert, A. Villa, E. Mark Alan, S. Berger and B. Koksch, Org. Biomol. Chem., 2005, 3, 1189–1194 RSC.
- G. von Kiedrowski, Bioorg. Chem. Front., 1993, 3, 113–146 Search PubMed.
- Z. Dadon, M. Samiappan, E. Y. Safranchik and G. Ashkenasy, Chem.–Eur. J., 2010, 16, 12096–12099 CrossRef CAS.
- Z. Dadon, N. Wagner and G. Ashkenasy, Angew. Chem., Int. Ed., 2008, 47, 6128–6136 CrossRef CAS.
- R. F. Ludlow and S. Otto, Chem. Soc. Rev., 2008, 37, 101–108 RSC.
- A. Vidonne and D. Philp, Eur. J. Org. Chem., 2009, 583–588 CrossRef.
- G. Gasparini, F. Bettin, P. Scrimin and J. Prins Leonard, Angew. Chem., Int. Ed., 2009, 48, 4546–4550 CrossRef CAS.
Footnote |
| † Electronic supplementary information (ESI) available: Peptide synthesis and characterization, experimental details, and additional spectral analysis of the replication process. See DOI: 10.1039/c0cc04098c |
| This journal is © The Royal Society of Chemistry 2011 |