Assessment of the morphology of mixed SAMs on Au nanoparticles using a fluorescent probe†‡
Renato
Bonomi
,
Alessandro
Cazzolaro
and
Leonard J.
Prins
*
Department of Chemical Sciences, University of Padova, via Marzolo 1, I-35131 Padova, Italy. E-mail: leonard.prins@unipd.it; Fax: +39 049 8275239; Tel: +39 049 8275256
First published on 30th September 2010
Abstract
The distribution of thiols in mixed SAMs can be determined in a straightforward manner from spectrophotometric titrations using a fluorescent probe. A plot of saturation concentration as a function of mole fraction provides information on the number of headgroups involved in binding.
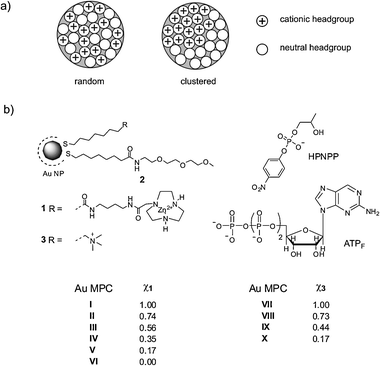
Currently, monolayer protected Au colloids (Au MPCs) are probably the most intensively studied self-assembled systems.1 Their attractiveness results from their ease of synthesis and functionalization and also from their high thermodynamic stability under physiological conditions. The multivalent nature of Au MPCs allows for high binding affinities with biotargets2 and this, combined with the possibility to create mixed self-assembled monolayers (SAMs) of recognition units, signalling moieties, and drugs, has led to their widespread use in the field of biomolecular recognition and sensing.3 An emerging application of Au MPCs is in the field of catalysis, potentially bridging the gap between homogeneous and heterogeneous catalysis.4 Here, the inorganic nanoparticle (NP) core allows recovery of the catalytic system through filtration, or magnetic separation, whereas homogeneous-like catalysis originates from the presence of catalytic units in the SAM.5 Ideally, the properties of these units can be tailored by surrounding functionalities on neighbouring thiols, just as in enzymes.6 A successful application of Au MPCs in either one of these areas relies for a large part on the surface morphology of mixed SAMs, i.e. the distribution of different thiols within the monolayer (Fig. 1a).7 With this respect, a straightforward methodology that allows for an assessment of the mixed monolayer morphology is of crucial importance. Previous studies have relied on either direct (STM)8 or indirect methodologies using radical probes for ESR9 or reactive proximity probes for chemical cross-linking.10 Previously we have shown that the Michaelis–Menten parameter kcat (which gives the catalytic efficiency of enzyme-like catalysts under saturation of substrate) provides indirect information on the morphology of a catalytic SAM.11Catalytic Au MPCs I–V with a core diameter of 1.6 ± 0.2 nm contain a TACN·ZnII headgroup (TACN
![[thin space (1/6-em)]](https://www.rsc.org/images/entities/char_2009.gif) ∶
∶![[thin space (1/6-em)]](https://www.rsc.org/images/entities/char_2009.gif) triazacyclononane) which highly efficiently catalysed the transphosphorylation of HPNPP (2-hydroxy-4-nitrophenylphosphate), which is an RNA model substrate (Fig. 1b).12 The system displayed enzyme-like behaviour with ‘overall’ values for kcat = 6.7 × 10⁻³ s−1 and KM = 0.31 mM at pH = 7.5 in H2O, which are among the highest reported for this substrate.13 Theoretical analysis and experimental data obtained by measuring kcat as a function of the ratio 1
triazacyclononane) which highly efficiently catalysed the transphosphorylation of HPNPP (2-hydroxy-4-nitrophenylphosphate), which is an RNA model substrate (Fig. 1b).12 The system displayed enzyme-like behaviour with ‘overall’ values for kcat = 6.7 × 10⁻³ s−1 and KM = 0.31 mM at pH = 7.5 in H2O, which are among the highest reported for this substrate.13 Theoretical analysis and experimental data obtained by measuring kcat as a function of the ratio 1![[thin space (1/6-em)]](https://www.rsc.org/images/entities/char_2009.gif) ∶
∶![[thin space (1/6-em)]](https://www.rsc.org/images/entities/char_2009.gif) 2 (a catalytically inert triethyleneglycol-terminated thiol) revealed that the observed trend is indicative of a random distribution of the thiols in the mixed SAM.11 This is of importance as it permits the development of second-generation catalytic Au MPCs, in which the surrounding thiols 2 modulate the catalytic performance. Nonetheless, several disadvantages decrease the usefulness of the kcat parameter to probe the morphology of SAMs, among which the numerous kinetic measurements, knowledge about the catalytic site, and, obviously, the necessity of a catalytic SAM. Here, we report a straightforward and general methodology to assess the surface morphology of any cationic SAM, also when catalytically inactive, which relies on the use of a fluorescent anionic probe.
2 (a catalytically inert triethyleneglycol-terminated thiol) revealed that the observed trend is indicative of a random distribution of the thiols in the mixed SAM.11 This is of importance as it permits the development of second-generation catalytic Au MPCs, in which the surrounding thiols 2 modulate the catalytic performance. Nonetheless, several disadvantages decrease the usefulness of the kcat parameter to probe the morphology of SAMs, among which the numerous kinetic measurements, knowledge about the catalytic site, and, obviously, the necessity of a catalytic SAM. Here, we report a straightforward and general methodology to assess the surface morphology of any cationic SAM, also when catalytically inactive, which relies on the use of a fluorescent anionic probe.
 | ||
| Fig. 1 (a) Schematic representation of a mixed SAM in which the thiols are either randomly distributed or clustered in homodomains. (b) Mixed SAM composition of Au MPCs I–X. The synthesis and characterization of Au MPCs I–VI has been reported elsewhere,11 whereas the synthesis and preparation of Au MPCs VII–X is described in the ESI.‡ | ||
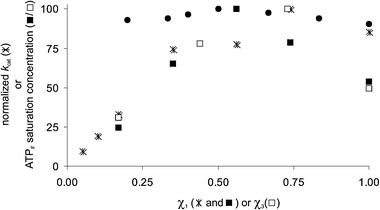
Recently, we have found that biologically important oligoanions such as ATP, ADP, and AMP, strongly bind to Au MPC I in H2O buffered at pH 7.0.14 In particular, only a lower value for the binding affinity of ATP and ADP could be determined (Kass > 106 M−1), because quantitative binding was observed even at 2 μM concentrations of TACN·ZnII headgroups. For an analogous series of anionic Asp-containing peptides it was observed that the change in free energy of binding, ΔG, increased in a perfect linear manner as a function of the number of charges present in the analyte. These results indicate that multiple charged analytes such as ATP and ADP interact simultaneously with more than one TACN·ZnII headgroup. Importantly, this implies that these analytes could serve as a probe to assess the surface morphology of mixed SAMs, since binding affinity should be correlated to the distribution of TACN·ZnII headgroups. In order to verify this hypothesis, we performed a series of titration experiments on Au MPCs I–V§ using the probe ATPF (2-aminopurine riboside-5′-O-triphosphate) which is a fluorescent analog of ATP (λex = 305 nm, λem = 370 nm).15 It is well-known that Au nanoparticles highly efficiently quench the fluorescence of bound fluorophores.16 Thus, titration studies were performed by adding increasing amounts of ATPF to solutions of Au MPCs I–V having surface mole fractions of 1 ranging from 1.0–0.17 (Fig. 2a). All titrations were rigorously performed at a constant nominal concentration of TACN·ZnII headgroups equal to 5.0 μM in H2O buffered at pH 7.0. This allows for a direct comparison of the different Au MPC batches, since numerical contributions are eliminated.17 For all batches an initial quenching of fluorescence is observed indicating that all added probe is fully bound to the Au MPC surface. No quenching of fluorescence was observed for Au MPC VI containing only thiol 2, which excludes aspecific binding of the fluorophore to the TEG-monolayer. Upon the continued addition of probe, at certain point fluorescence emission is observed, the intensity of which increases linearly as a function of the concentration of ATPF. The saturation concentrations were determined as the intersect of the extrapolated linear parts of the titration curves. The resulting concentrations were normalized on the maximum concentration observed (for χ1 = 0.56) in order to facilitate comparison with the other data series (vide infra) and plotted against the mole fraction of 1 (Fig. 3). In order to verify whether the probe would also function on other cationic Au MPCs, the measurements were repeated on a series of Au MPCs VII–X (core diameter 2.6 ± 0.8 nm) containing mole fractions of thiol 3, terminating with a positively charged ammonium-headgroup, ranging from 1.0–0.17.¶ Seminal contributions by Rotello et al. have shown that these Au MPCs are excellent components for displacement assays for enzyme activity because of their high affinity for negatively charged biotargets.18–20 Remarkably, a nearly superimposable bell-shaped curve was obtained with a maximum for χ3 = 0.75.
![(a) Fluorescence titrations of ATPF to Au MPCs I (■), II (□), III (○), IV (*) and V (▲). (b) Fluorescence titrations of ATPF to Au MPC I in the presence of increasing amounts of Au MPC VI (■: 0.2, □: 0.5, ○: 1.0, *: 1.5, ▲: 2, +: 4 equivalents). Experimental conditions: [TACN·ZnII] = 5.0 × 10⁻⁶ M, [HEPES] = 1.0 × 10⁻² M, pH = 7.0, T = 25 °C.](/image/article/2011/CC/c0cc02260h/c0cc02260h-f2.gif) | ||
| Fig. 2 (a) Fluorescence titrations of ATPF to Au MPCs I (■), II (□), III (○), IV (*) and V (▲). (b) Fluorescence titrations of ATPF to Au MPC I in the presence of increasing amounts of Au MPC VI (■: 0.2, □: 0.5, ○: 1.0, *: 1.5, ▲: 2, +: 4 equivalents). Experimental conditions: [TACN·ZnII] = 5.0 × 10⁻⁶ M, [HEPES] = 1.0 × 10⁻² M, pH = 7.0, T = 25 °C. | ||
 | ||
| Fig. 3 Normalized kcat (*)11 or ATPF-saturation concentration (■/□) as a function of the mole fraction of 1 (* and ■) or 2 (□) in Au MPCs series I–V and VII–X. The black circles ● indicate the saturation values obtained for Au MPC I in the presence of increasing amounts of Au MPC VII. The difference between χ1: ■ and χ1: ● (the same sample) is a result of the normalization on the maximum value in the series. All values are the average of two separate measurements (errors < 10%). | ||
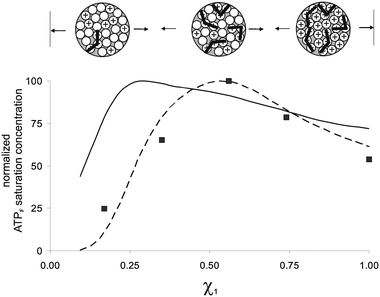
The question is how these curves should be interpreted in terms of SAM morphology. Clustering of thiols in domains implies that the behaviour of the system, in this case the saturation concentration of fluorophore, should be constant when normalized for the nominal concentration of thiols present (except for low surface loadings below 10%). That this is indeed the case was experimentally confirmed by measuring the saturation concentration of Au MPC I in the presence of increasing amounts of Au MPC VI. This represents the most extreme form of clustering with the two thiols segregated on different NPs. No change at all in the saturation concentration was observed (Fig. 2b and 3) over the range of mole fractions studied (1.0–0.2). This clearly marks the difference with the mixed monolayers, for which an increase in the saturation concentration is observed up till mole fractions of around 0.5–0.7. Previously, we have shown that this is characteristic for a random distribution of thiols within the SAM, since at low loadings the presence of isolated charged groups and small patches effectively reduces the number of binding sites composed of multiple charged headgroups (Fig. 3, 0 < χ1 < 0.3).11 Remarkably, and contrary to that observed for HPNPP, lower saturation concentrations are observed also for high surface mole fractions of either 1 or 3. This can be rationalized considering that a full packing of ATPF on for instance Au MPC I is energetically less favourable, because of the occurrence of repulsive interactions between the multiple negatively charged probe molecules (not all phosphate groups may be involved in binding) (Fig. 3, 0.7 < χ1 < 1.0).|| We performed a series of simulations in order to support this hypothesis. Simulations were performed in a similar manner to that used previously for explaining the catalytic behavior11 taking C60 as a rudimentary model of a Au MPC with each facet of C60 able to accommodate a single thiol. The facets were stepwise filled in a random order with a positively charged group and after each step the number of binding sites were counted. Both the situations in which the binding site was composed of 2 or 3 neighbouring units were analyzed. Importantly, based on the experimental data, it was imposed that at χ+ = 1.0, only 50% of the charged groups was involved in binding. With this constraint, the number of binding sites were determined as a function of χ+. Correction for the binomial distribution of two thiols and normalization for the amount of positively charged thiols present gave the profiles as shown in Fig. 4. An increase in the binding pocket from 2 to 3 units causes a shift in the maximum from χ+ ∼0.25 to ∼0.50, which is due to the necessity for larger patches. The striking similarity between the experimental data and the simulated values for the model, although very simplistic, assuming a binding pocket of 3 thiolsand a 50% saturation for χ+ = 1.0 is in strong support of our hypothesis. Interestingly, the maximum involvement of headgroups in binding is obtained at intermediate surface loadings at which the randomly formed patches are large enough to be fully saturated, whilst repulsive interactions are minimized because of the presence of inert TEG-thiols 2 (Fig. 4, 0.4 < χ+ < 0.7).
 | ||
| Fig. 4 Simulated saturation profiles as a function of the mole fraction of positively charged headgroup assuming that the binding site is composed of either 2 (solid line) or 3 (dashed line) neighbouring thiolsand imposing that only one contact between bound probes is permitted. The experimental data (■) for Au MPCs I–VI (see Fig. 3) have been added to facilitate comparison. | ||
Finally, quantification of the amount of probe molecules bound learns that at saturation around 8 ATPF molecules are bound to the surface of Au MPC I.** The observed sharp transition from bound to free ATPF confirms the high binding affinity. The fact that this occurs at micromolar concentrations in H2O buffered at pH = 7.0 creates the possibility to self-assemble biologically relevant functions on the surface of Au MPCs of this type. Currently, our research is heading into that direction.
In conclusion, we have shown that the morphology of cationic SAMs can be assessed in a straightforward manner using a fluorescence probe. The methodology relies on the quenching of fluorescence when the probe is bound to the Au MPCand the fact that the probe interacts simultaneously with multiple positively charged headgroups. Interestingly, the obtained results indicate that at intermediate surface loadings a maximum number of cationic headgroups are involved in binding. This knowledge is of importance for the application of this type of Au MPCs in (bio)recognition processes and catalysis. In addition, these results demonstrate the feasibility of self-assembling a large number of small anionic molecules on the surface of Au MPCs under physiologically relevant conditions.
Financial support from the European Research Council under the European Community's Seventh Framework Programme (FP7/2007–2013)/ERC Starting Grant agreement no. 239898 is acknowledged.
Notes and references
- M. C. Daniel and D. Astruc, Chem. Rev., 2004, 104, 293 CrossRef CAS.
- M. De, P. S. Ghosh and V. M. Rotello, Adv. Mater., 2008, 20, 4225 CrossRef CAS.
- S. S. Agasti, S. Rana, M. H. Park, C. K. Kim, C. C. You and V. M. Rotello, Adv. Drug Delivery Rev., 2010, 62, 316 CrossRef CAS.
- S. Roy and M. A. Pericas, Org. Biomol. Chem., 2009, 7, 2669 RSC.
- C. Guarise, F. Manea, G. Zaupa, L. Pasquato, L. J. Prins and P. Scrimin, J. Pept. Sci., 2008, 14, 174 CrossRef CAS.
- C. C. Paluti and E. S. Gawalt, J. Catal., 2009, 267, 105 CrossRef CAS.
- C. Gentilini and L. Pasquato, J. Mater. Chem., 2010, 20, 1403 RSC.
- A. M. Jackson, J. W. Myerson and F. Stellacci, Nat. Mater., 2004, 3, 330 CrossRef CAS.
- C. Gentilini, P. Franchi, E. Mileo, S. Polizzi, M. Lucarini and L. Pasquato, Angew. Chem., Int. Ed., 2009, 48, 3060 CrossRef CAS.
- L. Duchesne, G. Wells, D. G. Fernig, S. A. Harris and R. Levy, ChemBioChem, 2008, 9, 2127 CrossRef CAS.
- G. Zaupa, C. Mora, R. Bonomi, L. J. Prins and P. Scrimin, submitted for publication.
- F. Manea, F. B. Houillon, L. Pasquato and P. Scrimin, Angew. Chem., Int. Ed., 2004, 43, 6165 CrossRef CAS.
- F. Mancin, P. Scrimin, P. Tecilla and U. Tonellato, Chem. Commun., 2005, 2540 RSC.
- R. Bonomi, A. Cazzolaro, A. Sansone, P. Scrimin and L. J. Prins, submitted for publication.
- W. R. McClure and K.-H. Scheit, FEBS Lett., 1973, 32, 267 CrossRef CAS.
- K. E. Sapsford, L. Berti and I. L. Medintz, Angew. Chem., Int. Ed., 2006, 45, 4562 CrossRef CAS.
- M. Martin, F. Manea, R. Fiammengo, L. J. Prins, L. Pasquato and P. Scrimin, J. Am. Chem. Soc., 2007, 129, 6982 CrossRef CAS.
- A. Verma, H. Nakade, J. M. Simard and V. M. Rotello, J. Am. Chem. Soc., 2004, 126, 10806 CrossRef CAS.
- C. C. You, O. R. Miranda, B. Gider, P. S. Ghosh, I. B. Kim, B. Erdogan, S. A. Krovi, U. H. F. Bunz and V. M. Rotello, Nat. Nanotechnol., 2007, 2, 318 CrossRef CAS.
- A. Bajaj, O. R. Miranda, I. B. Kim, R. L. Phillips, D. J. Jerry, U. H. F. Bunz and V. M. Rotello, Proc. Natl. Acad. Sci. U. S. A., 2009, 106, 10912 CrossRef CAS.
- F. Manea, C. Bindoli, S. Polizzi, L. Lay and P. Scrimin, Langmuir, 2008, 24, 4120 CrossRef CAS.
- M. J. Hostetler, J. E. Wingate, C. J. Zhong, J. E. Harris, R. W. Vachet, M. R. Clark, J. D. Londono, S. J. Green, J. J. Stokes, G. D. Wignall, G. L. Glish, M. D. Porter, N. D. Evans and R. W. Murray, Langmuir, 1998, 14, 17 CrossRef CAS.
Footnotes |
| † This article is part of the ‘Emerging Investigators’ themed issue for ChemComm. |
| ‡ Electronic supplementary information (ESI) available: Synthesis and characterization of thiol 3 and Au MPCs VI–X. Fluorescence titrations. See DOI: 10.1039/c0cc02260h |
| § The synthesis and full characterization of Au MPCs I–VI is given in ref. 11. |
| ¶ Au MPCs VII–X were prepared following a literature procedure21 and characterized by TEM and NMR spectroscopy. See ESI.‡ |
| || This is less an issue for HPNPP, which has a single negative charge. |
| ** Considering that a 1.6 nm sized Au NP is covered with around 50 thiols,22 the observed concentration of 0.73 × 10⁻⁶ M of ATPF required to fully saturate Au MPC I implies that around 8 (0.73 × 10⁻⁶/1 × 10−7) probe molecules are bound at saturation. |
| This journal is © The Royal Society of Chemistry 2011 |
