Colloidal synthesis of inorganic fullerene nanoparticles and hollow spheres of titanium disulfide†‡
Sujay
Prabakar
,
Sean
Collins
,
Bryan
Northover
and
Richard D.
Tilley
*
School of Chemical and Physical Sciences and Macdiarmid Institute of Advanced Materials and Nanotechnology, Victoria University of Wellington, 600, New Zealand. E-mail: richard.tilley@vuw.ac.nz
First published on 17th September 2010
Abstract
The synthesis of inorganic fullerene (IF) nanoparticles and IF hollow spheres of titanium disulfide by a simple colloidal route is reported. The injection temperature of the titanium precursor into the solvent mixture was found to be important in controlling the morphology.
Inorganic fullerene structures of the form MX2 with M = Ti, Mo, W and X = S, Se have found use in nanoscale electronic devices1 and tribology.2 The synthesis, properties and applications of these compounds have been studied extensively.3–7 TiS2 crystallizes in a hexagonal CdI2-like structure, made up of one hexagonally packed sheet of Ti atoms contained between two hexagonal sheets of S atoms.8 Although there is strong bonding between atoms in the Ti and S layers, weak van der Waals forces dominate the bonding between the S and S layers. TiS2 forms nanotubes and inorganic fullerene-like nanostructures due to its similarity to graphite and its inherent lack of stability in the planar form.
Low temperature solution synthesis,9 and colloidal synthesis10 have been used to make nanotubes and nanoflowers of TiS2. IF nanoparticles of TiS2 have been made by gas-phase synthesis.11 However, to the best of our knowledge, the controlled colloidal synthesis of IF nanoparticles or IF hollow spheres has yet to be reported for TiS2.
Here we report the colloidal synthesis of IF nanoparticles and IF hollow spheres using a high boiling point, primary amine solvent, oleylamine. The whole process can be formulated as follows (eqn (1)):
| TiCl4 + 6S → TiS2 + 2S2Cl2 | (1) |
In a typical synthesis 0.192 g (6.00 mmol) of rhombohedral sulfur (≥99.5%, Aldrich) was dissolved in 14 ml of oleylamine (70%, Aldrich) and 2 ml of oleic acid (≥98.0%, Fluka) and gradually heated to 300 °C and degassed for 30 min. Titanium tetrachloride (0.1 ml, 1.00 mmol) (TiCl4 98.5%, Aldrich) was then injected into the reaction mixture at 250 °C and the mixture raised up to 300 °C over a period of 10 min and further reacted for 90 min. The black solid obtained from the reaction was collected by centrifugation and repeatedly washed with methanol and toluene. On filtering the bluish-black solution using a membrane filter, IF nanoparticles were observed in the filtrate. The second experiment had a room temperature injection, and raised up to 300 °C over 20 min and further reacted for 90 min and then allowed to cool to room temperature. The black solid obtained from the reaction was collected by centrifugation and purified by washing with toluene and methanol repeatedly, to obtain IF hollow spheres.
Fig. 1 (and Fig. S1 in the ESI‡) are transmission electron microscopy (TEM) images of the filtrate of the first reaction with an injection temperature of 250 °C and a reaction temperature of 300 °C (90 min). The image in Fig. 1 shows IF TiS2 nanoparticles, aggregated together in clusters of 50–60 nanoparticles. A selected area electron diffraction pattern of the IF nanoparticles is shown in the upper inset of Fig. 1 and can be readily indexed to hexagonal TiS2.8 As can be seen in the figure, nanoparticles of different size ranges are observed. Three different size regimes were observed for the IF nanoparticles as can be seen in the size histogram (inset). Quasi-spherical IF nanoparticles of size range 20 ± 5 nm in diameter were observed to make up 40% of the fullerenes, whilst 50% of the fullerenes were made up of IF nanoparticles with an elongated shape, of length 40 ± 5 nm and diameter 20 ± 5 nm. The remainder of the sample (10%) was made up of closed tubular nanostructures of lengths ranging from 200 to 500 nm and 15 ± 5 nm in diameter. The proportion of IF nanoparticles in the as-synthesized sample was 20–30% of the product, whilst the remainder of the sample was made of bulk (platelets) titanium disulfide, a few hundreds of nanometres to 1 μm in size, each.
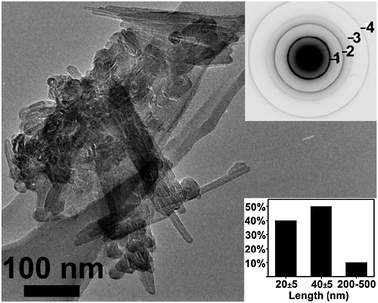 | ||
| Fig. 1 Low-magnification TEM image of a typical aggregate of IF nanoparticles with (insets) selected area electron diffraction pattern (Ring 1 = (001), 2 = (101), 3 = (012), 4 = (110) and size histogram (530 counts)). | ||
TEM-EDS analysis of all the nanoparticles showed that the sample contained titanium and sulfur, in a stoichiometric ratio of 1![[thin space (1/6-em)]](https://www.rsc.org/images/entities/char_2009.gif) :2, with only trace amounts of C, N and O from capping molecules and the TEM grid (Fig. S2 in ESI‡).
:2, with only trace amounts of C, N and O from capping molecules and the TEM grid (Fig. S2 in ESI‡).
Fig. 2a is a higher magnification TEM image of an individual quasi-spherical IF TiS2 nanoparticle of size 20 nm, with discernible lattice fringes and a hollow core. Individual quasi-spherical nanoparticles are observed to be typically between 20–25 nm in diameter and consist of 10–20 concentric layers depending on its size. Although the concentric layers are complete, they are not separated from each other and layers from other nanoparticles are seen to overlap. A hollow core of ∼2–5 nm is also observed. Fig. 2b is the higher magnification TEM image of an elongated nanoparticle of length 35 nm, with a hollow core of 5 nm. The elongated IF nanoparticles were typically made up of 25–30 concentric layers, and similarly had overlapping layers from neighbouring nanoparticles. Depending on the size of the nanoparticle the elongated IF nanoparticles had hollow cores of size 5–10 nm. Individual fringes within the IF nanoparticle represent a molecular sheet of TiS2. The fast Fourier transform (FFT) of the elongated nanoparticle in Fig. 2b (inset) confirms the crystallinity and structure of the nanoparticles. The line profile of the lattice fringes inside the boxed region of the HRTEM image is shown in Fig. 2c. From the line profile, the interlayer separation was found to be 0.58 nm ± 0.1 nm which is in good agreement with the literature value for the (001) of TiS2.8
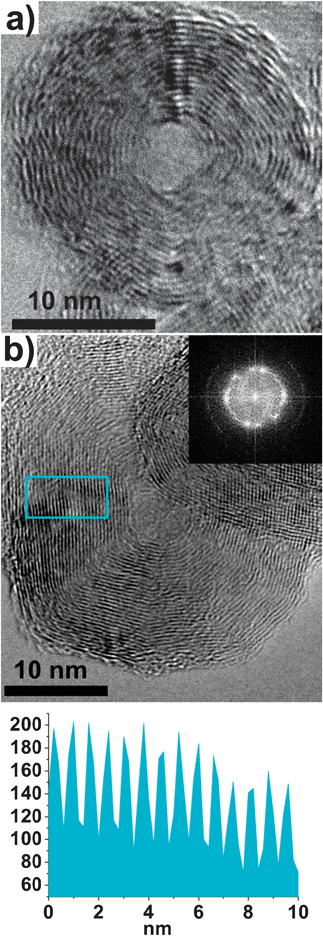 | ||
| Fig. 2 (a) High-magnification TEM image of a quasi-spherical IF nanoparticle and (b) High-magnification TEM image of a typical elongated IF nanoparticle (inset) fast Fourier transform (FFT) of the nanoparticle. (c) The line profile of the boxed area in (b) shows an interlayer spacing of ∼0.5 nm. | ||
Fig. 3 is a high magnification TEM image of a section of a closed IF tubular nanoparticle. Due to the aggregated nature of the sample, the nanoparticle is observed to be intertwinned with other closed tubular nanoparticles. The tubular nanoparticle was observed to be made up of about 15 layers and a core of length 40 nm and diameter 5 nm. Depending on the length of the closed tubular IF nanoparticles, the core varied from ∼40–70 nm in length.
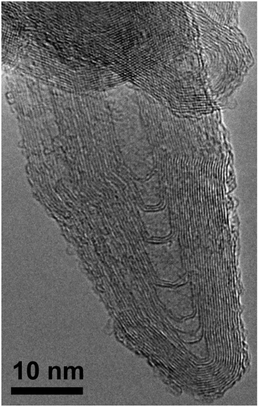 | ||
| Fig. 3 High magnification TEM image of a typical closed tubular IF nanoparticle. | ||
In a second reaction, the titanium precursor was injected into the sulfur solution at room temperature, after which the solution was gradually raised to 300 °C and reacted at that temperature for 90 min. The product was composed of 70–80% IF hollow TiS2 spheres. TEM images of the as-synthesized products are shown in Fig. 4. In Fig. 4a, the product is made up of IF hollow spheres aggregated together in clusters of 10–20. The hollow spheres are about 250–400 nm in size, with whiskers emanating from their surface. The whiskers were found to be polycrystalline TiS2 from selected-area electron diffraction patterns. Fig. 4b is a TEM image of an individual hollow sphere, showing a distinct outer wall bearing IF features. The IF titanium disulfide hollow sphere is approximately 400 nm in size with an outer wall diameter of about 20 nm. Higher magnification TEM image of the walls of the IF hollow sphere is shown in Fig. 4c, and clearly shows the uniform arrangement of the shells of the hollow sphere, consisting of multiwalled layers within 14–15 walls. TEM-EDS analysis of the product, showed that it contained Ti and S in a 1:2 ratio, with no contamination from impurities.
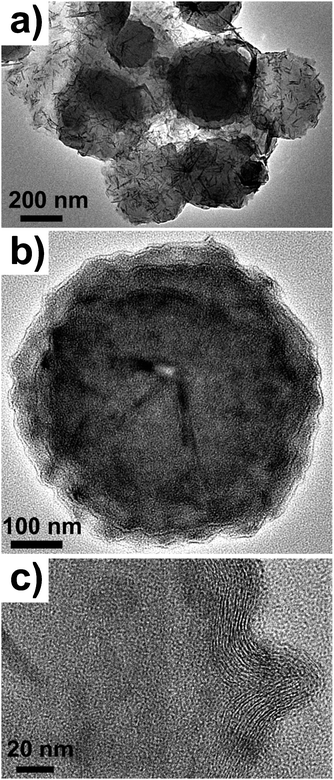 | ||
| Fig. 4 (a) Low resolution TEM image of hollow IF TiS2 hollow spheres. (b) TEM image of an individual IF hollow sphere and (c) high magnification TEM image of the outer walls. | ||
The X-ray diffraction (Cu-Kα radiation) patterns of the bulk platelets from the first reaction and the hollow spheres from the second reaction are shown in Fig. 5. The peaks could be readily indexed to the hexagonal phase of TiS2.
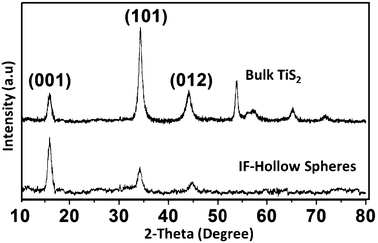 | ||
| Fig. 5 XRD pattern of bulk platelet and IF TiS2 hollow spheres. | ||
In summary, we have devised a simple colloidal route to synthesize IF nanoparticles and IF hollow spheres, by varying the injection temperature of the titanium precursor into the sulfur solution. The products may have potential applications in hydrogen-storage and lubrication.
This work was supported by the Foundation for Science, Research and Technology, grant PROJ-13733-NMTS.
Notes and references
- A. H. Liu, M. D. Wei, I. Honma and H. S. Zhou, Adv. Funct. Mater., 2006, 16, 371–376 CrossRef CAS.
- R. Rosentsveig, A. Margolin, A. Gorodnev, R. Popovitz-Biro, Y. Feldman, L. Rapoport, Y. Novema, G. Naveh and R. Tenne, J. Mater. Chem., 2009, 19, 4368–4374 RSC.
- Y. Feldman, E. Wasserman, D. J. Srolovitz and R. Tenne, Science, 1995, 267, 222–225 CrossRef CAS.
- F. L. Deepak and R. Tenne, Cent. Eur. J. Chem., 2008, 6, 373–389 Search PubMed.
- A. N. Enyashin, M. Bar-Sadan, J. Sloan, L. Houben and G. Seifert, Chem. Mater., 2009, 21, 5627–5636 CrossRef CAS.
- J. Etzkorn, H. A. Therese, F. Rocker, N. Zink, U. Kolb and W. Tremel, Adv. Mater., 2005, 17, 2372 CrossRef CAS.
- N. A. Dhas and K. S. Suslick, J. Am. Chem. Soc., 2005, 127, 2368–2369 CrossRef CAS.
- J. A. Wilson and A. D. Yoffe, Adv. Phys., 1969, 18, 193 CAS.
- J. Chen, Z. L. Tho and S. L. Li, Angew. Chem., Int. Ed., 2003, 42, 2147–2151 CrossRef CAS.
- S. Prabakar, C. W. Bumby and R. D. Tilley, Chem. Mater., 2009, 21, 1725–1730 CrossRef CAS.
- A. Margolin, R. Popovitz-Biro, A. Albu-Yaron, A. Moshkovich, L. Rapoport and R. Tenne, Curr. Nanosci., 2005, 1, 253–262 Search PubMed.
Footnotes |
| † This article is part of the ‘Emerging Investigators’ themed issue for ChemComm. |
| ‡ Electronic supplementary information (ESI) available: TEM image and EDS spectra. See DOI: 10.1039/c0cc02176h |
| This journal is © The Royal Society of Chemistry 2011 |