Technologies and strategies for glycoproteomics and glycomics and their application to clinical biomarker research†
Fateme
Tousi
,
William S.
Hancock
and
Marina
Hincapie
*
Barnett Institute and Department of Chemistry and Chemical Biology, Northeastern University, Boston, MA 02115, USA. E-mail: m.hincapie@neu.edu
First published on 5th November 2010
Abstract
Several approaches and technologies are currently available to study the glycosylated proteome (glycoproteomics) or the entire repertoire of glycans in a biological system (glycomics). The biological importance of glycosylation has driven the development of novel, sensitive separation and detection methods. New and improved methodologies, such as high throughput array systems and liquid chromatography-mass spectrometry for glycan profiling and sequencing, are emerging and are being applied in clinical research. A major thrust of glycoproteomics and glycomic clinical research is the application of these analytical tools to cancer research and is aimed at the discovery of glycan-based biomarkers for diagnosis of early stage human cancers, monitoring disease progression, measuring response to therapy, and detecting recurrence. The identification of cancer biomarkers requires a multidisciplinary approach and therefore this review discusses the strategies, technologies and methods currently used for N-glycoprotein/glycan biomarker research.
 Fateme Tousi | Fateme Tousi received her B.S. and M.Sc degree in Chemistry at the University of Tehran, Iran. In 2008 she started her PhD in Analytical Chemistry at the Department of Chemistry and Chemical Biology, Northeastern University under supervision of Prof. William Hancock and Dr Marina Hincapie. In her PhD she uses bioanalytical chemistry tools, protein separations and mass spectrometry technologies to identify glycosylation changes associated with cancer. |
 William S. Hancock | William S. Hancock is Professor of Chemistry and holds the Bradstreet Chair in Bioanalytical Chemistry within the Barnett Institute of Chemical and Biological Analysis at Northeastern University, Boston, MA. Dr Hancock's research program has focused on the application of separation science, particularly in the area of biotechnology. At the Barnett Institute, his research is focusing on cancer proteomics. He is currently serving as Past-President of US-HUPO and also serves on the International council. He is the founding Editor-in-Chief of the Journal of Proteome Research and the co-chair of the trans-NCI Alliance of Glycobiologists for Detection of Cancer and Cancer Risk |
 Marina Hincapie | Dr Marina Hincapie, is a Research Assistant Professor at the Barnett Institute (Northeastern University). Her research interests include development of lectin-based technologies for glycoproteomic studies and mass spectrometry assays for absolute quantitation of protein targets in complex mixtures. She applies these methods to clinical proteomics, with an emphasis on studying the glycoproteome. Her research in glycoproteomics is aimed at the identification of glycosylated biomarkers and characterization of glycan modifications in cancer and autoimmune diseases. |
1. Introduction
The addition of complex carbohydrate groups (glycans) to biomolecules creates several populations of biological entities that are rich in information and diverse in function. Glycosylation, the co-translational or post-translational modification resulting from the covalent addition of glycans, is driven by the concerted action of glycosyltranferases and glycosidases and plays a central role in many biological processes, including, protein folding, oligomerization and stability, immune response, host-pathogen interaction, and inflammation.1 In glycoproteins, the addition of sugar chains occurs at either asparagine (Asn) (termed N-glycosylation) residues within a defined consensus sequence (Asn-X-Ser/Thr), where X is any amino acid residue except proline, or at hydroxylysine, hydroxyproline, serine, or threonine (termed O-glycosylation).2 In eukaryotes, glycans are conjugated to proteins (glycoproteins and proteoglycans) and lipids. Thus, the complete set of the glycan structures expressed by cells and tissues is known as the glycome and contains an enormous amount of chemical and functional information.Links between specific glycosylation states and diseases were first postulated more than 40 years ago.3 Evidence has linked certain inflammatory, immune and neurodegenerative diseases, several cancers and other pathologies with alterations of glycan structures. Aberrant patterns of N- and O-linked oligosaccharide modification in cell surface proteins and in circulating plasma proteins are found in almost all human cancers and are correlated with the progression and metastatic potential of the disease.4,5 In addition to disease associated changes, genetic and environmental factors also contribute to the heterogeneity of glycans.6
Understanding the function of glycans and their changes in relation to diseases has been complicated by challenges associated with their analysis and characterization. Site occupancy and the particular carbohydrate sequences and linkages at each site can vary considerably and contribute to heterogeneity.7 Because of the structural complexity and diversity of glycans, their comprehensive characterization is only possible by a multidimensional approach that utilizes and integrates the battery of sensitive analytical methods/techniques now available. For a variety of reasons, including the lack of primary amino acid consensus sequence and complications with the release of O-linked glycans, the methodologies and technologies to characterize glycosylation have been primarily developed for N-linked glycans. Therefore, in this review we will focus only on discussing the current experimental tools and approaches for analysis of N-linked glycans. Technologies based on Liquid Chromatography-Mass Spectrometry (LC-MS), high throughput glycan sequencing, lectin-antibody microarrays as well as novel labeling and new chemistries have opened tremendous research opportunities in clinical glycoproteomics and glycomics. By means of both mass spectrometry and high throughput exoglycosidase array systems, it is becoming feasible to unravel the structures of glycans in more detail than previously possible in order to obtain a more complete picture.
Glycoproteomics focuses on the identification of the glycoproteins that exhibit different types of glycans. Studies at the glycopeptide level are aimed at identification of the site(s) of glycosylation, including occupancy and structural analysis of the glycoform heterogeneity. Glycomic research targets the glycans released from complex samples and focuses on characterizing the type of glycans expressed on specific cells or tissues and defining their function in the context of biology. Several technologies have been developed to profile and catalog glycans, and to obtain comprehensive, quantitative information about the glycan moeity. Together, these two glyco-omic fields are providing useful information with regards to the vital role of glycosylation and the changes that occur with pathologies, particularly cancer. Most cancers begin before any clinical manifestation becomes apparent and by the time of diagnosis the prognosis can be poor. For this reason, the investigation of glycosylation changes associated with cancer is a major mission of the glycoproteomic and glycomics scientific community that has been facilitated by new advances in analytical technologies. This review summarizes the technologies and strategies currently used to isolate the N-glycoproteome and/or released glycans and the application of these methods for the discovery of glycan-based cancer biomarkers.
2. Methods for enrichment and separation of glycoproteins and glycopeptides
The plasma/serum (the term plasma will be used throughout this review to refer generally to both) proteome contains a number of proteins secreted by the liver, the majority of which are glycosylated, except for albumin, and are major components of the plasma proteome. In addition, plasma is also thought to contain low abundance glycoproteins that originate from tumor tissue and damaged cells that are shed into the circulation during malignant transformation and represent a source of potential biomarkers. However, these proteins are dramatically diluted in human plasma and require selective enrichment methods and sensitive technologies for their detection. Targeted isolation of circulating glycoproteins has been accomplished using various glycoproteomic approaches based on selective affinity enrichment using lectins or chemical methods described below. The strategies currently used for enrichment of N-glycoproteomes are illustrated in Fig. 1. | ||
| Fig. 1 Workflow showing the commonly used strategies for N-glycoproteome enrichment in biomarker studies. | ||
2.1 Lectin affinity chromatography
Lectins are plant, bacteria, fungi, and animal proteins which have a natural affinity for binding to specific carbohydrates. Energetically, lectin-carbohydrate interactions are not as favorable as antigen-antibody interactions measured by affinity constant, Ka = 104–107 M versus Ka = 108–1012 M.8,9 Although lectins can display overlapping specificities their binding properties are sufficiently different to target specific populations of glycoprotein motifs and detect subtle changes in protein glycosylation.3,10 Lectins are typically subdivided into categories based on their monosaccharide specificities, and even within a single category marked differences in the binding to the glycans on glycosylated proteins are observed. Lectin affinity chromatography is widely used in glycoproteomics as a way to simplify the sample prior to analysis and for targeting particular sub-glycoproteomes from clinical samples, such as plasma, tissue, cell lysates, etc., for the discovery of cancer-associated biomarkers. Glycoforms with disease specific changes constitute only a small percentage of the total glycoprotein population. Enrichment of glycoprotein sub-populations with altered N-glycans using lectin affinity chromatography has therefore been a useful tool for the isolatation of glycosylated forms in amounts that are sufficient for glycan studies.11Improvements in lectin technologies, where lectins have been immobilized onto high pressure supports, such as silica12,13 or styrene-divinylbenzene co-polymers coated with a cross-linked polyhydroxylated polymer (POROS)14,15 have enabled rapid affinity selection of glycoproteins from biological samples by high pressure liquid chromatography (HPLC) and have led to better protein recoveries and good reproducibility of glycoproteomic studies.16 Lectin affinity chromatography can be performed on either intact glycoproteins or their proteolytic digests.17Glycoproteins/glycopeptides carrying glycan structures that have affinity towards lectins immobilized on chromatography columns are retained and the rest flow through. The bound fraction, enriched in glycoproteins or glycopeptides is released by eluting with buffers containing the corresponding competitive sugar or a low pH solution, for example acetic acid.14,18Fractionation of glycoproteins can be performed using single lectins,19 a series of lectins (Serial Lectin Affinity Chromatography (SLAC)),20,21 or in multi lectin combinations. Lectins with broad and overlapped specificities have been widely used to capture large portions of the glycoproteome,22 while lectins with narrower specificities have been used to extract sub-populations of glycoproteins and/or reveal glycosylation changes.23
Our group developed the concept of Multi-Lectin Affinity Chromatography (M-LAC). The M-LAC column is made up of a mixture of three immobilized lectins: concavanalin A (ConA), wheat germ agglutinin (WGA) and jacalin (JAC), which were selected to target the major glycosylation motifs found in plasma glycoproteins. The M-LAC system, compared to single lectins, has been demonstrated to increase the binding of glycoproteins24 presumably due to heterogeneous populations of glycans attached to the proteins. The M-LAC system fractionates the plasma glycoproteome into two glycoproteome subsets (flow through and bound glycoproteome), and is a useful first step for reducing the complexity of the plasma proteome. Approximately 50% of the plasma glycoproteome can be captured in a single step.25
The SLAC approach has been successful in isolating glycoform populations from purified glycoproteins with subtle structural glycan changes that are related to disease. A study by Ohyama et al.26 reported that using the maackia amurensis leukoagglutinin (MAL) lectin, which recognizes terminal sialic acid α-2,3- linked to galactose structures, they found that the bound fraction of serum prostate specific antigen (PSA) is increased in prostate cancer patients compared to benign prostatic hyperplasia (BPH) patients. Another recent study by Sarrats et al. identified prostate-specific antigen glycoforms and determined that the relative percentages of two isoforms of PSA were different between prostate cancer and BPH patients.27 These studies suggest that the changes in glycosylation in PSA could be used as an additional measurement to improve the sensitivity and specificity of the test for the diagnosis of prostate cancer.
2.2 Capture of N-glycoproteome using hydrazide chemistry
This method was first introduced by Zhang et al.28 and enriches for glycoproteomes via selective capture of the glycoproteins on a solid phase support. First, the cis-diols on the glycan moiety are oxidized to aldehydes using sodium periodate (NaIO4) and then coupled to a hydrazide resin. The captured glycoproteins are proteolytically digested on the resin beads; the non-glycosylated peptides flow through and can be used for total protein identification by mass spectrometry. The bound N-linked glycopeptides are released using peptide-N-glycosidase (PNGase F), which cleaves between the asparagine (Asn) residue of the glycopeptide and the first n-acetylglucosamine of the N-linked glycan core. The same research group modified and standardized the original method. In the optimized standard procedure, instead of plasma proteins, their tryptic digest was oxidized and applied to the hydrazide resin. This resulted in significant increase in glycopeptide yield.29 This method has been used to identify glycoproteins in plasma,28 cancer cell lines,30formalin-fixed paraffin-embedded (FFPE) lung tissues, and frozen lung tissues.31 The combination of hydrazide chemistry with lectin affinity chromatography using ConA, JAC, and WGA in parallel was applied for enrichment of glycopeptides/glycoproteins from rat liver membrane proteins by Lee et al.32 They found that similar numbers of glycoproteins were identified by each approach but significantly different glycoprotein identifications were observed for the two enrichment techniques. Furthermore, Chen and coworkers33 showed that using the proteases thermolysin and pepsin along with trypsin for digesting human liver tissue prior to enrichment by the hydrazide chemistry method increased the number of identified N-glycosites (site of glycan attachment to the peptide backbone) and glycoproteins significantly. In fact these proteases showed a complementary effect in determination of n-glycosites and glycoproteins. Their in-silico digestion of the human proteome database showed that only 68.7% of tryptic N-glycopeptides are in the mass range of 800–3500 Da which was the detectable mass range in their mass spectrometer acquisition setting. Also tryptic cleavage sites may occur close to a bulky glycan moiety that hinders tryptic digestion. These results encourage use of multiple enzymes for glycoprotein analysis. While this method allows identification of the glycosylation sites, the hydrazide chemistry approach destroys the glycans by the oxidative chemical coupling to the hydrazide and the structural information or degree of site occupancy is lost. A clear advantage of this method over lectin enrichment is the potential for reduction of non-specific protein binding which commonly occurs when enriching for glycoproteins from highly complex mixtures. Additionally, unlike the lectin affinity method, the hydrazide functionality captures glycopeptides regardless of their glycan structure and with high coupling efficiency.302.3 Hydrophilic interaction liquid chromatography (HILIC)
The hydrophilic property of glycans is contributed by the high hydroxyl group content; this enables them to interact with the HILIC stationary phase through different mechanisms, such as dipole–dipole and electrostatic interaction (for charged glycans) and hydrogen bonding. Partitioning of peptides between hydrophobic mobile phase and an aqueous layer on the surface of the stationary phase allows the separation of glycosylated and non-glycosylated peptides using HILIC.34,35 Ding et al.35 showed that addition of an ion pairing reagent, such as trifluoroacetate, increases the hydrophobicity differences between non-glycopeptides and glycopeptides and allows the non-glycopeptides to be separated from the glycopeptides. In the HILIC separation, polar peptides and glycopeptides are retained on the relatively polar stationary phase while the rest are washed off with high organic concentration mobile phase. Retained glycopeptides can then be eluted by increasing the water content of the mobile phase. Wohlgemuth et al.36 compared different HILIC stationary phase materials for glycopeptide enrichment of model glycoprotein mixtures prior to reversed phase capillary LC-MS/MS analysis. They concluded that among bare silica, microcrystalline cellulose and silica functionalized with amino, amide (TSKgel Amide-80), and zwitterionic sulfoalkylbetaine (ZIC-HILIC) groups, the last two have the best glycopeptide specificity for a selected protein mixture. Besides achieving selective separation of glycopeptides, the technique also desalts and concentrates the sample and can be directly interfaced with MS.37 When combined with other enrichment methods like lectin chromatography, HILIC can increase the number of identified N-glycosites and N-glycoproteins in complex glycoproteomic samples.382.4 Glycopeptides capture via immobilized titanium dioxide and boronic acid
Enrichment of sialic acid containing glycopeptides is of great interest in disease associated biomarker discovery since modification to the sialic acids at the non-reducing ends of glycans is one of the changes often observed in cancer. The negative charges on the carboxylic acid and hydroxyl groups on sialic acid residues provides a multidentate ligand to Ti4+.39 The method was shown to be highly selective, and this was attributed to multipoint binding of sialic acid to TiO2. The use of highly acidic conditions and aromatic carboxylic acids such as phthalic acid as binding competitor leads to little co-adsorption of acidic non-glycopeptides, as indicated by the LC-MS/MS analysis. Larsen et al.39 applied this method using TiO2 micro columns to enrich sialic acid containing glycopeptides from immuno-affinity depleted plasma and saliva. Since phosphates on phosphorylated proteins could react with strong affinity with titanium dioxide the peptide mixture was treated with phosphatases prior to enrichment of glycopeptides. Their study resulted in the identification of 192 and 97 sialic acid containing glycopeptides in 100 and 45 proteins in human plasma and saliva, respectively.Borate can form a diester with compounds containing cis-diol groups including glycoproteins under alkaline conditions (pH greater than 8). Boronic acid functionalized mesoporous silica has been used to enrich glycopeptides from a rather simple protein mixture.40 The high surface area and narrow pore size distribution of mesoporous silica increases the binding efficiency and could be an effective enrichment method for complex clinical glycoproteomes. However, the reaction between boronic acid and cis-diol groups is not specific to glycans, and other compounds with the same functionality, like nucleotides, could undergo the same reaction.41
3. Screening glycosylation changes
Glycosylation changes are the most frequent biochemical alteration associated with cancer, both in terms of specific hypo- and hyper-glycosylation events as well as neo-glycoslyation of glycans normally restricted to embryonic tissues.42,43 Among the most frequently seen alterations in cancer cells and secreted glycoproteins is an aberrant pattern of N-linked oligosaccharide modification.44 An increase in β 1,6-GlcNAc branching,45sialic acid and fucose content has been well correlated with tumor malignancy.10,46–48In the following section, the methodologies currently being used to investigate glycosylation pattern changes are described.
3.1 Lectin blots and lectin glycoarrays
Work by Lubman and his group55,56 demonstrates the usefulness of integrating various glycoproteomic methods. For example, N-glycoproteome enrichment was coupled with other orthogonal analytical approaches to measure changes in the plasma glycoproteome. They used a three-level protein separation strategy, where plasma from cancer and control samples was immune-depleted of abundant proteins and then lectin enriched to isolate the N-glycoproteome and further fractionated by reversed phase (RP) HPLC. The microarray assay was used to screen these fractions on the lectin array for changes in glycosylation patterns between diseased and controls. Microarray spot intensities were normalized using the corresponding peak areas in the chromatography profile. Then, to identify the glycoprotein(s) responsible for the altered N-glycan pattern observed in the lectin-microarray, the glycoproteins were further separated by a 1D-SDS-PAGE and detected by lectin blotting. Glycoproteins which reacted with fucose and sialic acid specific lectins were excised from the corresponding 1D-SDS gel, digested with trypsin and PNGase F, and analyzed by LC-MS to determine the identity of the protein and the possible glycosylation sites. Using this procedure, five lectins - Peanut Agglutinin (PNA), Sambucus Nigra bark lectin (SNA), Maackia Amurensis lectin II (MAL), Concanavalin A (ConA), and Aleuria Aurentina (AAL) – were used for probing microarrays of fractionated serum glycoproteome of normal, chronic pancreatitis, and pancreatic cancer patients.55 Statistical comparison of glycan patterns of these three groups revealed significantly increased fucosylation and sialylation for several proteins in the sera of cancer patients. Similarly, patients diagnosed with colorectal cancer or adenomas were shown to have statistically significant higher levels of sialylation and fucosylation in complement C3, histidine-rich glycoprotein, and kininogen-1 as compared to normal controls.49
The advantage of the glycoarray combined with the lectin blotting method is the speed at which information can be gathered on the nature of glycosylation changes. The knowledge obtained from these methods can then be used to refine and confirm the findings by more advanced techniques such as mass spectrometry (MS). However, the interactions of lectins with glycans are complex and not yet fully understood.
Furthermore, while 1D SDS-PAGE/lectin blotting is a valuable initial screening for glycoproteins that change in cancer samples, co-migration of proteins results in bands containing more than one protein of interest. Despite these limitations, lectin probes do provide useful information and can be very revealing as to the nature and composition of the glycan. Proper controls, including incubations of the membrane filter with the corresponding monosaccharide inhibitor should be assessed and caution should always be used when interpreting data obtained with lectin-based methods; results should be further confirmed by additional methods.
 | ||
| Fig. 2 Different types of lectin arrays: (a)8 and (b) lectin array,57 (c) lectin-overlay antibody array developed by Haab's group58 (d) antibody-overlay lectin array introduced by Hirabayashi's group.59 | ||
A commonly used technology for glycosylation pattern analysis is lectin array. Selected lectins with known specificities are immobilized on a suitable surface and then glycoprotein is added to the array. This detection can be performed in several ways including tagging the glycoprotein with a fluorescent dye like cyanine 3 bihexanoic acid dye (Cy3)8 or applying a fluorescently-labeled antibody probe to the unlabeled sample.57
An alternative approach uses a sandwich format, where panels of lectins and an antibody directed to the target protein either for capture58 or for detection59 are used. These assays depend on the availability of well characterized and highly specific antibodies, which are not always readily obtainable. The technique is prone to cross-reactivity issues which are normally associated with antibody and lectin based assays; approaches to circumvent these problems have been implemented. Kuno et al.59 developed the “antibody-overlay lectin” method and applied it to the glycan analysis of prostate specific cancer antigen (PSA). In this format the same antibody is used for immunopurification, quantitation, and detection of the target on the microarray. First, a target glycoprotein is enriched using the corresponding antibody, and then the isolated glycoprotein is quantitated by immunoblotting. The glycoprotein is spotted on a lectin array and detection is performed with the biotinylated form of the antibody and fluorescently-labeled streptavidin. To mask the unoccupied binding sites on the lectin array, a polyclonal IgG was added to the array prior to adding the target-specific antibody. The procedure of blocking non-specific binding does not require modifying the antibody structure and is an effective way of eliminating background noise. Incubation time has been optimized to prevent exchange between IgG and the pre-captured target glycoprotein. In this sandwich configuration the lectin may bind to glycans on other glycoproteins that have been co-purified with the target and could compete for binding thereby affecting the sensitivity and the specificity of the method.
In the high throughput method developed by Haab and co-workers,58 the glycans on the capture antibody are modified to avoid interaction with the lectin probe. This is achieved by oxidizing the carbohydrate cis-diols on the antibody with sodium periodate. The modified antibodies are immobilized on a nitrocellulose coated slide. This enables direct and selective capture of the glycoprotein of interest from a biological matrix such as plasma, and avoids sample processing steps and therefore no sample losses are incurred.
To probe the glycan structure of the absorbed glycoprotein, various biotinylated lectins with different specificities are added to the array and a signal is detected using fluorescently-labeled streptavidin. In this strategy, the amount of glycoprotein captured from the crude sample is determined by the amount of immobilized antibody, which is the same for all spots, thus, changes in response to lectins among disease and healthy controls are attributed to changes in the glycan. Whenever possible, multiple antibodies to different epitopes on the target could be used to increase the confidence of the assay.
The lectin-overlay antibody array has been shown to be an effective approach for profiling glycan variation on multiple proteins captured directly from a crude proteome. Using the same basic principle of the lectin-overlay approach, Mehta and co-workers60 performed the assay using a 96 well plate format to specifically target fucosylated proteins. Periodate oxidized antibodies against candidate biomarkers were immobilized on the plate to capture the protein of interest. Captured glycoproteins were detected using a biotin-conjugated fucose-specific lectin (AAL) and detection with a fluorescently-labeled strepavidin. In a study of 332 patients, comprised of patients with hapatocellullar carcinoma (HCC) and other non-cancerous liver diseases (cirrhosis and hepatitis C), they identified glycosylation changes on two proteins, hemopexin and fetuin A, which were capable of discriminating HCC from patients with other liver diseases.
Due to the fact that current technologies for global proteomics of plasma often lead to the identification of medium to high abundance proteins, most clinical studies tend to identify mostly acute phase proteins as exemplified by the studies of Lubman's and Metha's groups. One active area of research is the investigation of whether glycosylation changes in medium to high abundance proteins could discriminate between inflammatory-associated events and malignancy, and therefore provide the basis for more sensitive and more discriminative biomarkers for diagnosis and monitoring progression of disease as it has been demonstrated for alpha fetoprotein (AFP). Normal adult AFP levels are low but its concentration increases in liver conditions such as in cancer, cirrhosis and hepatitis. However, increased core fucosylation of one glycoform (AFP-L3) can identify patients with hepatocellular carcinoma from other non-cancerous liver diseases,61 and is now approved as a biomarker for the differential diagnosis of liver cancer.
4. Chromatographic separation of glycans
The most commonly used method to release the glycan from the peptide backbone is enzymatic digestion with PNGase F. A widely used procedure is to release oligosaccharide from proteolytic digests of the glycoproteins. Proteins are first denatured, using chaotropes, such as guadinium hydrochloride (6M) or urea (8M), then disulfide bonds are reduced and carbamidomethylated. After removing the reagents proteins are digested with trypsin and subsequently PNGase F. Trypsin must be deactivated before adding the glycosidase enzyme.62,63 The other approach is to release glycans directly from reduced and alkylated glycoproteins64 or the glycoproteins denatured in a proper denaturing solution (typically SDS and β-mercaptoethanol or dithiothreitol (DTT) at 100 °C).50,65 After incubation with PNGase F, the released glycans can be collected in the flow-through fraction on a C18 cartridge65 or in the retained fraction of a graphitized carbon column.50 Also PNGase F can release glycans form glycoprotein bands on an SDS-PAGE gel. In-gel released glycans can be extracted by washing with water/acetonitrile.66,67 Released glycans are then subjected to HPLC separation.High resolution chromatographic separations achieved using graphitized carbon or hydrophilic resins can resolve structures which are only slightly different, for example anomeric isomers of sugars and can result in very complex chromatograms. To avoid having two isomers for each sugar molecule, it is common to convert the carbonyl group at the reducing end of the oligosaccharides to its alditol (sugar alcohol) form prior to chromatographic separation to reduce chormatogram complexity.68
In order to enable detection of glycans at the low fentomole level, it is necessary to label the glycan moiety with a fluorophore such as 2-aminobenzamide (2-AB), 2-aminopyridine (2-AP), or 8-amino-1,3,6-pyrenetrisulfonic acid (APTS).68,69 Various fluorescent labels for HPLC analysis of oligosaccharides have been compared by Pabst and coworkers.70
A useful chromatography approach has been to use columns packed with normal phase (NP) amide or amino functionalized silica where glycans are retained by hydrophilic interaction with the stationary phase and are eluted by increasing aqueous buffer concentrations.71,72 Normal phase or hydrophilic interaction HPLC columns are usually calibrated with derivatized dextran (glucose homopolymer) which gives the characteristic ladder profile from monomeric glucose to approximately 20-mers of glucose oligosaccharide. Elution time of the glycans can be expressed in glucose units (GU) by comparison with elution times of the peaks in the ladder profile. The retentions expressed in GU are very reproducible and are used for identification of oligosaccharides. In general, GU value increases with addition of monosaccharides to the glycan. Contributions of each individual monosaccharide to the overall GU value can be calculated.73
Reversed phase HPLC is also used for glycan separation. Derivatization with a hydrophobic agent, through reductive amination is needed to increase hydrophobicity of the glycans. The increased hydrophobicity enhances ionization efficiency of glycans when using RP-LC-MS.
An alternative strategy has been separations based on charge, using capillary electrophoresis (CE)74 and Weak Anion Exchange (WAX)-HPLC to separate glycans according to their negative charge mainly determined by the number of sialic acids.75 A useful workflow to decrease the complexity of glycans and to minimize coelution is to first separate the neutrals, followed by mono, di, tri, etc.sialic acids as occurs when using WAX-HPLC and then subject each peak to NP-HPLC separations.
High-performance anion exchange liquid chromatography with pulsed amperometric detection (HPAEC-PAD) has been the standard technique for the selective separation and analysis of neutral and charged glycans differing by branch, linkage and positional isomerism,76 An advantage of the method, is that oligosacharides do not require derivatization prior to chromatographic separation by anion exchange chromatography. Separated glyccans are detected by PAD, which measures the electrical current produced by oxidation of the glycans on the surface of a gold electrode.77 The chromatogram profile serves as a “fingerprint” for monitoring N-glycosylation patterns. Elution of glycans from strong anion exchange stationary phases is accomplished at high pH, and high concentrations of sodium hydroxide (NaOH) or sodium acetate (NaOAc) are commonly employed. The interaction of the glycans with the stationary phase is influenced by molecular size, sugar composition and monosaccharide linkage.77 The method is extremely sensitive to the buffer purity and especially to the carbonate content, which can form in alkaline solutions from atmospheric carbon dioxide.78 The identification and quantitation of the structures, including structural isomers is accomplished using the elution position and known amount of reference standards. Alternatively, the peaks of interest can be collected for further structural characterization by MS. This is especially useful, in cases, where the structure is unknown, or analytes co-elute and reference standards are not available. However, the elution conditions i.e. high sodium hydroxide or sodium acetate concentration suppresses ionization in LC-ESI-MS experiments and can cause salt deposits in the ion source. Thus, the use of a desalting step prior to LC-MS analysis is required.79 Off line desalting approaches result in samples losses and therefore a better strategy for the identification of glycans, is to interface the HPAEC chromatographic separation with on-line MS detection. In order to allow for direct analysis by MS, the eluent is passed through a cation membrane desalting device (CMD).80 The sodium (Na+) ions in the eluent are replaced with hydronium ions (H3O+) produced from water electrolysis. In a research by Bruggink et al.,81 a flow splitter was used to divert the effluent from the HPAEC column to the cation membrane desalting (CMD) device. The selectivity and sensitivity afforded by the combination of HPAEC-PAD on line with MS could be a powerful approach for the identification of subtle differences in disease-associated glycosylation changes.
Also useful are graphitized carbon columns (GCC) as a solid phase extraction method to enrich protein derived glycans and simultaneously clean the samples of salts prior to mass spectrometry analysis. Glycans are retained on the graphitized carbon column mainly through hydrophobic interaction and can be eluted in order by an acetonitrile gradient and trifluoroacetic acid as mobile phase modifier. Graphitized carbon chromatography is able to distinguish and separate isomeric glycans, which may have the same mass and/or composition but differ in specific monosaccharide linkages. The high resolution of graphitized carbon-LC-MS is promising for structural analysis of complex glycomic mixtures.72,82 In particular, glycan isomers resolved by GCC can be separately analyzed by tandem MS.83 Similar to NP-LC-MS, graphitized carbon-LC-MS can be used for both native and derivatized glycans. This stationary phase is extremely resistant to mechanical forces, wide changes in pH, solvent, and temperature.84 Chu et al.84 separated underivatized N-glycans released from human serum on a graphitized carbon column and determined their structure using a time of flight MS instrument. Using GCC in an integrated HPLC-Chip/TOF MS system they identified around 200 different N-linked oligosaccharides.
5. High throughput HPLC-based method for glycan sequencing by sequential exoglycosidase enzyme digestion
It has been proposed that global profiling of the glycans released from plasma or cell lysate glycoproteomes may lead to identification of glycan structures specific to a cancer type. In this approach, the protein from which the glycan biomarker has been released is not known and identification of the parent glycoprotein is determined by orthogonal methods. The overall workflow in glycomic biomarker studies is shown in Fig. 3, which illustrates the HPLC (HILIC, WAX) separation of fluorescently-labeled glycans combined with exoglycosidase cleavage in an automated high throughput format. The use of exoglycosidases that cut at a specific glycosidic bond at the non-reducing end of an oligosaccharide is a powerful tool in glycan sequencing. They are highly specific for both the sequence of the glycan and its linkage type. For example, almond meal α-fucosidase (AMF) cleaves terminal fucose that is α1-3,4 linked to any monosaccharide residue.68 In this method the chromatographic profile of a glycan mixture digested with exoglycosidases of known specificity is obtained. As exemplified in Fig. 4, disappearance of any peak in the chromatography profile implies the presence of the terminal residue to which the exoglycosidase has specificity.66,85 One example of how this technology has been applied to the discovery of glycan markers has been described in a longitudinal pilot study by Abd Hamid et al.86Glycan pools derived from healthy people and breast cancer patients' sera were sequenced by HPLC with fluorescence detection coupled with exoglycosidase digestions and mass spectrometry. They observed an increase in a tri-sialylated tri-antennary glycan-containing α1,3-linked fucose (A3F3G3S3), which forms part of the sialyl Lewis x (sLex) antigen determinant. The sequential digestion of A3F3G3S3 led to a single product (α1,3-fucosylated mono-galactosylated triantennary structure (A3FG1)) and the level of the structure containing the sLex epitope measured in the form of A3FG1 was quantitated from the HPLC peak. This glycan structure increased more than 2-fold for advanced breast cancer patients compared to healthy controls. The proteins responsible for the potential candidate marker were identified using high resolution 2-dimensional electrophoresis combined with immunoblotting (probed with anti-sLex antibody). Three positive spots were observed in the cancer patients that were not present in the controls and identified by MS as haptoglobin β chain, alpha1-acid glycoprotein, and alpha 1-antichymotrypsin, all well known acute phase glycoproteins. Glycosylation changes in association with various types of cancers have been previously reported for all three acute phase proteins.87–89 The Lewis carbohydrate antigens are important for cell adhesion involving selectins within the vascular system and play a role in metastasis.90 In fact, the authors showed that A3FG1 levels increased steadily with cancer progression and metastasis onset. However, sLex is not specific for a particular cancer; it has been shown to be elevated in the serum of other cancers like ovarian cancer67 and inflammatory conditions.91,92 Nonetheless, as suggested by the authors, the level of this glycan could be a better indicator for monitoring disease progression compared to the currently used circulating cell surface derived tumor glycosylated markers, cancer antigen (CA 15-3) and carcinoembryonic antigen (CEA).93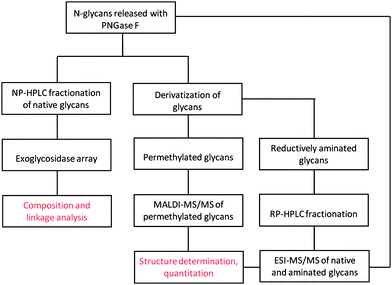 | ||
| Fig. 3 Workflow showing various methodologies in glycomic based biomarker studies. | ||
![Sequential exoglycosidase digestions of N-linked oligosaccharides obtained by in-gel digestion with PNGase F of the high glycosylated RNase 1 from PaC A. One aliquot was analyzed directly by NP-HPLC (A) and the remaining were treated with arrays of exoglycosidase enzymes prior to NP-HPLC analysis as indicated in each panel [(B)-(G)]. Reproduced with permission from S. Barrabes, L. Pages-Pons, C. M. Radcliffe, G. Tabares, E. Fort, L. Royle, D. J. Harvey, M. Moenner, R. A. Dwek, P. M. Rudd, R. De Llorens and R. Peracaula, Glycobiology, 2007, 17, 388–400. Copyright 2007 Oxford University Press.](/image/article/2011/AY/c0ay00413h/c0ay00413h-f4.gif) | ||
| Fig. 4 Sequential exoglycosidase digestions of N-linked oligosaccharides obtained by in-gel digestion with PNGase F of the high glycosylated RNase 1 from PaC A. One aliquot was analyzed directly by NP-HPLC (A) and the remaining were treated with arrays of exoglycosidase enzymes prior to NP-HPLC analysis as indicated in each panel [(B)-(G)]. Reproduced with permission from S. Barrabes, L. Pages-Pons, C. M. Radcliffe, G. Tabares, E. Fort, L. Royle, D. J. Harvey, M. Moenner, R. A. Dwek, P. M. Rudd, R. De Llorens and R. Peracaula, Glycobiology, 2007, 17, 388–400. Copyright 2007 Oxford University Press. | ||
6. Characterization of glycopeptides and glycan sequencing by mass spectrometry
Recent advances in mass spectrometry fragmentation techniques and new instrumentation are facilitating the analysis of post-translationally modified glyocoproteins. A number of comprehensive reviews have been published on the use of mass spectrometry for the analysis of glycoproteins and their glycan structures,79,94 here we provide a brief overview of the subject. The two most widely used ionization methods for structural and quantitative analysis of glycopeptides (glycoproteomics) and released glycans (glycomics) from glycoproteome mixtures are Matrix Assisted Laser Desorption Ionization (MALDI) and Electrospray Ionization (ESI). By means of mass spectrometry it is now possible to obtain detailed information on the site of attachment and occupancy and to determine sequence, glycoform heterogeneity, and type of glycosylation present at each site. The type of the mass analyzer (Ion Trap, quadropole, time of flight (TOF), Fourier transform ion cyclotron resonance (FT-ICR) and ionization method (MALDI or ESI) influence what types of fragment ions will dominate. For example, the types of fragment ions generated in MSn analysis of glycopeptides depend on the fragmentation mechanism95,96 and other factors, such as the glycopeptide's counter ion (H+ or Na+), its charge state, the glycan composition and presence of basic residues in the peptide part.97 Given the wide variation and structural complexity of glycans, a single mass spectrometry technique cannot provide all the details of a glycan structure. Thus, the comprehensive characterization of glycans requires the combination of several MS/MS approaches.98In recent years, tandem MS methods have been increasingly used as valuable tools for glycan profiling in biomarker studies.99 Both MALDI and ESI-MS can be performed in multiple stages to produce tandem spectra of glycans most commonly through collisional-induced dissociation (CID). Two types of fragmentation are induced by CID, glycosidic bond cleavage and cross-ring cleavage. Glycosidic cleavage occurs at the bond linking two sugars, while cross-ring fragmentation involves the cleavage of two different bonds, on the same monosaccharide residue.100 The type of fragmentation ion products are named using the nomenclature proposed by Damon and Costello,101 and are used to define branching, linkage position, and monomer anomericity.
6.1 MALDI-MS
The MALDI ionization technique is generally used on time of flight (TOF)-type mass spectrometers. This method has been used for the analysis of intact glycoproteins, glycopeptides, and native or derivatized N-glycans, by selectively monitoring specific molecular ion masses. Post source decay (PSD) ion fragmentation in MALDI-TOF provides minimal information on the structure of glycans. PSD fragmentation of oligosachrides produces glycosyl cleavages, but no cross-ring fragmentation.102 The lack of cross-ring cleavage makes it very difficult to obtain information on the linkage type information. With the development of the curved-field reflector, it has become possible to obtain linkage details using MALDI-PDS fragmentation of oligosaccharides.103 Its design enabled focusing of a wide mass range of all the ions produced by PSD and allowed the acquisition of well resolved, full PSD fragment ion spectra in a single segment.104 Using the relative ion intensity of MALDI-PSD on TOF mass analyzer the type of linkages can be determined.103 The introduction of MALDI-TOF/TOF tandem MS using CID resulted in superior characterization of native glycans compared to that of MALDI-TOF/MS/MS.102 On TOF/TOF- type of instruments, high energy CID can be applied to influence the fragmentation and the intensity of the ion products. In CID-TOF/TOF experiments, the spectrum is dominated by cross- ring fragmentation products, of the A- and X -type ions.102 The cross-ring fragmentation and their masses are used to determine branching patterns and linkages. Glycosidic cleavage produces ions of the Y, Z type and B,C type, and provides information about the glycan sequence as well as branching.101The glycosidic linkage of sialylated glycans is susceptible to decomposition during MALDI process and also in the flight tube in TOF analyzer. Methyl esterification of sialic acid to produce neutral oligosaccharides has addressed this issue. Methylated sialic acids have ionization efficiencies comparable to that of neutral glycans.63 It has been shown that replacing the hydrogen atoms bound to the oxygen and nitrogen atoms in the oligosaccharide with methyl groups enhances their ionization efficiency due to increasing hydrophobicity and volatility and decreases their ion-source fragmentation. The latter is mainly due to cleavage of glycosidic bonds by reacting with hydroxyl groups.79,105,106 Cleavage of glycosidic bonds in permethylated glycans produces ions that are methylated in all positions except carbons involved in glycosidic bonds. Cross cleavage of the permethylated glycans generates low abundance A and X type ions which are highly valuable in structure determination since their masses are indicative of the linkage position.107 One advantage of derivatization with methyl groups is the relative stability of permethylated glycans under collision-induced dissociation (CID) fragmentation conditions, which yields more informative tandem mass spectra.73 While there are advantages to the derivatization approach, the drawback is differential sample losses.108 In solution, permethylation takes place through glycan deprotonating with NaOH and methylation with methyl iodide in dimethyl sulfoxide (DMSO) with trace water.109 Kang P. et al.110 developed a new procedure in which the permethylation reaction is performed by adding glycans, methyl iodide, and DMSO to a fused-silica capillary packed with NaOH beads. This strategy has been shown to reduce sample losses due to side reactions. This is an important technological advance, because typically the amount of available glycan is the limiting step for comprehensive glycan analysis as only low picomole amounts are typically available for analysis.
Permethylation of glycans allows reliable and reproducible label-free quantitation of released glycans in glycomic profiling studies, as was concluded from a cross-laboratory study sponsored by the Human Proteome Organization (HUPO).63 The MALDI technique also allows spotting of multiple samples and very rapid glycan profiling can be obtained. In A study by Kyselova and co-workers111MALDI-TOF/TOF glycomic profiling of permethylated glycans released from sera of 82 breast cancer patients in different stages and 27 healthy women was performed. They found eight N-glycan structures whose MS peak intensities were significantly different. They identified one high mannose type and the rest were bi and tri-antennary complex structures. All these structures were sialylated and five of them were also fucosylated. They showed that an increase in core and branch fucosylation correlated with cancer progression.
6.2 LC-ESI-MS
Electrospray ionization (ESI) and CID has been applied to MS analysis of glycans using a variety of instruments, such as, ion traps, quadrupole, TOF, and FT-ICR-type instruments.36,112,113 The major advantage of ESI-MS is that it can be coupled with liquid chromatography instruments. Chromatographic separation of glycans and the absence of matrix adduct species produce well resolved MS spectra. This ionization technique is milder than MALDI and results in less unwanted fragmentation. As mentioned above, product ions generated by CID fragmentation provide a great deal of information on the structure of glycans and glycopeptides.72 The MSn capability of the ion traps is used to determine the glycosylation site and microheterogeneity, as well as, site occupancy on glycopeptides resulting from proteolytic digestion of glycoproteins.114 Furthermore, ESI allows qualitative analysis of intact sialic acid-substituted glycans,63 and there is no sample loss due to derivatization.6.3 Identification of site specific glycosylation
Approaches based on MS are now commonly used to identify glycan variants located at specific attachment sites within a defined glycopeptide. Thus, examining the glycan moieties of glycoproteins isolated from disease and controls provides a new way to discover biomarkers. Different instruments and fragmentation techniques are now available to obtain site-specific glycosylation, site heterogeneity, and structural characterization on glycopeptides. A straightforward method to identify the site of glycosylation is to digest the glycopeptides with the enzymes PNGase-F or PNGase-A. During the enzymatic reaction the asparagine (Asn) is hydrolyzed to an aspartic acid (Asp) residue, resulting in a one unit mass shift which can be detected upon LC MS analysis. If the amino acid composition of the glycoprotein is known, then the substitution of Asp for Asn indicates the site of glycosylation.115 However, no information on site-specific glycan structure is obtained. To identify the site and extent (site occupancy) of glycosylation, as well as to obtain structural information on glycopeptides, ESI-LC-MS/MS has proven to be very useful in the characterization of glycopeptides. One approach is to digest the glycoproteins, usually with trypsin, and the resulting mixture of non-glycopeptides and glycopeptides is then separated by HPLC. Because of the the low abundance of certain glycoforms, as well as glycopeptide signal suppresion which occurs with co-eluting high abundance non-glycopeptides,116 it is desirable to decrease the complexity of the sample prior to MS to facilitate the characterization of glycan structure and glycosylation site assignment. Glycopeptides can be enriched using HILIC as described above and interfaced with MS. Alternatively, the complex mixture can be separated by HPLC reversed phase (HPLC-RP) chromatography on-line with ESI-MS. The peptides/glycopeptides are analyzed using a triple quadrupole instrument; peptide precursor ions are scanned in the first quadropole, and then they are passed to the second quadrupole where they are fragmented by CID mechanism. When the instrument is run in precursor ion scan mode, the third quadrupole only allows transmission of specific diagnostic sugar oxonium ion species, such as Hex+ (m/z: 163.06), HexNAc+ (m/z: 204.09), HexHexNAc (m/z: 366.14), and (NeuAc+, m/z: 292).114,117 Once the glycopeptide's ions are detected, the product ion scan mode of the precursor glycopeptides is prompted to obtain the MS/MS spectrum of the glycopeptides which contain information on both peptides and glycan moieties.7. Quantitation in glycoproteomics and glycomics
Relative quantities of glycoproteins/glycans in disease and normal samples can be provided by HPLC and MS. Direct comparison of MS signal intensities of two compounds in two different mass spectra does not offer quantitative information. That is because two different samples have different matrices resulting in different ionization behaviors. This is more prominent in the case of MALDI MS in which sample preparation can be significantly different from run to run. Additionally, MS instrument behavior may vary as a function of time. Well established labeling methods for proteomic quantification (i.e. ICAT and iTRAQ) have been applied to study glycoproteome captured by lectin affinity chromatography or hydrazide chemistry with the goal of finding quantitatively significant difference in the glycoprotein expression and glycan regulation between healthy and disease states.118 Ueda et al.119 labeled serum glycoproteome from lung cancer and healthy controls with commercially available 13C6 and 12C6-NBS (2-Nitrobenzenesulfenyl). The labeled samples were mixed and subjected to MALDI-MS analysis after trypsin digestion and chromatographic separation. In order to be able to distinguish between changes in protein expression and changes in α-1,6-fucosylation, they did the same analysis for glycoproteome enriched by LCA lectin column. The ratio of 13C/12C for paired peptides identified for the second pairs of samples to that of the first pairs of samples indicated relative cancerous alteration of core-fucosylation. Another isotopic labeling technique is to perform glycan removal of glycoproteome in disease and normal controls by PNGase F in H218O/H216O. As an example, Chaerkady et al.120 used this technique for relative quantification of glycoproteome enriched by a lectin column from tumor tissues and adjacent non-cancer liver tissues from a hepatocellular carcinoma patient.In recent years isotope labeling methods have been extended to glycomic quantitation.108 Using 13CH3I/12CH3I labeling for quantitation of different isolated oligosaccharides from human milk has been investigated.121 Kang et al.110 used permethylation with CH3I and CD3I to quantitate N-glycans released from glycoproteins by MALDI-TOF/TOF which enables structural assignment and showed its promising utility for biomarker study by analyzing breast cancer samples.122 A major limitation of differential isotopic methylation is that the mass difference between light and heavy forms of the same glycan structure can be large and variable. This is due to high and variable number of –OH groups available for methylation. This makes it difficult to match heavy and light forms of the same glycan when dealing with complex glycomic mixture. Also this methodology cannot be applied to quantifying isomeric glycans having the same mass but different structures.123 Atwood et al.123 introduced a novel isobaric labeling strategy named quantitation by isobaric labeling (QUIBL) which addresses this issue. In brief, disease and normal glycome sample are labeled with 13CH3I or 12CH2DI, mixed together and are analyzed by MSn. The derivatized glycan pairs have the same nominal mass but different exact mass (Δm = 0.002922 Da for each derivatization site) which can be resolved by high resolution FT-ICR mass spectrometer. Low resolution MS/MS generates a series of fragment ions for two isomeric glycans. High resolution MS analysis of the fragment ion unique to each isomer gives the ratio of differentially labeled forms of each isomer.
An in vivolabeling method for the study of N- and O-linked glycans has been introduced by Orlando et al.124 This strategy is based on feeding living cells with either 15N or 14N Glutamine and thus incorporation of 15N or 14N into hexosamines being synthesized in living cells. This method has a 94% incorporation efficiency and results in a small mass difference (below 10 mass units) between the light and heavy-labeled samples which is desirable in mass spectrometric quantitation. One recent isotope labeling method reported by Xia et al.65 are based on reductive amination of glycans with [12C6] aniline and [13C6] aniline. Studying N-glycans released from human and mouse serum by this method showed that N-glycans are significantly different between human and mouse qualitatively and quantitatively. For example, N-glycans derived from mouse had exclusively NeuGc as their sialic acid rather than NeuAc and had completely different fucosylated and branched structure. A major advantage of this labeling approach over isotopic permethylation is that there is only one labeling site for each glycan (the reducing end of the glycan) resulting in paired glycans easily distinguishable by 6 Da mass difference in the mass spectrum. In addition, the label is a UV-absorbant enabling HPLC quantitation and is compatible with chromatography conditions, unlike the originally reported deuterated amination labels125 which can be resolved under those conditions. Isotopic labeling reagents are expensive and metabolic incorporation of radioisotopes is not possible for clinical samples. For these reasons, efforts have been made to perform label-free quantitation;64,126,127 but having a highly reproducible platform is a prerequisite for such analysis and run to run variation must be smaller than individual sample variations. In a multi-institutional study by Wada et al.,63 different chromatography and MS based methods for quantitations of the same N-linked glycan samples have been compared. This study shows that quantitation of the glycan sample with label-free MALDI-MS results in values comparable to chromatography methods. However, underivitized sialylated glycans tend to decompose either in the ion source or flight tube, and thus, their MS peak area is not well correlated with their concentration. This problem can be overcome by choosing a softer ionization method.
8. Glyco-Informatics
Glycan biosynthesis is not template driven as is DNA transcription into RNA and translation into proteins. There are no glycan databases similar to what is available for analysis of the proteome and therefore this is an area where much development is needed. There are some databases available for assisting interpretation of MS data of glycans, such as the database offered by the Consortium for Functional Glycomics (http://www.functionalglycomics.org/static/index.shtml), or GlycoSuiteDB (http://www.glycosuite.com) (also available on expassy server), and Glycoworkbench (http://www.glycoworkbench.org/). They provide structures of thus far discovered and synthesized glycans and/or permethylated glycans and their masses. Several software tools for semi-automated interpretation of oligosaccharide mass spectra have also been developed. Some of them rely on the library of mass and fragment spectra of previously discovered/synthesized glycans. There are also de novo sequencing tools128 that need proficient knowledge of glycan biosynthesis to restrict the number of suggested structures. Also, several software tools for computing possible glycopeptides structures (considering the glycosylation site heterogeneity) have been developed in the recent years. Automated interpretation of mass spectra of glycans and glycopeptides is still in its early stages.129,130 Efforts in this area are likely to progress rapidly in the near future.9. Conclusion
The last decade has seen significant advancements in methods for studying the glycoproteome and glycome from complex biological matrices. These have offered new opportunities for the identification of glycan-based disease biomarkers and a number of candidate biomarkers have been postulated that are awaiting validation. The high throughput technologies described herein will play a major role in the ability to move these markers to the next stage. The integration of glycoproteomics and glycomic approaches along with new glyco-informatic tools will continue to mature and their application to biological systems will expand the current available biomarkers for the early detection of cancer. Interest in the detailed and comprehensive characterization of glycosylation of plasma proteins will continue to be actively pursued to investigate their utility as potential biomarkers for the early detection of cancer. Which technique or experimental approach to choose for glycopeptides or glycan analysis will depend on the level of analytical sensitivity and information required. The availability of high throughput and LC-MS based techniques will undoubtedly increase knowledge, depth and sensitivity of the analysis of glycan structures that can be detected, sequenced and rapidly quantitated to reveal glycosylation changes associated with cancer.Acknowledgements
This work was supported by National Institutes of Health/National Cancer Institute (NIH/NCI) grants RO1 CA122591 and U01-CA128427 and by the Korean Research WCU grant R31-2008-000-10086-0. Contribution number 971 from the Barnett Institute.References
- R. C. A. Varki, J. Esko, H. Freeze, G. Hart and J. Marth, Essentials of Glycobiology, Cold Spring Harber Laboratory Press, New York, 1999 Search PubMed.
- R. Kornfeld and S. Kornfeld, Annu. Rev. Biochem., 1985, 54, 631–664 CrossRef CAS.
- N. S.a. H. Lis, Lectins, 2nd edn, Dordrecht: Kluwer Academic Publishers, 2003.
- S. Hakomori, Cancer research, 1996, 56, 5309–5318 CAS.
- T. F. Orntoft and E. M. Vestergaard, Electrophoresis, 1999, 20, 362–371 CrossRef CAS.
- A. Knezevic, O. Polasek, O. Gornik, I. Rudan, H. Campbell, C. Hayward, A. Wright, I. Kolcic, N. O'Donoghue, J. Bones, P. M. Rudd and G. Lauc, J. Proteome Res., 2009, 8, 694–701 CrossRef CAS.
- L. M. r. a. E.R. and Mark W. C. Hatton, Trends in Biochemical Sciences, 1983, 8 Search PubMed.
- A. Kuno, N. Uchiyama, S. Koseki-Kuno, Y. Ebe, S. Takashima, M. Yamada and J. Hirabayashi, Nat. Methods, 2005, 2, 851–856 CrossRef CAS.
- D. K. Mandal and C. F. Brewer, Biochemistry, 1993, 32, 5116–5120 CrossRef CAS.
- S. Thompson, E. Dargan and G. A. Turner, Cancer Lett., 1992, 66, 43–48 CrossRef CAS.
- R. R. Drake, E. E. Schwegler, G. Malik, J. Diaz, T. Block, A. Mehta and O. J. Semmes, Mol. Cell. Proteomics, 2006, 5, 1957–1967 CrossRef CAS.
- L. Xiong, D. Andrews and F. Regnier, J. Proteome Res., 2003, 2, 618–625 CrossRef CAS.
- M. Madera, Y. Mechref and M. V. Novotny, Anal. Chem., 2005, 77, 4081–4090 CrossRef CAS.
- M. Kullolli, W. S. Hancock and M. Hincapie, J. Sep. Sci., 2008, 31, 2733–2739 CrossRef CAS.
- E. Johansen, B. Schilling, M. Lerch, R. K. Niles, H. Liu, B. Li, S. Allen, S. C. Hall, H. E. Witkowska, F. E. Regnier, B. W. Gibson, S. J. Fisher and P. M. Drake, J Vis Exp, 2009 Search PubMed.
- M. Kullolli, W. S. Hancock and M. Hincapie, Anal. Chem., 2010, 82, 115–120 CrossRef CAS.
- J. Hirabayashi, Glycoconjugate J., 2004, 21, 35–40 CrossRef CAS.
- I. West and O. Goldring, Methods in molecular biology (Clifton, N.J, 1996, 59, 177–185 Search PubMed.
- K. L. Abbott, K. Aoki, J. M. Lim, M. Porterfield, R. Johnson, R. M. O'Regan, L. Wells, M. Tiemeyer and M. Pierce, J. Proteome Res., 2008, 7, 1470–1480 CrossRef CAS.
- R. D. Cummings and S. Kornfeld, J Biol Chem, 1982, 257, 11235–11240 CAS.
- R. Qiu and F. E. Regnier, Anal. Chem., 2005, 77, 7225–7231 CrossRef CAS.
- Z. Yang and W. S. Hancock, J Chromatogr A, 2004, 1053, 79–88 CrossRef CAS.
- K. Jung, W. Cho and F. E. Regnier, J. Proteome Res., 2009, 8, 643–650 CrossRef CAS.
- D. W. Ralin, S. C. Dultz, J. E. Silver, J. C. Travis, M. Kullolli, W. S. Hancock and M. Hincapie, Clin. Proteomics, 2008, 4, 37–46 Search PubMed.
- M. K. Dayarathna, W. S. Hancock and M. Hincapie, J. Sep. Sci., 2008, 31, 1156–1166 CrossRef CAS.
- C. Ohyama, M. Hosono, K. Nitta, M. Oh-eda, K. Yoshikawa, T. Habuchi, Y. Arai and M. Fukuda, Glycobiology, 2004, 14, 671–679 CrossRef CAS.
- A. Sarrats, J. Comet, G. Tabares, M. Ramirez, R. N. Aleixandre, R. de Llorens and R. Peracaula, Prostate, 2010, 70, 1–9 CrossRef CAS.
- H. Zhang, X. J. Li, D. B. Martin and R. Aebersold, Nat. Biotechnol., 2003, 21, 660–666 CrossRef CAS.
- Y. Zhou, R. Aebersold and H. Zhang, Anal. Chem., 2007, 79, 5826–5837 CrossRef CAS.
- B. Sun, J. A. Ranish, A. G. Utleg, J. T. White, X. Yan, B. Lin and L. Hood, Mol. Cell. Proteomics, 2007, 6, 141–149 CAS.
- Y. Tian, K. Gurley, D. Meany, C. Kemp and H. Zhang, Journal of proteome research, 2009 Search PubMed.
- A. Lee, D. Kolarich, P. A. Haynes, P. H. Jensen, M. S. Baker and N. H. Packer, J. Proteome Res., 2009, 8, 770–781 CrossRef CAS.
- R. Chen, X. Jiang, D. Sun, G. Han, F. Wang, M. Ye, L. Wang and H. Zou, J. Proteome Res., 2009, 8, 651–661 CrossRef CAS.
- M. Tajiri, S. Yoshida and Y. Wada, Glycobiology, 2005, 15, 1332–1340 CrossRef CAS.
- W. Ding, H. Nothaft, C. M. Szymanski and J. Kelly, Mol. Cell. Proteomics, 2009, 8, 2170–2185 CrossRef CAS.
- J. Wohlgemuth, M. Karas, T. Eichhorn, R. Hendriks and S. Andrecht, Anal. Biochem., 2009, 395, 178–188 CrossRef CAS.
- J. Wohlgemuth, M. Karas, W. Jiang, R. Hendriks and S. Andrecht, J. Sep. Sci., 2010, 33, 880–890 CrossRef CAS.
- C. D. Calvano, C. G. Zambonin and O. N. Jensen, J. Proteomics, 2008, 71, 304–317 CrossRef CAS.
- M. R. Larsen, S. S. Jensen, L. A. Jakobsen and N. H. Heegaard, Mol. Cell. Proteomics, 2007, 6, 1778–1787 CrossRef CAS.
- Y. Xu, Z. Wu, L. Zhang, H. Lu, P. Yang, P. A. Webley and D. Zhao, Anal. Chem., 2009, 81, 503–508 CrossRef CAS.
- B. Jerkovic, H. C. Kung and P. H. Bolton, Anal. Biochem., 1998, 255, 90–94 CrossRef CAS.
- M. M. Fuster and J. D. Esko, Nat. Rev. Cancer, 2005, 5, 526–542 CrossRef CAS.
- D. H. Dube and C. R. Bertozzi, Nat. Rev. Drug Discovery, 2005, 4, 477–488 CrossRef CAS.
- S. Hakomori, Proc. Natl. Acad. Sci. U. S. A., 2002, 99, 10231–10233 CrossRef CAS.
- J. W. Dennis, S. Laferte, C. Waghorne, M. L. Breitman and R. S. Kerbel, Science (New York, N.Y, 1987, 236, 582–585 Search PubMed.
- E. Miyoshi, K. Moriwaki and T. Nakagawa, J. Biochem., 2008, 143, 725–729 CAS.
- D. Lopez-Morales, N. Velazquez-Marquez, O. Valenzuela, G. Santos-Lopez, J. Reyes-Leyva and V. Vallejo-Ruiz, Invest Clin, 2009, 50, 45–53 Search PubMed.
- F. L. Wang, S. X. Cui, L. P. Sun, X. J. Qu, Y. Y. Xie, L. Zhou, Y. L. Mu, W. Tang and Y. S. Wang, Cancer Detect. Prev., 2009, 32, 437–443 Search PubMed.
- Y. Qiu, T. H. Patwa, L. Xu, K. Shedden, D. E. Misek, M. Tuck, G. Jin, M. T. Ruffin, D. K. Turgeon, S. Synal, R. Bresalier, N. Marcon, D. E. Brenner and D. M. Lubman, J. Proteome Res., 2008, 7, 1693–1703 CrossRef CAS.
- A. S. Vercoutter-Edouart, M. C. Slomianny, O. Dekeyzer-Beseme, J. F. Haeuw and J. C. Michalski, Proteomics, 2008, 8, 3236–3256 CrossRef CAS.
- O. Blixt, S. Head, T. Mondala, C. Scanlan, M. E. Huflejt, R. Alvarez, M. C. Bryan, F. Fazio, D. Calarese, J. Stevens, N. Razi, D. J. Stevens, J. J. Skehel, I. van Die, D. R. Burton, I. A. Wilson, R. Cummings, N. Bovin, C. H. Wong and J. C. Paulson, Proc. Natl. Acad. Sci. U. S. A., 2004, 101, 17033–17038 CrossRef CAS.
- D. M. Ratner, E. W. Adams, J. Su, B. R. O'Keefe, M. Mrksich and P. H. Seeberger, ChemBioChem, 2004, 5, 379–382 CrossRef.
- W. G. Willats, S. E. Rasmussen, T. Kristensen, J. D. Mikkelsen and J. P. Knox, Proteomics, 2002, 2, 1666–1671 CrossRef CAS.
- S. Angeloni, J. L. Ridet, N. Kusy, H. Gao, F. Crevoisier, S. Guinchard, S. Kochhar, H. Sigrist and N. Sprenger, Glycobiology, 2005, 15, 31–41 CAS.
- J. Zhao, T. H. Patwa, W. Qiu, K. Shedden, R. Hinderer, D. E. Misek, M. A. Anderson, D. M. Simeone and D. M. Lubman, J. Proteome Res., 2007, 6, 1864–1874 CAS.
- Y. Liu, J. He, C. Li, R. Benitez, S. Fu, J. Marrero and D. M. Lubman, Journal of proteome research, 9, pp. 798–805 Search PubMed.
- R. Rosenfeld, H. Bangio, G. J. Gerwig, R. Rosenberg, R. Aloni, Y. Cohen, Y. Amor, I. Plaschkes, J. P. Kamerling and R. B. Maya, J. Biochem. Biophys. Methods, 2007, 70, 415–426 CrossRef CAS.
- S. Chen, T. LaRoche, D. Hamelinck, D. Bergsma, D. Brenner, D. Simeone, R. E. Brand and B. B. Haab, Nat. Methods, 2007, 4, 437–444 CAS.
- A. Kuno, Y. Kato, A. Matsuda, M. K. Kaneko, H. Ito, K. Amano, Y. Chiba, H. Narimatsu and J. Hirabayashi, Mol. Cell. Proteomics, 2009, 8, 99–108 CrossRef CAS.
- M. A. Comunale, M. Wang, J. Hafner, J. Krakover, L. Rodemich, B. Kopenhaver, R. E. Long, O. Junaidi, A. M. Bisceglie, T. M. Block and A. S. Mehta, J. Proteome Res., 2009, 8, 595–602 CrossRef CAS.
- R. Tateishi, H. Yoshida, Y. Matsuyama, N. Mine, Y. Kondo and M. Omata, Hepatology international, 2008, 2, 17–30 Search PubMed.
- W. Morelle and J. C. Michalski, Nat. Protoc., 2007, 2, 1585–1602 Search PubMed.
- Y. Wada, P. Azadi, C. E. Costello, A. Dell, R. A. Dwek, H. Geyer, R. Geyer, K. Kakehi, N. G. Karlsson, K. Kato, N. Kawasaki, K. H. Khoo, S. Kim, A. Kondo, E. Lattova, Y. Mechref, E. Miyoshi, K. Nakamura, H. Narimatsu, M. V. Novotny, N. H. Packer, H. Perreault, J. Peter-Katalinic, G. Pohlentz, V. N. Reinhold, P. M. Rudd, A. Suzuki and N. Taniguchi, Glycobiology, 2007, 17, 411–422 CrossRef CAS.
- R. Goldman, H. W. Ressom, R. S. Varghese, L. Goldman, G. Bascug, C. A. Loffredo, M. Abdel-Hamid, I. Gouda, S. Ezzat, Z. Kyselova, Y. Mechref and M. V. Novotny, Clin. Cancer Res., 2009, 15, 1808–1813 CrossRef CAS.
- B. Xia, C. L. Feasley, G. P. Sachdev, D. F. Smith and R. D. Cummings, Anal. Biochem., 2009, 387, 162–170 CrossRef CAS.
- L. Royle, C. M. Radcliffe, R. A. Dwek and P. M. Rudd, Methods in molecular biology (Clifton, N.J, 2006, 347, 125–143 Search PubMed.
- R. Saldova, L. Royle, C. M. Radcliffe, U. M. Abd Hamid, R. Evans, J. N. Arnold, R. E. Banks, R. Hutson, D. J. Harvey, R. Antrobus, S. M. Petrescu, R. A. Dwek and P. M. Rudd, Glycobiology, 2007, 17, 1344–1356 CrossRef CAS.
- L. Royle, M. P. Campbell, C. M. Radcliffe, D. M. White, D. J. Harvey, J. L. Abrahams, Y. G. Kim, G. W. Henry, N. A. Shadick, M. E. Weinblatt, D. M. Lee, P. M. Rudd and R. A. Dwek, Anal. Biochem., 2008, 376, 1–12 CrossRef CAS.
- K. R. Anumula, Anal. Biochem., 2006, 350, 1–23 CrossRef CAS.
- M. Pabst, D. Kolarich, G. Poltl, T. Dalik, G. Lubec, A. Hofinger and F. Altmann, Anal. Biochem., 2009, 384, 263–273 CrossRef CAS.
- G. R. Guile, P. M. Rudd, D. R. Wing, S. B. Prime and R. A. Dwek, Anal. Biochem., 1996, 240, 210–226 CrossRef CAS.
- M. S. Bereman, T. I. Williams and D. C. Muddiman, Anal. Chem., 2009, 81, 1130–1136 CrossRef CAS.
- J. Zhao, T. H. Patwa, M. Pal, W. Qiu and D. M. Lubman, Methods Mol. Biol., 2009, 492, 321–351 CAS.
- Y. Mechref and M. V. Novotny, Mass Spectrom. Rev., 2009, 28, 207–222 CrossRef CAS.
- A. E. Manzi, S. Diaz and A. Varki, Anal. Biochem., 1990, 188, 20–32 CAS.
- Y. C. Lee, J. Chromatogr., A, 1996, 720, 12.
- M. R. Hardy, R. R. Townsend and Y. C. Lee, Anal. Biochem., 1988, 170, 54–62 CrossRef CAS.
- C. Grey, P. Edebrink, M. Krook and S. P. Jacobsson, J. Chromatogr., B: Anal. Technol. Biomed. Life Sci., 2009, 877, 1827–1832 CrossRef CAS.
- Y. Mechref and M. V. Novotny, Chem. Rev., 2002, 102, 321–369 CrossRef CAS.
- J. R. Thayer, J. S. Rohrer, N. Avdalovic and R. P. Gearing, Anal. Biochem., 1998, 256, 207–216 CrossRef CAS.
- C. Bruggink, R. Maurer, H. Herrmann, S. Cavalli and F. Hoefler, J. Chromatogr., A, 2005, 1085, 104–109 CrossRef CAS.
- B. Barroso, R. Dijkstra, M. Geerts, F. Lagerwerf, P. van Veelen and A. de Ru, Rapid Commun. Mass Spectrom., 2002, 16, 1320–1329 CrossRef CAS.
- L. R. Ruhaak, A. M. Deelder and M. Wuhrer, Anal. Bioanal. Chem., 2009, 394, 163–174 CrossRef CAS.
- C. S. Chu, M. R. Ninonuevo, B. H. Clowers, P. D. Perkins, H. J. An, H. Yin, K. Killeen, S. Miyamoto, R. Grimm and C. B. Lebrilla, Proteomics, 2009, 9, 1939–1951 CrossRef CAS.
- C. J. Edge, T. W. Rademacher, M. R. Wormald, R. B. Parekh, T. D. Butters, D. R. Wing and R. A. Dwek, Proc. Natl. Acad. Sci. U. S. A., 1992, 89, 6338–6342 CrossRef CAS.
- U. M. Abd Hamid, L. Royle, R. Saldova, C. M. Radcliffe, D. J. Harvey, S. J. Storr, M. Pardo, R. Antrobus, C. J. Chapman, N. Zitzmann, J. F. Robertson, R. A. Dwek and P. M. Rudd, Glycobiology, 2008, 18, 1105–1118 CrossRef CAS.
- A. Shah, H. Singh, V. Sachdev, J. Lee, S. Yotsukura, R. Salgia and A. Bharti, Curr. Proteomics, 2010, 7, 49–65 Search PubMed.
- X. Kang, L. Sun, K. Guo, H. Shu, J. Yao, X. Qin and Y. Liu, J. Cancer Res. Clin. Oncol., 2010, 136, 1151–1159 CrossRef CAS.
- T. Fujimura, Y. Shinohara, B. Tissot, P. C. Pang, M. Kurogochi, S. Saito, Y. Arai, M. Sadilek, K. Murayama, A. Dell, S. Nishimura and S. I. Hakomori, Int. J. Cancer, 2008, 122, 39–49 CrossRef CAS.
- R. Kannagi, Glycoconjugate J., 2004, 20, 353–364 CAS.
- O. Gornik, L. Royle, D. J. Harvey, C. M. Radcliffe, R. Saldova, R. A. Dwek, P. Rudd and G. Lauc, Glycobiology, 2007, 17, 1321–1332 CrossRef CAS.
- J. N. Arnold, R. Saldova, U. M. Hamid and P. M. Rudd, Proteomics, 2008, 8, 3284–3293 CrossRef CAS.
- M. J. Duffy, Clin. Chem., 2006, 52, 345–351 CrossRef CAS.
- J. Zaia, Mass Spectrom. Rev., 2004, 23, 161–227 CrossRef CAS.
- K. Hakansson, M. J. Chalmers, J. P. Quinn, M. A. McFarland, C. L. Hendrickson and A. G. Marshall, Anal. Chem., 2003, 75, 3256–3262 CrossRef.
- K. Hakansson, H. J. Cooper, M. R. Emmett, C. E. Costello, A. G. Marshall and C. L. Nilsson, Anal. Chem., 2001, 73, 4530–4536 CrossRef.
- R. R. Seipert, E. D. Dodds, B. H. Clowers, S. M. Beecroft, J. B. German and C. B. Lebrilla, Anal. Chem., 2008, 80, 3684–3692 CrossRef CAS.
- J. Irungu, E. P. Go, Y. Zhang, D. S. Dalpathado, H. X. Liao, B. F. Haynes and H. Desaire, J. Am. Soc. Mass Spectrom., 2008, 19, 1209–1220 CrossRef CAS.
- H. J. An, S. Miyamoto, K. S. Lancaster, C. Kirmiz, B. Li, K. S. Lam, G. S. Leiserowitz and C. B. Lebrilla, J. Proteome Res., 2006, 5, 1626–1635 CrossRef CAS.
- J. Zaia, Chem. Biol., 2008, 15, 881–892 CrossRef CAS.
- B. D.a. C. E. Costello, glycoconjugate journal, 1988, 5, 12.
- Y. Mechref, M. V. Novotny and C. Krishnan, Anal. Chem., 2003, 75, 4895–4903 CrossRef CAS.
- T. Yamagaki and H. Nakanishi, Glycoconjugate J., 1999, 16, 385–389 CrossRef CAS.
- T. J. Cornish and R. J. Cotter, Rapid Commun. Mass Spectrom., 1994, 8, 781–785 CrossRef CAS.
- J. Lemoine, F. Chirat and B. Domon, J. Mass Spectrom., 1996, 31, 908–912 CrossRef CAS.
- I. Ciucanu and C. E. Costello, J. Am. Chem. Soc., 2003, 125, 16213–16219 CrossRef CAS.
- D. Ashline, S. Singh, A. Hanneman and V. Reinhold, Anal. Chem., 2005, 77, 6250–6262 CrossRef CAS.
- R. Orlando, Methods Mol. Biol., 2010, 600, 31–49 CAS.
- I. Ciucanu, Carbohydr. Res., 1984, 131, 8.
- P. Kang, Y. Mechref, I. Klouckova and M. V. Novotny, Rapid Commun. Mass Spectrom., 2005, 19, 3421–3428 CrossRef CAS.
- Z. Kyselova, Y. Mechref, P. Kang, J. A. Goetz, L. E. Dobrolecki, G. W. Sledge, L. Schnaper, R. J. Hickey, L. H. Malkas and M. V. Novotny, Clin. Chem., 2008, 54, 1166–1175 CrossRef CAS.
- N. G. Karlsson, N. L. Wilson, H. J. Wirth, P. Dawes, H. Joshi and N. H. Packer, Rapid Commun. Mass Spectrom., 2004, 18, 2282–2292 CrossRef CAS.
- X. Zheng, S. L. Wu, M. Hincapie and W. S. Hancock, J. Chromatogr., A, 2009, 1216, 3538–3545 CrossRef CAS.
- K. Y. White, L. Rodemich, J. O. Nyalwidhe, M. A. Comunale, M. A. Clements, R. S. Lance, P. F. Schellhammer, A. S. Mehta, O. J. Semmes and R. R. Drake, J. Proteome Res., 2009, 8, 620–630 CrossRef CAS.
- H. Kaji, Y. Yamauchi, N. Takahashi and T. Isobe, Nat. Protoc., 2006, 1, 3019–3027 CAS.
- A. Dell and H. R. Morris, Science (New York, N.Y, 2001, 291, 2351–2356 Search PubMed.
- S. A. Carr, M. J. Huddleston and M. F. Bean, Protein Sci., 1993, 2, 183–196 CAS.
- L. Zhou, R. Beuerman, A. P. Chew, S. K. Koh, T. Cafaro, E. Urrets-Zavalia, J. Urrets-Zavalia, S. Li and H. Serra, Journal of proteome research, 2009 Search PubMed.
- K. Ueda, T. Katagiri, T. Shimada, S. Irie, T. A. Sato, Y. Nakamura and Y. Daigo, J. Proteome Res., 2007, 6, 3475–3483 CrossRef CAS.
- P. J. T. Raghothama Chaerkady, Min-Sik Kim, Anuradha Nalli, Perumal Vivekanandan, Jessica Simmers, Michael Torbenson and Akhilesh Pandey, Clin Proteom, 2008, 4, 18 Search PubMed.
- G. Alvarez-Manilla, N. L. Warren, T. Abney, J. Atwood, 3rd, P. Azadi, W. S. York, M. Pierce and R. Orlando, Glycobiology, 2007, 17, 677–687 CrossRef CAS.
- P. Kang, Y. Mechref, Z. Kyselova, J. A. Goetz and M. V. Novotny, Anal. Chem., 2007, 79, 6064–6073 CrossRef CAS.
- J. A. Atwood, 3rd, L. Cheng, G. Alvarez-Manilla, N. L. Warren, W. S. York and R. Orlando, J. Proteome Res., 2008, 7, 367–374 CrossRef.
- R. Orlando, J. M. Lim, J. A. Atwood3rd, P. M. Angel, M. Fang, K. Aoki, G. Alvarez-Manilla, K. W. Moremen, W. S. York, M. Tiemeyer, M. Pierce, S. Dalton and L. Wells, J. Proteome Res., 2009, 8, 3816–3823 CrossRef CAS.
- M. J. Bowman and J. Zaia, Anal. Chem., 2007, 79, 5777–5784 CrossRef CAS.
- W. M. Old, K. Meyer-Arendt, L. Aveline-Wolf, K. G. Pierce, A. Mendoza, J. R. Sevinsky, K. A. Resing and N. G. Ahn, Mol. Cell. Proteomics, 2005, 4, 1487–1502 CrossRef CAS.
- E. L. Hendrickson, Q. Xia, T. Wang, J. A. Leigh and M. Hackett, Analyst, 2006, 131, 1335–1341 RSC.
- B. Shan, B. Ma, K. Zhang and G. Lajoie, J. Bioinf. Comput. Biol., 2008, 6, 77–91 Search PubMed.
- A. Ceroni, K. Maass, H. Geyer, R. Geyer, A. Dell and S. M. Haslam, J. Proteome Res., 2008, 7, 1650–1659 CrossRef CAS.
- S. Y. Vakhrushev, D. Dadimov and J. Peter-Katalinic, Anal. Chem., 2009, 81, 3252–3260 CrossRef CAS.
Footnote |
| † Electronic supplementary information (ESI) available: Supplementary information. See DOI: 10.1039/c0ay00413h |
| This journal is © The Royal Society of Chemistry 2011 |