Enhanced permanganate chemiluminescence†
Paul S.
Francis
*ab,
Christopher M.
Hindson
a,
Jessica M.
Terry
a,
Zoe M.
Smith
a,
Teo
Slezak
a,
Jacqui L.
Adcock
a,
Bronwyn L.
Fox
b and
Neil W.
Barnett
a
aSchool of Life and Environmental Sciences, Deakin University, Geelong, Victoria 3217, Australia. E-mail: psf@deakin.edu.au; Tel: +61 3 5227 1294
bInstitute for Technology Research and Innovation, Deakin University, Geelong, Victoria 3217, Australia
First published on 7th October 2010
Abstract
The significant enhancement of acidic potassium permanganate chemiluminescence by Mn(II) results from the concomitant presence of permanganate and Mn(III) in the reagent solution, which enables rapid production of the excited Mn(II) emitter with a wide range of analytes. Furthermore, the key Mn(III) co-reactant can be quickly generated by reducing permanganate with sodium thiosulfate, instead of the slow (∼24 h) equilibration required when Mn(II) is used. The emission from reactions with analytes such as tyrosine and fenoterol was over two orders of magnitude more intense than with the traditional permanganate reagent.
The use of acidic potassium permanganate as a chemiluminescence reagent for rapid and highly sensitive detection in flow injection analysis, high performance liquid chromatography and related analytical techniques has increased significantly over the past decade, with several hundred applications now reported.1 Despite this extensive use, the emitting species2,3 and light-producing pathway4 of this reaction have only recently been elucidated. Initial reaction between permanganate and a suitable analyte generates radical intermediates and lower oxidation states of manganese. Subsequent reaction between Mn(III) and an analyte radical produces an electronically excited Mn(II) species responsible for the characteristic emission of red light (λmax = 734 ± 5 nm)2–4 (whereas reaction between Mn(III) and the unoxidised analyte generally results in either very poor or no emission2). In sufficient quantity, sodium polyphosphate increases the emission intensity by preventing flocculation of insoluble Mn(IV) oxides, stabilising Mn(III), and forming protective “cage-like” structures around the emitter that hinder non-radiative deactivation pathways and shift the maximum emission to a more sensitive region of conventional photomultiplier tubes (λmax = 689 ± 5 nm).2,4
Manganese(II) is known to catalyse various reactions with permanganate,5 and the addition of MnSO4 to an acidic potassium permanganate reagent containing sodium polyphosphate provided further increases in chemiluminescence intensity for a range of important analytes (e.g. 5-fold for morphine and 73-fold for synephrine using flow injection analysis methodology).6 The degree of enhancement was found to increase over the first day and then remain constant for at least two days, which was attributed to the formation of intermediate manganese species.6
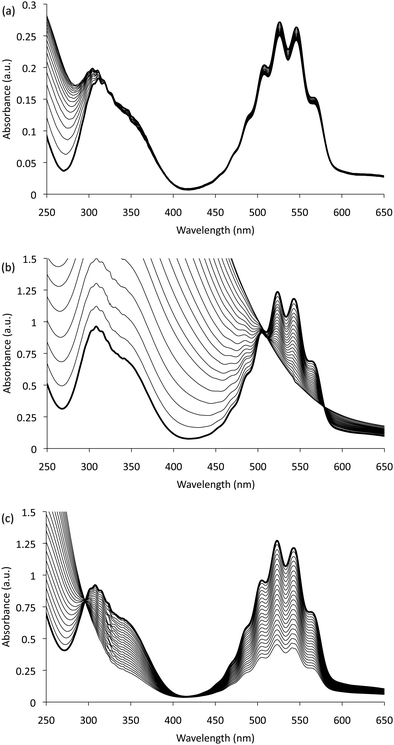
We have confirmed that the product of this slow reaction is Mn(III) by examining the change in the absorption spectrum of the reagent (and similar permanganate solutions) over 48 hours following the addition of Mn(II) (Fig. 1a). In each case, decreases in the structured band (λmax ≈ 525 nm) and region between 325 nm and 385 nm (due to the consumption of permanganate) were accompanied by relatively large increases in the absorbance at lower wavelengths, characteristic of Mn(III) complexes.
 | ||
| Fig. 1 Absorption spectra for: (a) 0.1 mM KMnO4 (with 1% (m/v) sodium polyphosphate, adjusted to pH 2.5 with sulfuric acid) measured every 30 min for 48 hours following the addition of 0.6 mM MnSO4 (only every 6thspectrum shown); (b) stepwise addition of Na2S2O3 (18.8 mM, 1 mL per step) into KMnO4 (0.5 mM, 2 L); and (c) stepwise addition of Na2S2O3 into KMnO4 containing 1% (m/v) sodium polyphosphate. In each case the first spectrum is shown in bold. | ||
The accumulation of Mn(IV) was ruled out due to the absence of significant absorption at 425 nm, which in contrast can be clearly seen under the conditions employed by Perez-Benito et al.7 to create a soluble (colloidal) form of Mn(IV) from permanganate and thiosulfate (Fig. 1b). Interestingly, when 1% (m/v) sodium polyphosphate was added to the permanganate solution prior to thiosulfate (to provide conditions more akin to those of the chemiluminescence reagent), the spectra again showed the appearance of Mn(III) (Fig. 1c), without the long equilibration time required when adding Mn(II). The shift in the isosbestic point from approximately 321 nm in Fig. 1a to 297 nm in Fig. 1c arises from the different stoichiometric ratios of permanganate to Mn(III) in the two reactions. When permanganate is reduced by Mn(II), only a fifth of the Mn(III) product is derived from the oxidant, whereas when thiosulfate is used, permanganate is the only source of Mn(III).
We previously found that the addition of 0.6 mM Mn(II) to a 1 mM permanganate solution (containing 1% sodium polyphosphate and adjusted to pH 2.5) generally gave the greatest increases in chemiluminescence intensity.6 Assuming complete reaction, this provides final concentrations of 0.85 mM permanganate and 0.75 mM Mn(III)—significant pools of the two key manganese species that produce and consume the reactive analyte radical to generate the electronically excited Mn(II) emitter.4
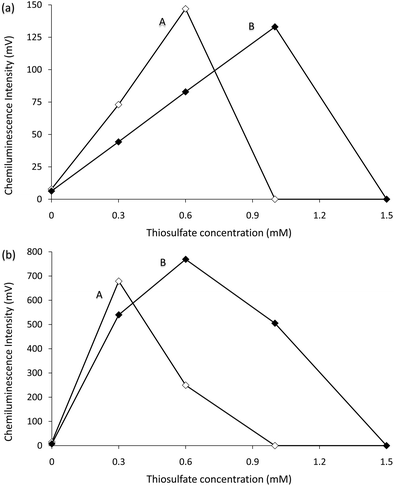
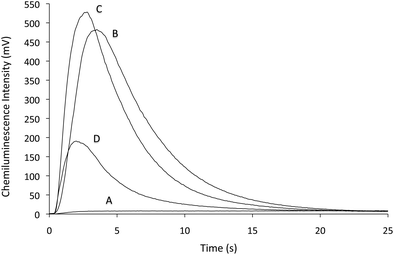
The above experiments also revealed a near-instantaneous approach to prepare the permanganate–Mn(III) reagent, using thiosulfate (instead of Mn(II), which required 24 hours to react with the permanganate6). An evaluation of reagent conditions using flow injection analysis‡ showed that the optima were analyte dependent, but in general, greater concentrations of permanganate required the addition of more thiosulfate to achieve similar enhancement (Fig. 2). Stopped-flow experiments showed that up to a certain concentration, increases in thiosulfate (and hence Mn(III)) produced a more rapid and intense emission (Fig. 3).§ Further increases in thiosulfate concentration continued to reduce the time required to reach maximum emission, but also reduced the peak intensity (height) and overall light emitted (integrated signal) (Fig. S1, see ESI†), until no chemiluminescence was observed due to the complete consumption of permanganate, which was visually observed as a loss of the characteristic purple colour during preparation of the reagent.
 | ||
| Fig. 2 Chemiluminescence intensities for (a) 1 µM morphine and (b) 10 µM synephrine with reagents containing different concentrations of KMnO4 and Na2S2O3, using flow injection analysis methodology. A = 1.0 mM KMnO4. B = 1.9 mM KMnO4. Each reagent contained 1% (m/v) sodium polyphosphate and was adjusted to pH 2.5 with H2SO4 prior to the addition of Na2S2O3. Note: 1.3 mM and 1.6 mM KMnO4 produced intermediate values (not shown). | ||
 | ||
| Fig. 3 Intensity versus time profiles for 10 µM synephrine with reagents prepared from 1.9 mM KMnO4 and (A) 0 mM, (B) 0.3 mM, (C) 0.6 mM and (D) 1.0 mM Na2S2O3. Each reagent contained 1% (m/v) sodium polyphosphate and was adjusted to pH 2.5 with H2SO4 prior to the addition of Na2S2O3. | ||
As we were most interested in the enhancement of chemiluminescence with compounds such as synephrine that react slowly with the conventional permanganate reagent, subsequent experiments were conducted using a reagent prepared with 1.9 mM potassium permanganate and 0.6 mM sodium thiosulfate (unless otherwise stated). The stability of the reagent was assessed by monitoring the chemiluminescence intensity from the reaction with morphine using an automated sequential injection analysis system.§ A set of five replicate injections was performed each hour for 48 hours following the addition of thiosulfate. Unlike the reagent prepared with Mn(II),6 the addition of thiosulfate produced an immediate large increase in the chemiluminescence signal that did not change significantly over the period of the experiment (a change of <1% based on the line of best fit) (Fig. S2†), and the relative standard deviation for the 49 sets of five signals was 0.7%. Similar results were obtained when monitoring the reaction with synephrine for 18 hours (<0.1% change, 1.3% RSD).
The previously observed enhancement in chemiluminescence intensity after adding Mn(II) to the permanganate reagent was less than an order of magnitude for phenols containing orthohydroxy or alkoxy groups (e.g.morphine, dopamine, resveratrol, quercetin and caffeic acid). However, much greater increases in intensity (21- to 73-fold) were obtained for the simple phenol tyramine and three closely related compounds (octopamine, synephrine and hordenine).6 Comparison of the chemiluminescence intensities obtained from the permanganate reagents (with and without the addition of Mn(II) or thiosulfate) upon reaction with various simple phenols and related species using flow injection analysis methodology‡ confirmed that (i) thiosulfate is a viable alternative to Mn(II) as an enhancer for permanganate chemiluminescence, and (ii) increases of well over an order of magnitude can be obtained for a wide range of phenolic compounds (Fig. 4).
 | ||
| Fig. 4 Chemiluminescence intensity with 1 mM KMnO4 (white columns), 1.9 mM KMnO4 (light grey columns), 1 mM KMnO4 and 0.6 mM MnSO4 (dark grey columns), and 1.9 mM KMnO4 and 0.6 mM Na2S2O3 (black columns), using flow injection analysis methodology. All reagents contained 1% (m/v) sodium polyphosphate and were adjusted to pH 2.5 with H2SO4. All analytes were tested at a concentration of 10 µM, except for morphine (1 µM). A flow rate of 3.5 mL min−1 per line was used for all experiments. To prepare the thiosulfate enhanced chemiluminescence reagent, 0.6 mL of 0.1 M Na2S2O3 was added to 100 mL of a 1.9 mM KMnO4 reagent that contained 1% (m/v) sodium polyphosphate and was adjusted to pH 2.5 with H2SO4. | ||
This approach not only provides a breakthrough in sensitivity for existing applications of acidic potassium permanganate chemiluminescence detection, but will also enable its extension to a multitude of new analytes. The greatest enhancement (160-fold) was obtained for the phenolic amino acid tyrosine (using 1.9 mM permanganate and 0.6 mM thiosulfate, compared to 1 mM permanganate). The limits of detection for this analyte were improved from 2 × 10⁻⁷ M to 4 × 10⁻⁹ M,¶ which is over an order of magnitude superior than previously reported values with acidic potassium permanganate.8 Similarly, the chemiluminescence intensity for fenoterol (a sympathomimetic β2 agonist that has not previously been determined with permanganate chemiluminescence) was increased by 106-fold (at 1 × 10⁻⁵ M) and the limit of detection was improved from 5 × 10⁻⁸ M to 1 × 10⁻⁹ M.
Notes and references
- J. L. Adcock, P. S. Francis and N. W. Barnett, Anal. Chim. Acta, 2007, 601, 36 CrossRef CAS.
- N. W. Barnett, B. J. Hindson, P. Jones and T. A. Smith, Anal. Chim. Acta, 2002, 451, 181 CrossRef CAS.
- J. L. Adcock, P. S. Francis, T. A. Smith and N. W. Barnett, Analyst, 2008, 133, 49 RSC; J. L. Adcock, P. S. Francis and N. W. Barnett, J. Fluoresc., 2009, 19, 867 CrossRef CAS.
- C. M. Hindson, P. S. Francis, G. R. Hanson, J. L. Adcock and N. W. Barnett, Anal. Chem., 2010, 82, 4174 CrossRef CAS.
- S. A. Farokhi and S. T. Nandibewoor, Can. J. Chem., 2004, 82, 1372 CrossRef CAS; K. A. Kovács, P. Gróf, L. Burai and M. Riedel, J. Phys. Chem. A, 2004, 108, 11026 CrossRef; I. B. Agater, R. A. Jewsbury and K. Williams, Anal. Commun., 1996, 33, 367 RSC.
- T. Slezak, J. M. Terry, P. S. Francis, C. M. Hindson, D. C. Olson, D. K. Wolcott and N. W. Barnett, Anal. Chem., 2010, 82, 2580 CrossRef CAS.
- J. F. Perez-Benito, E. Brillas and R. Pouplana, Inorg. Chem., 1989, 28, 390 CrossRef CAS.
- J. W. Costin, P. S. Francis and S. W. Lewis, Anal. Chim. Acta, 2003, 480, 67 CrossRef CAS.
- J. M. Terry, J. L. Adcock, D. C. Olson, D. K. Wolcott, C. Schwanger, L. A. Hill, N. W. Barnett and P. S. Francis, Anal. Chem., 2008, 80, 9817 CrossRef CAS.
Footnotes |
| † Electronic supplementary information (ESI) available: Comparison of peak heights and areas of intensity versus time profiles using different reagent conditions, and an examination of reagent stability. See DOI: 10.1039/c0an00588f |
| ‡ Flow injection analysis experiments were conducted using a two-line manifold comprising peristaltic pump, 6-port injection valve (with 70 µL loop), and a GloCel chemiluminescence detector with dual-inlet serpentine flow cell (Global FIA, USA).9 This configuration merges the solutions in front of the photodetector, avoiding the possibility that significant emission will occur before the reacting solution enters the detection zone. |
| § Stopped-flow experiments and reagent stability studies were performed as previously described.6 |
| ¶ Flow rates were optimised for each analyte with each reagent prior to preparing calibration curves. |
| This journal is © The Royal Society of Chemistry 2011 |
