DOI:
10.1039/C0AN00448K
(Paper)
Analyst, 2011,
136, 140-147
Aptamer-barcode based immunoassay for the instantaneous derivatization chemiluminescence detection of IgE coupled to magnetic beads
Received
26th June 2010
, Accepted 6th September 2010
First published on 13th October 2010
Abstract
We report on a highly sensitive aptameric assay system for the determination of IgE, where a special chemiluminescence (CL) reagent, 3,4,5-trimethoxylphenylglyoxal (TMPG), acts as the signaling molecule and polystyrene beads as the amplification platform. Briefly, a “sandwich-type” detection strategy is employed in our design, where magnetic beads functionalized with a capture antibody were reacted with the target protein IgE, and then sandwiched with the aptamer-barcodes which were prepared by assembling polystyrene beads with IgE aptamer. The target immunoreaction event could be sensitively detected via an instantaneous derivatization reaction between TMPG and the guanine (G) nucleotides within the aptamer-barcodes to form an unstable CL intermediate for the generation of light. Further signal amplification is achieved by extending the G nucleotide-rich domain on the aptamer backbone for second amplification. Such simple amplified CL transduction allows the detection of IgE down to the 4.6 pM level, which is better than most previous aptameric methods for IgE detection. This new protocol also provides a good capability in discriminating IgE from nontarget proteins such as IgG, IgA, IgM, interferon and thrombin. The practical application of the proposed aptamer-barcode based immunoassay was successfully carried out for the determination of IgE in 20 human serum samples. It is straightforward to adapt this strategy to detect a spectrum of other proteins by using different aptamers, thus this method may offer a new direction in designing high-performance CL aptasensors for early diagnoses of diseases.
Introduction
Traditionally, nucleic acids are employed as molecular recognition elements for the detection of DNA and RNA targets through Watson–Crick base pairing. Over the past two decades, several interesting discoveries, such as ribozymes, deoxyribozymes and DNA or RNA aptamers, have extended the application of nucleic acid probes as unique biorecognition elements.1Aptamers are synthetic DNA/RNA oligonucleotides obtained from random sequence nucleic acid libraries by an in vitro evolution process, named systematic evolution of ligands by exponential enrichment (SELEX).2,3 They can fold into well-ordered, three-dimensional molecular architectures in which the ligand becomes an intrinsic part of the nucleic acid structure, reflecting the high specificity and affinity for special ligand recognition.4 Thus a large number of aptamers with high specificity and affinity of some given targets ranging from small molecules to large proteins and even intact viruses or cells have been selected in the past few years.5 Comparable to antibodies but much easier to obtain, aptamers have the obvious advantages of high affinity, chemical stability, simple modifiability and high flexibility for the development of molecular tools for analytical chemistry.6–9 Since the first application of aptamers in the enzyme-linked aptamer assay (ELAA) was introduced,10nucleic acid aptamers have been widely used as a distinct tool in a range of analytical techniques, including affinity capillary electrophoresis (CE),11–13 capillary chromatography,14HPLC,15,16 fluorescence,17,18 and quartz crystal microbalance (QCM).19Aptamers offer excellent prospects for protein detection because of their high selectivity and affinity toward their targets.
IgE herein serves as a representative model target for testing new analytical techniques due to urgent needs for its rapid detection in clinical diagnostics. A large and increasing proportion of the population, now around one in three, suffers from allergies, which has heightened researchers' interest in IgE, the central player in the allergic response, thought to have evolved in mammals as the first line of defense against pathogens.20IgE is the immunoglobulin component found in the lowest levels in human serum, however, it significantly increases in patients afflicted with allergic asthma, atopic dermatitis, and other immune deficiency-related diseases, such as AIDS.21,22 Rapid detection of IgE is of great importance in dealing with patients with allergy-mediated disorders,23 and arouses the great appeal of researchers. There are several reports on successful DNA aptamer-based aptasensors for IgE. For example, a quartz crystal microbalance (QCM)-based aptasensor offered a detection limit of 500 pM24 while a label-free aptasensor based on aptamer-modified carbon nanotube field-effect transistors (CNT-FETs) yielded a detection limit of 250 pM.25 In order to function in real-world applications, a sensor must achieve acceptable sensitivity, specificity, and selectivity. Although all the above methods have demonstrated specific IgE detection with practically useful working ranges, the development of a robust assay with improved analytical properties is still an area of great interest from the view point of practical application.
Magnetic beads (MB) as special biomolecule immobilizing carriers offer a promising alternative to conventional methodology. MB have been used in immunoassays, enzyme, DNA, and protein immobilization, DNA purification, and magnetically controlled transport of anticancer drugs.26 Csordas et al.27 coupled microfluidic magnetic sample preparation with highly specific aptamer-based molecular recognition and quantitative PCR for the detection of platelet-derived growth factor. Fan et al.28 also used MB for the noncompetitive immunoassay of human IgG by taking advantage of a magnetic separation/mixing process and the amplification features of a colloidal gold label. In this article, we report a chemiluminescence (CL) biosensing platform for the detection of IgE, based on a highly sensitive aptameric bio-barcode assay system. The CL aptasensor carrier, carboxyl-terminated MB, with a large surface area could bind a large number of anti-IgE antibodies. Polystyrene nanoparticles labeled with IgE aptamers, as a unique ‘barcode’ identifier sequence, could sandwich the target with the antibodies. As a special CL reagent, 3,4,5-trimethoxyl-phenylglyoxal (TMPG), was added to react directly with guanine nucleobases (G bases) and then emit transient CL light.29–31 Therefore, compared to traditional bio-barcode analytical techniques, a series of complicated releasing processes32–36 was avoided in our instantaneous derivatization CL immunoassay. These attractive advantages endow the developed CL aptamer-barcode based platform with additional design flexibility and great operation convenience, making the proposed sensing scheme a promising protocol for the development of diverse aptameric systems. The optimization and attractive performance characteristics of the proposed aptameric sensing scheme are reported in the following sections.
Experimental
Materials and reagents
All chemicals were of analytical grade and were used as received. All of the solutions were prepared with ultrapure water from a Millipore system. Carboxyl-terminated MB (1.5 μm, 20 mg mL−1) were purchased from Polysciences (Warrington, PA). Streptavidin coated polystyrene nanoparticles (PS-SA, 130 and 490 nm, 10 mg mL−1) were purchased from Bangs Laboratories, Inc (Fishers, IN, USA). Human IgE protein was purchased from Abcam (Cambridge, UK) and mouse anti-human IgE monoclonal antibody was purchased from Sigma-Aldrich (32 mg mL−1, St. Louis, MO, USA). 1-Ethyl-3-(3-dimethylamino-propyl) carbodiimide (EDC) was purchased from Sigma-Aldrich, and TMPG was synthesized as described previously.37 Bovine serum albumin (BSA) was bought from Sino-American Biotechnology Co. and other reagents were bought from Sinopharm Chemical Reagent Co. Ltd. (Shanghai, China). Particle-enhanced turbidimetric immunoassay (PETIA) reagent kits for IgE were provided by Shanghai Shenergy-Diasys Diagnostic Technology Co. Ltd., China. Human serum samples were supplied by Zhongshan Hospital, Fudan University.
Oligonucleotides were obtained from Invitrogen Biotechnology Co., Ltd (Shanghai, China), and had the following sequences (Table 1). 0.01 M phosphate buffer solution (PBS, pH 7.4) was used as incubating buffer, and PBSTW (PBS containing 0.05% Tween 20) was used as a wash buffer.
Table 1
DNA sequences used in this work
|
Aptamer name |
Aptamer sequence |
|
Aptamer G0 |
5′-Biotin-GGG GCA CGT TTA TCC GTC CCT CCT AGT GGC GTG CCC C-3′ |
|
Aptamer G5 |
5′-Biotin-GGTGGTGT GGG GCA CGT TTA TCC GTC CCT CCT AGT GGC GTG CCC C-3′ |
|
Aptamer G10 |
5′-Biotin-(GGT)5 GGG GCA CGT TTA TCC GTC CCT CCT AGT GGC GTG CCC C-3′ |
|
Aptamer G30 |
5′-Biotin-(GGT)15 GGG GCA CGT TTA TCC GTC CCT CCT AGT GGC GTG CCC C-3′ |
|
Aptamer
G50
|
5′-Biotin-(GGT)25 GGG GCA CGT TTA TCC GTC CCT CCT AGT GGC GTG CCC C-3′ |
Immobilization of the capture antibody onto MB
In a typical experiment, 30 μg of the carboxyl-terminated MB were first washed 3 times with 150 μL of 0.1 M imidazole buffer (pH 6.0) and then activated in 15 μL of imidazole buffer containing 0.033 M EDC with gentle shaking for 20 min. The activated MB were washed 5 times with 150 μL imidazole buffer and then 50 μL of 500-fold dilution capture anti-IgE was added and incubated with the activated beads for 1 h at 37 °C. The bead-capture antibody was washed 3 times with 150 μL of wash buffer and resuspended in 50 μL of PBS containing 10% BSA for 1 h to minimize nonspecific adsorption effects, and the conjugates were resuspended in 50 μL of PBS before use.
Preparation of aptamer-barcodes
Aptamer-barcodes were synthesized via the well-known streptavidin-biotin chemistry as follows. Briefly, 30 μg of PS-SA was washed with 150 μL of PBSTW, centrifuged to discard the supernatant and then resuspended in 50 μL of PBS. After that, 75 pmol of aptamer sequences were added into the solution of PS-SA and allowed to self-assemble onto the surface of the PS-SA for 1 h in 100 μL of PBS at 37 °C. The resultant conjugates (aptamer-barcodes) were washed 3 times and resuspended in 100 μL of PBS before use.
Aptamer-barcode-based CL assay
In a typical experiment, 50 μL of the above-prepared MB conjugates were transferred into a microtube, and then different concentrations of human IgE or nontarget protein was added into each microtube (50 μL per tube, in PBS containing 10 mM MgCl2). Following a 1 h incubation with gentle mixing at 37 °C, the resultant MB-capture antibody-IgE conjugates were washed 3 times with 150 μL of PBSTW. After that, the supernatant was aspirated and discarded, and the resultants were then allowed to react with 100 μL of the as-above prepared aptamer-barcodes for 1 h at 37 °C. Before detection, the hybrid-conjugated beads were washed 3 times with wash buffer and were transferred into 14 × 40 mm glass tubes with 90 μL of TMPG (30 mM in DMF).
CL measurement
The CL detection was carried out with a BPCL CL analyzer (Beijing, China). 9 μL of tetrabutylammonium hydroxide-phosphate buffer (pH 8.5) was added into the tube and the tube was placed in the luminescence reader. The CL signal was then integrated for 10 s.
Results and discussion
A “sandwich-type” detection strategy is employed in our design, which involves the capture antibody immobilized on the MB surface and the aptamer sequences loaded on PS-SA, i.e. the aptamer-barcode, both of which flank the target protein (Scheme 1). Prior to the binding of the capture antibody, the MB is activated by EDC. As a result, in the presence of the target protein, the capture antibody brings the target protein, along with the aptamer-barcodes, proximal to the MB surface. Since a single PS-SA is loaded with thousands of aptamer strands, this offers a significant amplification for the detection of the target protein. In contrast, in the absence of the target protein, the sandwich complex cannot be formed, leaving the surface-confined capture antibody unbound. After that, TMPG reacts with G bases of the aptamer-barcodes on the MB surface to form an unstable CL intermediate for the generation of light. By employing this strategy, we demonstrate that this aptameric assay system is reproducible, stable, easy to use, and can sensitively detect attomolar levels of the target protein with excellent selectivity.
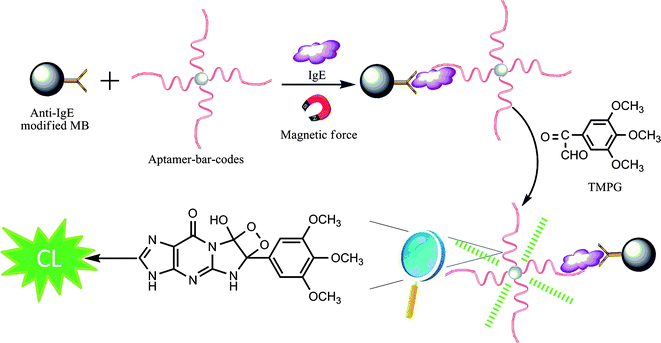 |
| | Scheme 1 Schematic representation of the aptamer-barcode-based immunoassay for the instantaneous derivatization CL detection of IgE coupled to MB | |
Optimization of the reaction parameters
Several parameters were optimized systematically for a highly sensitive approach for the detection of the target protein, including amounts of MB, capture antibody, PS-SA, aptamer-barcode, and Mg2+ ions, etc.
Effect of the MB amounts on CL intensity
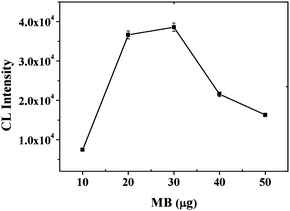
With the activation of EDC, a series of MB amounts were investigated (Fig. 1). CL intensity was observed to increase at the beginning with the increase of the MB amount, and then maintained an approximately steady level between 20–30 μg of MB. After that, however, the CL intensity decreased rapidly, possibly due to quenching of CL by an internal filter effect created from the excess of MB. Thus, subsequent work employed 30 μg MB.
 |
| | Fig. 1
CL intensity vs. the MB amount. Experimental conditions: 200-fold dilution of anti-IgE, 30 μg of 130 nm PS-SA, 60 pmol of aptamer G0, 1 mM Mg2+ ions in PBS and 10 nM IgE. The detection procedure was carried out as described in the Experimental Section. | |
Effect of dilution of anti-human IgE monoclonal antibody
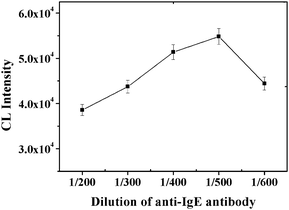
The amount of capture antibody on the MB plays an important role in the performance of the immunoassay. A range of quantities of anti-human IgE monoclonal antibody were investigated as shown in Fig. 2. CL intensity was observed to initially increase with the increase of dilution of the capture antibody, reaching a maximum at a 500-fold dilution of the capture antibody. Further increases in the dilution of the capture antibody to a 600-fold dilution caused a decrease in the number of sandwiched complexes formed on the MB and correspondingly the CL intensity. We attribute this decrease to a low density of capture antibody on the surface of a single MB, decreasing the reaction efficiency between the surface-bound capture antibody and the target protein. Thus, a 500-fold dilution of the capture antibody, i.e 3.2 μg anti-IgE in 50 μL imidazole buffer, was selected for subsequent experiments. The estimated capture antibody density on the surface of MB was calculated to be 3.2 μg anti-IgE/30 μg MB = 0.107 μg capture antibody μg−1MB.
 |
| | Fig. 2
CL intensity vs. the dilution of capture antibody. Experimental conditions: 30 μg MB, 30 μg of 130 nm PS-SA, 60 pmol of aptamer G0, 1 mM Mg2+ ions in PBS and 10 nM IgE. The detection procedure was carried out as described in the Experimental Section. | |
Effect of the diameter of the PS-SA
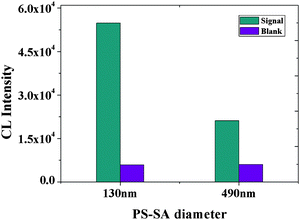
Two different diameters of PS-SA (130 and 490 nm) were comparatively investigated to see how the size of PS-SA microspheres affected the CL intensity. As Bangs Laboratories indicated that theoretically, one 490 nm-diameter PS-SA approximately bears 46371 biotinylated aptamer sequences whereas one 130 nm-diameter PS-SA only binds 2756 sequences, indicating that the CL intensity per 490 nm-diameter particle should be 16.8 times higher than that per 130 nm-diameter particle. Assuming that the number of PS-SA combined on each MB surface are almost the same after immunoreaction no matter whether 130 nm or 490 nm particles are employed, CL intensity in the 490 nm-diameter PS-SA-based system should be around 16.8 times higher than that of the 130 nm-diameter PS-SA-based system. However, Fig. 3 clearly shows that the CL intensity of the 130 nm PS-SA was 2.6 times higher than that of the 490 nm PS-SA, although the background signal was almost the same for both particles. Based on this fact, we can speculate that the number of 130 nm-diameter PS-SA per MB surface was estimated to be around 16.8 × 2.6 = 43.7-fold higher than that of 490-nm-diameter PS-SA per MB surface. We attribute this phenomenon to the effect of particle size. Considering that the particle size per 490 nm-diameter PS-SA is about 53-fold bigger than that per 130-nm-diameter particle, the number of 490 nm-diameter PS-SA on the MB surface will be 53-fold less than that of 130-nm-diameter PS-SA on the same MB surface. Hence, our experimental value (43.7-fold) is very close to the theoretical one (53-fold) and the CL intensity in our experiments was thus decided by three factors, i.e. particle size and particle number, and more importantly the surface area per MB. Moreover, we can also predict that, by further increasing the IgE concentration, the binding sites per MB surface will be progressively saturated and accordingly a constant CL intensity will be reached after IgE saturation, no matter whether the 130-nm-diameter or 490-nm-diameter PS-SA is used. Our following experimental results confirm this prediction, i.e. at concentrations higher than 20 nM IgE, the CL intensity leveled off without any obvious increase. Subsequent experiments employed 130 nm PS-SA.
 |
| | Fig. 3
CL intensity vs. the diameter of PS-SA. Experimental conditions: 30 μg MB, 500-fold dilution of anti-IgE, 30 μg of PS-SA, 60 pmol of aptamer G0, 1 mM Mg2+ ions in PBS and 10 nM IgE. The detection procedure was carried out as described in the Experimental Section. | |
Surprisingly, the effect of steric hindrance on the CL intensity is insignificant for the 490 nm-diameter particle as compared to the 130 nm-diameter one, most possibly this means that protein binding was only slightly affected by particle modification in the IgE aptamer, unlike the signaling aptamer/protein binding by a molecular light switch complex where the intercalation of [Ru(phen)2(dppz)]2+ probes into the aptamer was blocked by IgE binding.38 We attributed this difference to the loop-stem structure of the IgE aptamer (Scheme 2), where particle modification scarcely affects the base pairing on the aptameric stem end and is also far from the protein binding center which is close to the aptameric loop, whereas [Ru(phen)2(dppz)]2+ intercalation into the aptamer helix seriously affects protein binding.
![The proposed binding mode among IgE, anti-IgE aptamer and the PS-SA or [Ru(phen)2(dppz)]2+.](/image/article/2011/AN/c0an00448k/c0an00448k-s2.gif) |
| | Scheme 2 The proposed binding mode among IgE, anti-IgE aptamer and the PS-SA or [Ru(phen)2(dppz)]2+. | |
Effect of the amount of aptamer-barcodes
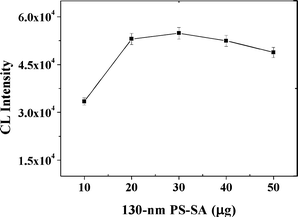
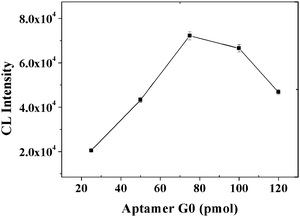
The effects of the amounts of PS-SA and aptamer sequences were subsequently examined and optimized. First, the CL intensity increased in the range of 10–30 μg of PS-SA and then decreased (Fig. 4). Considering the decrease of the CL intensity at amounts larger than 30 μg PS-SA, these results suggest that the number of aptamer sequences per particle began to decrease from the excess of PS-SA and thus led to a decrease in the CL intensity. Second, CL intensity increased with an increasing amount of aptamer sequences over the range of 25 to 75 pmol, and then decreased, possibly due to the more tightly packed aptamer DNA on the PS-SA surface limiting access to the surface-bound aptamer DNA by the target protein (Fig. 5). Thus, 30 μg of PS-SA and 75 pmol of biotinylated aptamer sequences were selected in further studies.
 |
| | Fig. 4
CL intensity vs. the 130 nm PS-SA amount. Experimental conditions: 30 μg MB, 500-fold dilution of anti-IgE, 60 pmol of aptamer G0, 1 mM Mg2+ ions in PBS and 10 nM IgE. The detection procedure was carried out as described in the Experimental Section. | |
 |
| | Fig. 5
CL intensity vs. the amount of aptamer G0. Experimental conditions: 30 μg MB, 500-fold dilution of anti-IgE, 30 μg of 130 nm PS-SA, 1 mM Mg2+ ions in PBS and 10 nM IgE. The detection procedure was carried out as described in the Experimental Section. | |
Effect of the concentration of Mg2+ ions
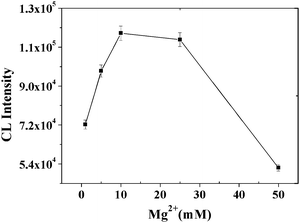
We also noticed that the addition of MgCl2 in the binding reaction has great impact on the CL intensity. The results in the presence of MgCl2 had obvious differences from those in the absence of MgCl2 (Fig. 6), possibly due to the participation of suitable Mg2+ ions being critical to the stabilization of the aptamer complex's stereo-structure.39,40 The concentration of Mg2+ ions was optimized to give the highest CL intensity, which was achieved in the range of 10–30 mM of Mg2+ ions. Further increasing the concentration of Mg2+ ions decreased the CL intensity rapidly, which was in accordance with the previous reports,41–43 that is, a high ionic strength is disadvantageous for the binding of aptamer to IgE protein.
 |
| | Fig. 6
CL intensity vs. the concentration of Mg2+ ions in PBS. Experimental conditions: 30 μg MB, 500-fold dilution of anti-IgE, 30 μg of 130 nm PS-SA, 75 pmol of aptamer G0 and 10 nM IgE. The detection procedure was carried out as described in the Experimental Section. | |
Dependence of CL intensity on the number of G bases in the aptamer molecules
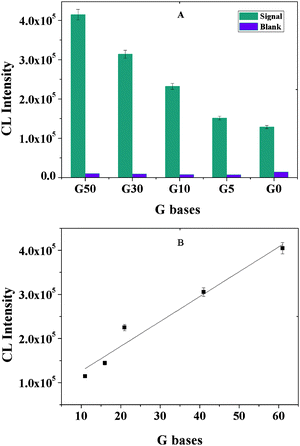
Since our signaling mechanism is based on an instantaneous derivatization reaction between the specific CL reagent TMPG and G base within the aptamer-barcodes on the MB surface, the CL intensity should be dependent on and approximately proportional to the number of G bases on the aptamer backbone. Hence, further extending the G nucleotide-rich regions on the aptamer backbone could enhance the CL intensity and correspondingly the detection sensitivity, thus five aptamer sequences with different numbers of G bases were designed and investigated in the following experiments. One can predict that increasing the length of the G base-rich regions on the aptamer backbone produces an increase in the CL intensity. In agreement with that prediction, the CL intensity in Fig. 7 increases with increasing length of the G base-rich regions on the aptamer backbone, and is approximately linear to the number of G bases (y = 5630x + 69828; R2 = 0.9530). Higher CL intensity requires further increasing the length of the G base-rich regions on the aptamer backbone; however, using the aptamer that is longer than a 112-base probe sequence makes this method complex and rather impractical. Thus, we chose G50 in the subsequent experiments.
 |
| | Fig. 7
CL intensity vs. the number of G bases on the aptamer sequences. Experimental conditions: 30 μg MB, 500-fold dilution of anti-IgE, 30 μg of 130 nm PS-SA, 75 pmol of aptamer, 10 mM Mg2+ ions in PBS and 10 nM IgE. The detection procedure was carried out as described in the Experimental Section. | |
Analytical performance of protein detection
At optimal conditions, this assay was challenged with a series of target IgE concentrations. As shown in Fig. 8, the CL intensity was found to be proportional to the concentration of IgE. The linear curve fitted a regression equation of LgI = 0.7573LgC + 2.4529 with a region from 4.88 pM to 20 nM with a correlation coefficient of R2 = 0.9853, where I is the CL intensity and C is the concentration of target IgE. In addition, at concentrations higher than 20 nM, the CL intensity leveled off and deviated from the calibration curve. The detection limit was estimated to be 4.6 pM at a signal-to-noise ratio of 3, which compares favorably with those obtained from other methods (Table 2), for example, German et al.11 measured IgE with a detection limit of 46 pM in serum samples while an electrochemical approach yielded a detection limit of 36 pM in PBS solution.44 By using a QCM-based detection scheme, Liss et al.24 detected IgE with a detection limit of 0.5 nM in various complex protein mixes, and Gokulrangan et al.45 developed a fluorescence polarization-based technique with a detection limit of 350 pM. More recently, Cole et al.46 demonstrated the capture and detection of IgE at the attomole level from picomolar solutions of the protein. 10 successive incubation/rinse cycles were used to achieve detection of IgE at concentrations of 100 fM by MALDI-MS, however, this method cannot yet be used for quantitative measurements.
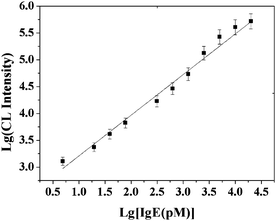 |
| | Fig. 8 Log–log calibration data for IgE by using the proposed strategy. Experimental conditions: 30 μg MB, 500-fold dilution of anti-IgE, 30 μg of 130 nm PS-SA, 75 pmol of aptamer G50 and 10 mM Mg2+ ions in PBS. The detection procedure was carried out as described in the Experimental Section. | |
Table 2 Comparison of sensitivity for IgE based on different aptameric assay methods
Detection specificity
Sensitivity and specificity are the two critical factors for a successful assay system for protein. In the proposed strategy, the sensitivity is mainly dependent on the number of G bases within the aptamer-barcodes. The detection specificity is basically determined by the aptameric recognition function. In order to evaluate the detection specificity of the present detection system, the CL intensity induced by the nonspecific binding of several nontarget proteins was investigated. As shown in Fig. 9, compared with the CL intensity upon 1 nM target protein, the CL intensity corresponding to the nontarget proteins (IgG, IgA, IgM, interferon and thrombin, 10 nM each) was very low. The measured data demonstrate that the CL signal was specifically triggered by the aptamer/target binding.
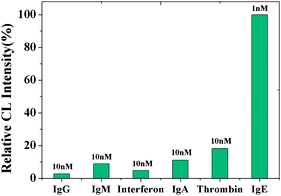 |
| | Fig. 9 Detection selectivity using the proposed strategy. Experimental conditions: 30 μg MB, 500-fold dilution of anti-IgE, 30 μg of 130 nm PS-SA, 75 pmol of aptamer, 10 mM Mg2+ ions in PBS and 5 nM IgE. The detection procedure was carried out as described in the Experimental Section. | |
Comparison with immunoturbidimetric assay
For a validation study 20 human serum samples from patients were split and analyzed by our method (10-fold dilution with PBS) and the immunoturbidimetric test was performed by Zhongshan Hospital. The mean concentration values of all immunoturbidimetric measurements and the concentration obtained by our assays were used for linear regression analyses. As seen from Fig. 10, the distributions of IgE levels in 20 serum samples were approximated by a normal distribution. The correlation was calculated with a linear least-squares method (y = 1.0536x − 0.1242; R2 = 0.9845), and the 95% confidence intervals of the slope and intercept were 0.9899–1.1171 and −0.5849 to 0.3365 for IgE, respectively. The confidence intervals for the slope and intercept values include the unit and zero values, respectively; thus, the results indeed showed good agreement between the conventional assay and the proposed one, as confirmed by the Student t-test (P > 0.05). The agreement between the two assays also indicates the absence of matrix effects of human serum on the assay performance.
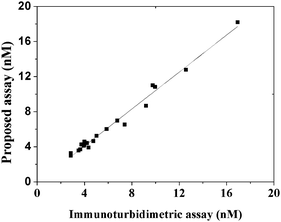 |
| | Fig. 10 Relationship between the proposed method and the immunoturbidimetric assay for IgE in 20 human serum samples. | |
Conclusions
In summary, a novel approach for the development of an aptameric detection system was proposed for the detection of proteins as exemplified by IgE, based on merging the function of aptameric recognition with an instantaneous derivatization amplification technology. This assay system not only eliminates the complicated releasing process, but also achieves improved assay characteristics (e.g., wide linear response range, low detection limit, and high specificity). The sensitivity of our assay compares favorably with previous efforts using the same IgE aptamer (Table 2). As demonstrated by our research, nonspecific contaminants have no obvious influence on the assay system, which is easy to be used for IgE detection at the physiological level, even in complex samples such as human serum. Thus, this aptamer-barcode based CL recognition platform is expected to be a candidate for the detection of proteins and other ligands of interest in both fundamental and applied research. We believe such advancements will represent a significant step toward care diagnostics and personalized medicine at the point of care.
Acknowledgements
We acknowledge financial support from National Drug Innovative Program (2009ZX09301-011), National 863 Program (2007AA03Z357), National Natural Science Foundation of China (20975026) and the Research Fund for the Doctoral Program of Higher Education (20090071110056).
Notes and references
- R. Nutiu and Y. F. Li, Chem.–Eur. J., 2004, 10, 1868 CrossRef CAS.
- C. Tuerk and L. Gold, Science, 1990, 249, 505 CrossRef CAS.
- A. D. Ellington and J. W. Szostak, Nature, 1990, 346, 818 CrossRef CAS.
- T. Hermann and D. J. Patel, Science, 2000, 287, 820 CrossRef CAS.
- S. E. Osborne and A. D. Ellington, Chem. Rev., 1997, 97, 349 CrossRef CAS.
- K. Sefah, J. A. Phillips, X. L. Xiong, L. Meng, D. Van Simaeys, H. Chen, J. Martin and W. H. Tan, Analyst, 2009, 134, 1765 RSC.
- I. Willner and M. Zayats, Angew. Chem., Int. Ed., 2007, 46, 6408 CrossRef CAS.
- B. Strehlitz, N. Nikolaus and R. Stoltenburg, Sensors, 2008, 8, 4296 CrossRef CAS.
- S. P. Song, L. H. Wang, J. Li, J. L. Zhao and C. H. Fan, TrAC, Trends Anal. Chem., 2008, 27, 108 CrossRef CAS.
- D. W. Drolet, L. MoonMcDermott and T. S. Romig, Nat. Biotechnol., 1996, 14, 1021 CrossRef CAS.
- I. German, D. D. Buchanan and R. T. Kennedy, Anal. Chem., 1998, 70, 4540 CrossRef CAS.
- M. Berezovski and S. N. Krylov, J. Am. Chem. Soc., 2003, 125, 13451 CrossRef CAS.
- D. D. Buchanan, E. E. Jameson, J. Perlette, A. Malik and R. T. Kennedy, Electrophoresis, 2003, 24, 1375 CrossRef CAS.
- Q. Zhao, X. F. Li and X. C. Le, Anal. Chem., 2008, 80, 3915 CrossRef CAS.
- M. Michaud, E. Jourdan, A. Villet, A. Ravel, C. Grosset and E. Peyrin, J. Am. Chem. Soc., 2003, 125, 8672 CrossRef CAS.
- J. Ruta, C. Ravelet, J. Desire, J. L. Decout and E. Peyrin, Anal. Bioanal. Chem., 2008, 390, 1051 CrossRef CAS.
- K. Stadtherr, H. Wolf and P. Lindner, Anal. Chem., 2005, 77, 3437 CrossRef CAS.
- Z. W. Tang, P. Mallikaratchy, R. H. Yang, Y. M. Kim, Z. Zhu, H. Wang and W. H. Tan, J. Am. Chem. Soc., 2008, 130, 11268 CrossRef CAS.
- C. Yao, Y. Qi, Y. Zhao, Y. Xiang, Q. Chen and W. Fu, Biosens. Bioelectron., 2009, 24, 2499 CrossRef CAS.
- H. J. Gould and B. J. Sutton, Nat. Rev. Immunol., 2008, 8, 205 CrossRef CAS.
- C. A. DeWitt, A. B. Bishop, L. S. Buescher and S. P. Stone, J. Am. Acad. Dermatol., 2006, 54, 855 CrossRef.
- C. Rancinan, P. Morlat, G. Chene, S. Guez, A. Baquey, J. Beylot and R. Salamon, J. Allergy Clin. Immunol., 1998, 102, 329 CrossRef CAS.
- R. G. Hamilton and N. F. Adkinson, J. Allergy Clin. Immunol., 2004, 114, 213 CrossRef CAS.
- M. Liss, B. Petersen, H. Wolf and E. Prohaska, Anal. Chem., 2002, 74, 4488 CrossRef CAS.
- K. Maehashi, T. Katsura, K. Kerman, Y. Takamura, K. Matsumoto and E. Tamiya, Anal. Chem., 2007, 79, 782 CrossRef CAS.
-
U. Hafeli, W. Schutt, J. Teller and M. Zborowski, Scientific and clinical applications of magnetic carriers, Plenum: New York Search PubMed.
- A. Csordas, A. E. Gerdon, J. D. Adams, J. R. Qian, S. S. Oh, Y. Xiao and H. T. Soh, Angew. Chem., Int. Ed., 2010, 49, 355 CAS.
- A. P. Fan, C. W. Lau and J. Z. Lu, Anal. Chem., 2005, 77, 3238 CrossRef CAS.
- J. Z. Lu, C. W. Lau and M. Kai, Chem. Commun., 2003, 2888 RSC.
- J. R. Miao, Z. J. Cao, Y. Zhou, C. W. Lau and J. Z. Lu, Anal. Chem., 2008, 80, 1606 CrossRef CAS.
- L. Xin, Z. Cao, C. Lau, M. Kai and J. Lu, Luminescence, 2010, 25, 336 CAS.
- P. L. He, L. Shen, Y. H. Cao and D. F. Li, Anal. Chem., 2007, 79, 8024 CrossRef CAS.
- J. M. Nam, S. I. Stoeva and C. A. Mirkin, J. Am. Chem. Soc., 2004, 126, 5932 CrossRef CAS.
- B. K. Oh, J. M. Nam, S. W. Lee and C. A. Mirkin, Small, 2006, 2, 103 CrossRef CAS.
- H. D. Hill and C. A. Mirkin, Nat. Protoc., 2006, 1, 324 Search PubMed.
- Y. P. Bao, T. F. Wei, P. A. Lefebvre, H. An, L. X. He, G. T. Kunkel and U. R. Muller, Anal. Chem., 2006, 78, 2055 CrossRef CAS.
- E. Kojima, Y. Ohba, M. Kai and Y. Ohkura, Anal. Chim. Acta, 1993, 280, 157 CrossRef CAS.
- Y. X. Jiang, X. H. Fang and C. L. Bai, Anal. Chem., 2004, 76, 5230 CrossRef CAS.
- E. J. Cho, J. R. Collett, A. E. Szafranska and A. D. Ellington, Anal. Chim. Acta, 2006, 564, 82 CrossRef CAS.
- X. L. Yan, Z. J. Cao, M. Kai and J. Z. Lu, Talanta, 2009, 79, 383 CrossRef CAS.
- X. H. Fang, J. J. Li and W. H. Tan, Anal. Chem., 2000, 72, 3280 CrossRef CAS.
- K. Feng, Y. Kang, J. J. Zhao, Y. L. Liu, J. H. Jiang, G. L. Shen and R. Q. Yu, Anal. Biochem., 2008, 378, 38 CrossRef CAS.
- X. H. Fang, Z. H. Cao, T. Beck and W. H. Tan, Anal. Chem., 2001, 73, 5752 CrossRef CAS.
- Z. S. Wu, F. Zheng, G. L. Shen and R. Q. Yu, Biomaterials, 2009, 30, 2950 CrossRef CAS.
- G. Gokulrangan, J. R. Unruh, D. F. Holub, B. Ingram, C. K. Johnson and G. S. Wilson, Anal. Chem., 2005, 77, 1963 CrossRef CAS.
- J. R. Cole, L. W. Dick, E. J. Morgan and L. B. McGown, Anal. Chem., 2007, 79, 273 CrossRef CAS.
- H. X. Chen, J. M. Busnel, G. Peltre, X. X. Zhang and H. H. Girault, Anal. Chem., 2008, 80, 9583 CrossRef CAS.
- D. K. Xu, D. W. Xu, X. B. Yu, Z. H. Liu, W. He and Z. Q. Ma, Anal. Chem., 2005, 77, 5107 CrossRef CAS.
- M. Fukasawa, W. Yoshida, H. Yamazaki, K. Sode and K. Ikebukuro, Electroanalysis, 2009, 21, 1297 CrossRef CAS.
- K. I. Papamichael, M. P. Kreuzer and G. G. Guilbault, Sens. Actuators, B, 2007, 121, 178 CrossRef.
- J. L. He, Z. S. Wu, S. B. Zhang, G. L. Shen and R. Q. Yu, Analyst, 2009, 134, 1003 RSC.
- J. L. Wang, A. Munir, Z. H. Li and H. S. Zhou, Biosens. Bioelectron., 2009, 25, 124 CrossRef CAS.
- Y. H. Kim, J. P. Kim, S. J. Han and S. J. Sim, Sens. Actuator B-Chem., 2009, 139, 471 CrossRef.
- Z. Z. Wang, T. Wilkop, D. K. Xu, Y. Dong, G. Y. Ma and Q. Cheng, Anal. Bioanal. Chem., 2007, 389, 819 CrossRef CAS.
- W. Yoshida, K. Sode and K. Ikebukuro, Biotechnol. Lett., 2008, 30, 421 CrossRef CAS.
|
| This journal is © The Royal Society of Chemistry 2011 |
Click here to see how this site uses Cookies. View our privacy policy here. 


![The proposed binding mode among IgE, anti-IgE aptamer and the PS-SA or [Ru(phen)2(dppz)]2+.](/image/article/2011/AN/c0an00448k/c0an00448k-s2.gif)


