DOI:
10.1039/B914706C
(Paper)
Soft Matter, 2010,
6, 126-135
Inversion of ‘dry water’ to aqueous foam on addition of surfactant†
Received
20th July 2009
, Accepted 21st August 2009
First published on
14th October 2009
Abstract
Addition of charged surfactant to mixtures of air, water and hydrophobic silica nanoparticles under high shear induces transitional phase inversion from a water-in-air powder to an air-in-water foam. Optical and electron microscopy reveal the non-spherical shape of both drops and bubbles, respectively, in these materials due to their partial coverage by particles. Complementary experiments are described to elucidate the origin of phase inversion. From surface tension and contact angle measurements, the ratio of adsorption of surfactant at air–water and solid–water interfaces is determined. Particles become increasingly hydrophilic on adding surfactant since molecules adsorb tail down exposing charged head groups to the aqueous phase. The increased particle dispersibility into water and the generation of negative zeta potentials confirm this scenario. In addition, the ability of the same silica nanoparticles to act as antifoams of aqueous surfactant foams formed under low shear is investigated. The effectiveness of these particles as antifoams decreases both on increasing the surfactant concentration and the time particles and surfactant are in contact before foaming. Both trends are in agreement with the above-mentioned findings that when particles are rendered more hydrophilic via surfactant adsorption, they no longer break foam films between bubbles but remain dispersed in the aqueous phase.
Introduction
Certain colloidal particles are surface-active at a fluid–fluid interface and stable emulsions or foams can be prepared from mixtures of particles, water and either oil or air.1 In many instances, such particles which are partially wetted by both bulk phases are effectively irreversibly adsorbed giving rise to drops or bubbles which are extremely resistant to both coalescence and disproportionation.2–9 Recently, Binks and Murakami10 described how to phase invert aqueous foams stabilised solely by particles to a free flowing powdered material called ‘dry water’.11,12 In this study, the inherent wettability of the silica nanoparticles at the air–water surface was varied by coating the particles to different extents with a silane reagent. For relatively hydrophilic particles, air-in-water (a/w) foams composed of bubbles were stabilised, whereas for very hydrophobic particles a water-in-air (w/a) powder composed of drops formed, i.e. the curvature of the fluid interface was inverted. Such an inversion is the air–water equivalent of transitional emulsion inversion from oil-in-water to water-in-oil.13 Catastrophic phase inversion was also shown to be possible in the former case by varying the air : water ratio for particles of fixed wettability.10
In a subsequent study, Binks et al.14 utilised the charge properties of partially hydrophobic silica particles and demonstrated how changes in pH and salt concentration may also affect phase inversion of air–water–particle systems. A low pH or high salt concentration favoured the formation of ‘dry water’ as colloidal particles were rendered hydrophobic, whereas a high pH or low salt concentration resulted in charged, partially hydrophilic particles capable of stabilising aqueous foams. However, in many products or processes incorporating foams, particles are frequently added in conjunction with surfactant, e.g. food-based foams. It is likely that these particles are surface-active and contribute to the stability and rheology of the foam, although relatively little is known about how such mixtures actually operate.8,9 In contrast, hydrophobic particles are well known to be effective antifoams in aqueous surfactant systems, either added alone or in combination with oil.15–22 The particles are believed to bridge the aqueous film between bubble surfaces and, if suitably hydrophobic, can dewet and create holes in the film leading to rupture and foam breakdown.16,17,22 The transition in terms of wettability between a foam-stabilising particle and a foam-destabilising particle is particularly interesting.
Although surface-active molecules have been used to increase the hydrophobicity (by adsorption) of otherwise hydrophilic particles and enable the stabilisation of aqueous foams,8,9 we describe here an alternative way of converting the ‘dry water’ material made with particles alone to aqueous foam by addition of charged surfactant. The aim is to understand how the two surface-active agents compete for the air–water surface and investigate whether they interact with each other also. We show how initially hydrophobic silica particles are rendered hydrophilic via surfactant adsorption and how this in turn changes the preference for the formation of ‘dry water’ to that of an aqueous foam. We also attempt to make the link between the distinct areas of particles at liquid interfaces and antifoaming of aqueous surfactant solutions.
Experimental
Materials
Fumed silica powder (HDK-H18) containing quasi-spherical particles of primary diameter around 20 nm was supplied by Wacker-Chemie (Germany). These particles can partially fuse with each other with such aggregates (few hundred nm) forming agglomerates of several microns in size, see Fig. 1. The particles are very hydrophobic obtained after reacting hydrophilic silica with dichlorodimethylsilane (DCDMS), and possess a free silanol (SiOH) content on their surfaces of only 20%. The surface area of the hydrophilic silica particles from which they are derived is 200 m2 g−1. Water was first passed through an Elga reverse osmosis unit and then a Milli-Q reagent water system. Its natural pH was 5.6 due to dissolved carbon dioxide. The anionic surfactant sodium dodecyl sulfate (SDS, >99%, Aldrich) was used as received. DCDMS used to hydrophobise glass slides was >99.5% pure from Fluka. All other chemicals were AnalaR grade. The air was simply that present in the laboratory (N2 ≈ 78%, O2 ≈ 21%, Ar ≈ 0.9%, CO2 ≈ 0.04%). For contact angle measurements, glass microscope slides (Menzel Gläser, 4 cm by 2 cm) were first cleaned in 30 wt% NaOH solution for 10 min at 60 °C, rinsed in Milli-Q water and dried with filtered nitrogen. They were then made very hydrophobic by reaction of DCDMS (0.1 M, 1 h) in dry cyclohexane in a N2-filled desiccator at a relative humidity of less than 5%. After removing excess reagent by rinsing with cyclohexane and then chloroform, the slides were dried with filtered nitrogen and stored in a desiccator until use (within 24 h).23
 |
| | Fig. 1 (a) SEM image of powdered hydrophobic fumed silica HDK-H18 and (b) TEM image of a dried ethanolic dispersion of the same; scale bar = 50 nm. | |
Methods
Electron microscopy of hydrophobic silica particles.
Both transmission (TEM) and scanning (SEM) electron microscopy were used to investigate the shape and size of primary particles and their aggregates in the hydrophobic fumed silica powder. For TEM, particles were dispersed in ethanol using an ultrasonic bath for 5 min and drops were placed on carbon coated grids and allowed to air dry. Images were obtained using a JEOL 2011 TEM operating at 200 kV. For SEM, the powdered sample was attached to a mount using a carbon impregnated self-adhesive disc. It was then coated with ca. 5 nm of pure graphite whilst being rotated (Edwards high vacuum thermal evaporator). The coated sample was examined using a Zeiss EVO60 SEM operating in high vacuum mode (25 kV, 100 pA).
Preparation of ‘dry water’ and aqueous foam using high shear mixing.
In order to prepare either ‘dry water’ or aqueous foam with this method,10–12 a volume of water or surfactant solution (95 cm3) was poured into a blender (Braun, Glass Jug PowerBlend MX2050, 1.7 L with lid) and an amount of powdered hydrophobic silica particles (3.8 g) was placed on top, i.e. particle concentration is 4 wt% relative to water alone. A sheet of aluminium foil and a plastic lid were used to seal the vessel. Immediately after this, high shear mixing was achieved at a speed of ∼25![[thin space (1/6-em)]](https://www.rsc.org/images/entities/char_2009.gif) 000 rpm for 30 s. The continuous phase of the material formed was determined using a drop test into water. Foams were found to disperse rapidly into pure water (since continuous phase is water), whereas dry powders did not (since continuous phase is air) and they remained on the surface of water. Immediately after preparation, the samples were transferred into plastic vessels to prevent destabilisation of the dry powders on contact with glass and the heights of the different phases (powder, foam, aqueous phase) were recorded, and these were then monitored over time. Photographs of vessels were taken using a Canon IXUS55 digital camera.
000 rpm for 30 s. The continuous phase of the material formed was determined using a drop test into water. Foams were found to disperse rapidly into pure water (since continuous phase is water), whereas dry powders did not (since continuous phase is air) and they remained on the surface of water. Immediately after preparation, the samples were transferred into plastic vessels to prevent destabilisation of the dry powders on contact with glass and the heights of the different phases (powder, foam, aqueous phase) were recorded, and these were then monitored over time. Photographs of vessels were taken using a Canon IXUS55 digital camera.
Influence of particles on foaming by ‘shake test’.
In these experiments the simple shake test method was employed involving less shear than above.20 A sample of 20 mL of aqueous surfactant solution (with or without 5 mg of powdered hydrophobic silica) was placed in a 320 mL graduated glass cylinder fitted with a plastic stopper. The cylinder was then shaken vigorously around 100 times with an up and down motion for 30 s and the volume of foam formed was recorded. This is referred to as the initial foam volume. The foam volume was then monitored over a period of time to obtain foam breakdown rates. The shake test gives remarkably reproducible results when performed by the same experimenter. In a second set of experiments (later), 5 mg of particles and 20 mL of 10 mM SDS solution were gently stirred for different periods of time using a magnetic flea and an IKA RO-15 stirrer plate. They were then foamed in the above way.
Optical microscopy.
Small samples of the various materials were imaged with a Nikon Labophot microscope fitted with a digital camera QICAM 12-bit mono Fast 1394 (QImaging), using Image-Pro Plus 5.1 software (Media Cybernetics). They were placed on haemocytometer cells.
Freeze-fracture SEM.
Freeze-fracture SEM measurements were also carried out on selected dry water and foam samples. A small volume of fresh sample was mounted onto a 0.1 cm diameter Al stub and plunged into nitrogen slush at −196 °C. The frozen sample was transferred to a Gatan Alto 2500 cryo-preparation chamber and fractured with a scalpel blade at −175 °C under high vacuum. It was then etched at −98 °C and coated at −110 °C with an Au/Pd sputter at low vacuum after which it was transferred to the chamber of a JEOL JSM-6301F SEM at −150 °C. Image acquisition was obtained using the software Scandium (Soft Imaging System).
Air–water surface tensions.
The air–water surface tensions were measured as a function of SDS concentration (without particles) using the pendant drop method. A 20 µL drop of the aqueous phase was formed in air on the tip of a stainless steel needle (outer diameter = 0.18 cm) and left to equilibrate in a water-saturated chamber. Using a Krüss Drop Shape Analysis System-10 (DSA-10) instrument, the profile of the drop is measured from which the tension is determined. The mean value of at least 3 drops was determined for each surfactant concentration.
Air–water–glass contact angles.
The advancing contact angle of an aqueous SDS drop (volume 20 µL) on a smooth hydrophobised glass microscope slide in air was determined using a Krüss DSA-10 instrument. The sessile drop was added to the substrate contained in a metal chamber and sealed to saturate the vapour space with water. The volume of the drop was subsequently increased and the drop then left for 15 min before a measurement was made. New drops were formed at different locations on the surface. The reproducibility of contact angles was generally ±3°.
Particle size distributions and zeta potentials.
The silica particle size distributions and zeta potentials in aqueous dispersions were measured using a Malvern Zetasizer 3000 instrument. Typically, 20 mL of aqueous SDS solution and 5 mg of hydrophobic silica particle powder were stirred for 18 h using a magnetic flea on an IKA-RO15 stirrer plate. The stirring speed was sufficient to create a vortex enhancing the penetration and subsequent wetting of the particles into water. A 1 mL sample was then taken (without dilution) into a glass cuvette for measurement.
Liquid marbles.
Macroscopic aqueous drops in air stabilised by particles have been termed liquid marbles.24,25 In the context, they can be thought of as the simplest unit of the dry water powder, although the drop size is significantly larger allowing visualisation. They were prepared by forming a 50 µL drop of either pure water or aqueous SDS solution on a microsyringe and allowing it to approach a bed of powdered silica particles (6 mg, 0.5 mm high) resting on the bottom of a plastic lid (20 mm diameter). As the drop contacts the powder, particles are seen to adhere and spread quickly on its surface. The lid was then rotated at an angle of 45° approximately 20 times enabling the drop to become covered with particles. The sample was left open to the atmosphere, and the diameter and shape of the marble were monitored with time. The relative humidity was ca. 70%.
All experiments were carried out at room temperature, being 20 ± 2 °C.
Results and discussion
In the first part, we describe some properties of the bulk materials formed when air, hydrophobic particles and aqueous surfactant solution are mixed using high shear. We then describe the complementary experiments aimed at explaining the phase inversion established above. Finally, the effect of the same hydrophobic particles as antifoams in aqueous foams prepared using low shear is discussed and correlated with the previous findings.
(a) Effect of surfactant on materials formed from air, water and hydrophobic particles
The surfactant SDS associates into micelles in water at a concentration of 8 mM. If aerated alone, SDS forms aqueous foams consisting of air bubbles dispersed in water, which destabilise with time through a combination of water drainage, bubble disproportionation and bubble coalescence. These foams are notoriously unstable, e.g. one made at 1 mM SDS had a lifetime of just 2 h. Part of the instability is due to the continuous adsorption and desorption of surfactant molecules to and from bubble surfaces which leads to surface tension gradients which can be destructive. On the other hand, very hydrophobic fumed silica particles are known to stabilise water-in-air powders upon aeration with pure water.10–12 Due to the irreversible adsorption of particles to the fluid surface,1 the water drops are extremely stable and no water is lost from the powder if stored in plastic vessels. If kept in glass vessels, however, some water drops spread on the glass walls leading to small water pools below the powder. If the above surfactant and particles are mixed during aeration, it is anticipated that transitional inversion from a w/a powder (favoured by particles) to an a/w foam (favoured by surfactant) will occur upon increasing the concentration of surfactant.
At a fixed particle concentration of 4 wt% (chosen from previous work10), Fig. 2 shows the appearance of the materials formed after high shear mixing of air, particles and aqueous surfactant solution. The dry water powder formed from particles alone (upper far left) remains up to and including 5 mM SDS, after which foams are produced up to the highest surfactant concentration investigated (100 mM). That is, inversion of the curvature of the air–water surface is achieved upon adding surfactant; this occurs around the critical micelle concentration (cmc) of 8 mM. The continuous phase of the materials was determined via the drop test. The powders did not disperse into pure water (continuous phase air) whereas the foams readily dispersed (continuous phase water). Fig. 3(a) is a photograph from above looking into the vessels at SDS concentrations yielding the dry powder (left) and foams (centre and right). The consistency of the foam is very different at low and high surfactant concentration. Around the inversion point (8 mM), the foam surface is irregular and undulating, whereas far above this (100 mM) its surface is flat and the foam is more gel-like deforming under an applied stress. In order to further demonstrate the difference in the materials before and after inversion, Fig. 3(b) and (c) show the free flowing nature of the dry powder passing through a funnel and the thick, cream-like consistency of the foam forced through a metal nozzle, respectively.
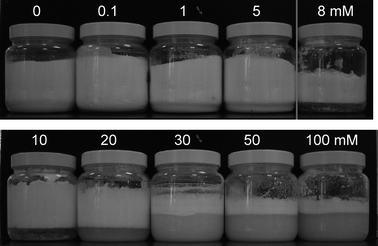 |
| | Fig. 2 Appearance of materials 4 weeks after preparation in systems containing air, 4 wt% hydrophobic silica particles and aqueous SDS at concentrations given. Dry powders form between 0 and 5 mM, aqueous foams form at and above 8 mM. | |
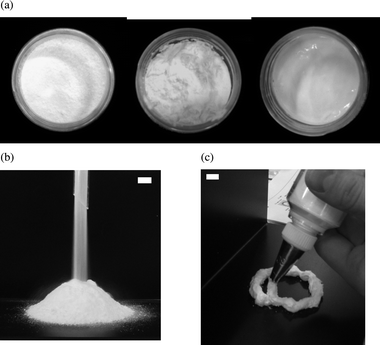 |
| | Fig. 3 Photograph of (a) top view looking into the vessels of Fig. 2 for (left) 5 mM, (centre) 8 mM and (right) 100 mM SDS, (b) powdered ‘dry water’ composed of water drops stabilised by hydrophobic silica particles (4 wt%) in air passing through a glass funnel and (c) aqueous foam composed of air bubbles stabilised by a mixture of hydrophobic silica particles (4 wt%) and SDS surfactant (8 mM) in water extruded through a serrated nozzle. Scale bars = 1 cm. | |
In terms of stability in sealed vessels, no resolution of water was observed above or below the dry powder samples for at least 6 months. However, as seen in Fig. 2, the foams exhibit creaming of air bubbles to the top of the vessel with a concomitant drainage of water beneath the residual foam. The rate of drainage increases with surfactant concentration and we noticed that the blue hue of the separated aqueous phase becomes more pronounced, due to the presence of non-adsorbed silica particles (later). Unlike foams stabilised solely by surfactant, the residual foams in particle–surfactant mixtures are very stable to disproportionation and coalescence and retain their volume for at least 6 months. The different materials were examined by optical microscopy and representative images are shown in Fig. 4. The first three images (a)–(c) are of the dry powder where it can be seen that the water drops coated by silica particles are non-spherical and several hundred microns in size. Evidence for folding of the particle layer giving creases can also be seen. The deviation from spherical shape is frequently observed in particle-coated fluid dispersed phases and is due to jamming of particles at the interface preventing relaxation of the interface to a spherical geometry.26 The size of the water drops decreases to around 100 µm as the surfactant concentration increases to 5 mM (c), probably as a result of the reduced air–water surface tension aiding the breakup of bulk water into drops. After inversion, air bubbles partly coated with particles are also non-spherical and appear to decrease in size on addition of further surfactant (d and e). Excess particles are present in the continuous aqueous phase as loose aggregates. At high surfactant concentration (f), air bubbles are more spherical and devoid of ripples on their surface; many of the particles (which we now expect to be hydrophilic—see later) are situated within the thin aqueous film lamellae and in Plateau borders between neighbouring bubbles.
 |
| | Fig. 4 Optical micrographs of water drops in dry powders at (a) 0, (b) 1 and (c) 5 mM SDS, and of air bubbles in foams at (d) 8, (e) 10 and (f) 100 mM SDS. All samples contained 4 wt% hydrophobic silica particles. | |
Cryo-SEM has also been employed to investigate further the internal structure of the materials prepared. In Fig. 5(a), a non-spherical water drop (which is frozen) completely coated with a multilayer of silica particles can be seen from dry water prepared using particles alone. This is to be contrasted with the smooth surface of air bubbles formed in the foam stabilised entirely by surfactant, Fig. 5(b), which is featureless. In mixtures of particles and surfactant, Fig. 5(c)–(f), the transition from powders to foams can be visualised. At low SDS concentration (5 mM) before inversion, another particle-coated water drop is seen in Fig. 5(c), as in (a), although the particles appear to aggregate into needle-like structures around the periphery possibly as a result of them becoming charged by surfactant. Interestingly, around inversion (8 mM), evidence of both water drops and air bubbles is given in Fig. 5(d). In the centre of the image, frozen water drops (reasonably spherical) are contained within a large air cell, surrounded by a particle layer (thin white periphery), itself dispersed in water (grey continuous phase), i.e. a water-in-air-in-water structure is present. Above the inversion concentration (e and f) only air bubbles are present but these are distorted and the degree of coverage of the surface by particles decreases with surfactant concentration. The influence of surfactant on the apparent silica particle size is also seen at high magnification. In (g) for the particle layer around a water drop without SDS, the aggregate diameter is approximately 100 nm. This is to be contrasted with the smaller size of around 25 nm (cf. primary particle diameter) seen in (h) for the particle layer around an air bubble in the presence of SDS, i.e. adding surfactant aids the dispersibility of the particles.
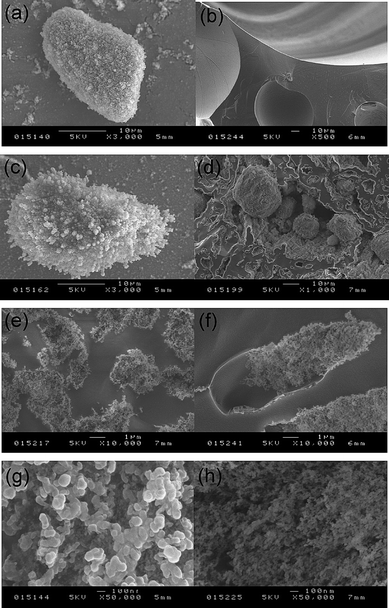 |
| | Fig. 5 Cryo-SEM images of representative dry powder and foam samples. (a) Water drop in air coated by hydrophobic silica particles alone, (b) air bubbles coated by 8 mM SDS alone, (c) water drop in system of 4 wt% particles plus 5 mM SDS, (d) water drops within air bubbles (water-in-air-in-water) for 4 wt% particles plus 8 mM SDS, (e) air bubbles for 4 wt% particles plus 20 mM SDS, (f) air bubbles for 4 wt% particles plus 100 mM SDS, (g) close up of surface of water drop with particles alone, (h) close up of surface of air bubble for 4 wt% particles plus 20 mM SDS. Scale bars are on each image. | |
One element of the dry water material is a water drop in air coated with solid particles. In a different context, millimetre sized drops of this kind have been termed liquid marbles24,25 and can be observed by eye. In connection with the inversion described above, we thought it of interest to investigate briefly the influence of surfactant addition to the water phase on the formation and stability of the liquid marbles. If surfactant molecules adsorb fast enough to particles enveloping the marble, their ease of formation and subsequent stability to loss of water should be affected. In Fig. 6 we show photographs of liquid marbles resting on a bed of powdered particles in air immediately after formation and for other times later, for different concentrations of SDS. Initially, all the drops are of the same diameter (5 mm) and are spherical. With time, water is lost through evaporation from all the marbles at a similar rate in the first 4 h. However, those from pure water or a low surfactant concentration (left) remain spheres whereas those at higher concentration (right) flatten from the top. After nearly 6 h (lower set) the two marbles on the left still remain intact containing water whereas the other two have lost all their water and what remains is a crumpled dry particle shell. The resistance to evaporation therefore decreases with increasing surfactant concentration. One consequence of adding surfactant is to lower the tension of the air–water surface between adsorbed particles. This, however, should cause a reduction in the evaporation rate (per unit area of surface) due to the monolayer of surfactant at the drop surface. Another possibility is the adsorption of surfactant from water to the interfacial layer of particles thus modifying their hydrophobicity which results in a weakening of the layer, and if particles become too hydrophilic and desorb, holes could appear in the layer enhancing the loss of water. Further work looking at both the kinetics of drying and its impact on the structure of the interfacial layer is warranted.
 |
| | Fig. 6 Photographs of liquid marbles (water drops in air coated by particles) resting on a bed of hydrophobic silica powder for, from left to right, pure water, 0.1 mM, 10 mM and 100 mM SDS, at (upper) 45 min, 4 h (middle) and 5.5 h (lower) since formation. Diameter of plastic lid = 20 mm. | |
(b) Adsorption of surfactant at air–water and solid–water interfaces
In order to offer an explanation for the phase inversion from dry water to foam, we note that addition of surfactant to mixtures of air, water and particles can cause changes in either or both of the air–water surface tension, γaw, and the solid–water tension, γsw, resulting from surfactant adsorption. In pure water systems, the preferred curvature of the air–water surface is negative since hydrophobic silica particles stabilise water-in-air powders. As surfactant is added, it is likely that a fraction of it will adsorb on particle surfaces via van der Waals forces between the alkyl chain of the surfactant and hydrophobic groups on the particle. The formation of this monolayer exposes charged surfactant head groups to the aqueous phase, thus increasing progressively the hydrophilicity of the particles themselves. The adsorption of these and individual surfactant monomers will change the preferred curvature of the air–water surface to positive and foams will be stabilised. At high enough surfactant concentration, particles will be too hydrophilic to remain attached to air bubbles and they will collect in the aqueous films between bubbles retarding drainage; foams will then be stabilised mainly by surfactant molecules.
In a related context, addition of ionic surfactant is a common way to enable the dispersion of hydrophobic particles into water and this is exploited industrially for a range of formulations. Recent examples include hydrophobic boehmite γ-AlO(OH) nanoparticles,27 carbon nanotubes28 and graphite microparticles,29 and the resulting dispersions are stable due to the electrostatic repulsion operating between the coated particle surfaces. In addition, the adsorption of SDS chain down onto methylated silica substrates has been demonstrated using infrared spectroscopy.30 Finally, using atomic force microscopy, the forces between a hydrophobic silica particle and an air bubble through water were measured upon increasing the SDS concentration.31 The repulsive force between the two surfaces increased markedly as both acquired a negative charge through adsorption.
In order to test our hypothesis, we have determined both the air–water surface tension and the relevant contact angle as a function of surfactant concentration. Fig. 7(a) shows the expected decrease in the surface tension of water on adding SDS. The tension falls up to around the cmc (8 mM) and then levels off as micelles form which do not adsorb. If all the surfactant added to our systems only adsorbed to this interface, the consequence of this would be a reduction in the energy required to disperse water (or air) as the disperse phase leading to smaller and smaller drops (or bubbles). Since determination of the contact angle which particles make with liquid surfaces is challenging,32Fig. 7(b) shows how the contact angle of a water drop in air resting on a planar hydrophobic glass slide varies with SDS concentration in the water drop. The coating agent on the slides, DCDMS, is the same as that used to modify the silica particles and its density is the maximum possible so as to be comparable to the high particle hydrophobicity used in earlier experiments. The contact angle in pure water is 104° which decreases progressively and then markedly to around 68° up to and beyond the cmc. That is, the silica surface becomes increasingly water-wet or hydrophilic on adding SDS. Although these angles may not be exactly those exhibited by the particles themselves, it is interesting to note that they pass through 90°, in line with the expectation that more hydrophobic particles prefer to curve the air–water surface around water whereas more hydrophilic ones prefer to curve it around air.10
 |
| | Fig. 7 Variation of (a) the air–water surface tension (the minimum near the cmc indicates a slight impurity) and (b) the advancing contact angle of a water drop in air on a very hydrophobic DCDMS-coated glass slide with surfactant concentration. | |
The reduction of the contact angle of a water drop in air on a hydrophobic glass slide with increasing surfactant concentration in the aqueous phase can arise due to the reduction of either or both of γaw and γsw resulting from the adsorption of surfactant. Estimates of surfactant adsorption at the solid–water interface can be made as described by Lucassen-Reynders.33 The equilibrium contact angle θ of the liquid drop with the solid is related to the various tensions by Young's equation
| | | γsa = γsw + γawcosθ | (1) |
where
γsa is the solid–air interfacial tension. Therefore
| |  | (2) |
The adsorption
Γ of
surfactant of activity
a in solution at the various interfaces
i in the system is given by the Gibbs equation
| |  | (3) |
where
R is the gas constant and
T is the absolute temperature. Combination of
eqn (2) and
(3) yields
| |  | (4) |
The slope of the plot of γawcos θ against γaw gives the ratio of the surface excess of surfactant at the various interfaces. Since in an air plus water system there is no means of transport to the solid–air surface, we reasonably assume that the adsorption of surfactant at the solid–air interface is zero and eqn (4) becomes
| |  | (5) |
i.e. the ratio of adsorption at the solid–water and the air–water interfaces can be obtained. Such a plot is given in
Fig. 8 for both the DCDMS-coated surface and an
octadecyltrichlorosilane (OTS)-coated surface taken from
ref. 34. Although there is some scatter in this derived plot, the values of
Γsw/
Γaw are approximately 0.6 ± 0.1 and 0.7 ± 0.1 for DCDMS and OTS surfaces, respectively. In other words, the adsorption of SDS on particles is
ca. two-thirds of that of its adsorption at air–water surfaces. Similar ratios of 0.6 and 0.8 were reported by Lucassen-Reynders for the anionic
surfactant Aerosol OT on
glyceryl tristearate and solid paraffin surfaces, respectively.
33
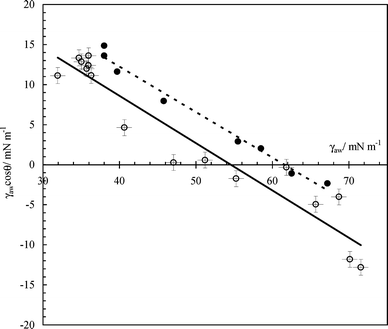 |
| | Fig. 8 Plot of γawcos θversusγaw for hydrophobic glass–air–water systems in the presence of SDS. The open points refer to DCDMS-coated slides and the filled points are for OTS-coated slides from ref. 34. | |
We also measured the zeta potential and particle size distribution of fumed silica dispersions in water, with and without surfactant, after stirring a fixed mass of silica powder with the aqueous solution for 18 h. The results are given in Table 1. In the absence of SDS, a very small fraction of the particles disperse in water. The diameter of the species present varies from around 30 nm as expected for primary particles (Fig. 1) to nearly 100 nm consistent with small aggregates and they are slightly negatively charged. Upon increasing the SDS concentration, more and more particles can be dispersed and the dispersions go from being clear to bluish as a result. The zeta potential of the particles becomes more negative as SDS adsorbs on particles exposing its head group to water, whilst the particle diameter range increases substantially. The latter increase is due to the formation of fractal-like aggregates composed of primary particles via van der Waals forces between neighbouring methyl groups, a characteristic feature of fumed silica.35
Table 1 Particle diameter range (all distributions were monomodal) and mean zeta potential and appearance of dispersion for aqueous dispersions of 5 mg of hydrophobic silica in SDS solutions as a function of surfactant concentration
| [SDS]/mM |
Particle diameter range/nm |
Mean zeta potential/mV |
Appearance of dispersion |
| 0 |
27–90 |
−13 ± 7 |
Clear |
| 0.1 |
25–71 |
−48 ± 7 |
Clear |
| 1 |
26–81 |
−55 ± 7 |
Slightly bluish haze |
| 3 |
28–613 |
−45 ± 7 |
Bluish haze |
| 10 |
192–436 |
−52 ± 15 |
Bluish haze |
| 30 |
201–1022 |
−57 ± 23 |
Bluish opalescent |
| 100 |
392–841 |
−52 ± 23 |
Bluish opalescent |
(c) Effect of hydrophobic particles as antifoam agents
Foaming of aqueous surfactant solutions can be reduced by the presence of hydrophobic solid particles of dimensions comparable to foam lamellae thicknesses, say between 1 and 10 µm.15–22 The particles bridge lamellae surfaces, and if the contact angle which the surfactant solution makes with the solid is high, this can lead to film rupture as the particle becomes dewetted by the aqueous surfactant. Frye and Berg19 emphasised that during foam formation, conditions can be far from equilibrium and that the rate of surfactant adsorption to lamellae surfaces can be of great importance. Both particle shape17 and surface roughness18 are known to be crucial in foam breaking. Some hydrophobic solids can also spread on aqueous surfactant solutions, causing tension gradients which could contribute to antifoam performance. Kulkarni et al.,15 investigating the mode of action of commercial antifoams of particles dispersed in oil, suggested that hydrophobic particles can adsorb surfactant rapidly from the foam films, resulting in surface stresses which rupture the films. For this mechanism to operate, the rate of adsorption by the solid must exceed the rate of replenishment of surfactant by adsorption from bulk solution. Following adsorption, particles presumably become more hydrophilic and may eventually transfer to the aqueous phase and be incapable of further antifoaming. In later work, Aveyard and co-workers20,21 investigated systematically the effect of particle hydrophobicity on the antifoaming of various surfactant solutions. In systems where the air–water–solid contact angle was changed in situ via changes in the surfactant concentration, antifoaming efficiency of supra-micron sized hydrophobic particles decreased with a decrease in the contact angle.20 In systems where the contact angle was varied ex situ by using particles of different inherent wettability,21 antifoam effectiveness was very low for contact angles <75° but then rose rapidly for angles >80° and up to around 100°. Regarding foam stability, the presence of particles with contact angles <75° had little effect and particles were seen in the subnatant liquid as foams drained. For angles above about 95°, the foam stability was greatly reduced. However, for contact angles between these two limits, foams were substantially stabilised by the presence of the particles, since they are well held and can remain at the air–water surface.1,3
We have investigated the potential of using the hydrophobic silica nanoparticles as antifoam agents in foams of SDS, i.e. the particles are added to the system before foam formation. In these experiments, less shear is used during aeration via hand shaking. A fixed mass (5 mg) of silica powder is added to the surface of the surfactant solution (20 mL) and foams are prepared immediately by hand shaking in stoppered glass cylinders. The foamability is quantified in terms of the initial foam volume after cessation of shaking. In Fig. 9(a), the foamability is plotted as a function of SDS concentration both in the absence (filled points) and in the presence (open points) of hydrophobic particles. Without particles, the foam volume V0 increases up to and beyond the cmc as the monomer concentration increases but then decreases at higher concentrations. The latter effect was reported before36 and confirmed by us earlier8 and is linked to the increase in the lifetime of the micelles with concentration thus slowing down the supply of monomeric surfactant required for the stabilisation of the fresh bubble interfaces. It can also be seen that particles reduce the volume of foam formed initially, V, at all surfactant concentrations, i.e. they are effective antifoams. It is convenient to express the foam knockdown in terms of the percent foam reduction (FR) defined as
| |  | (6) |
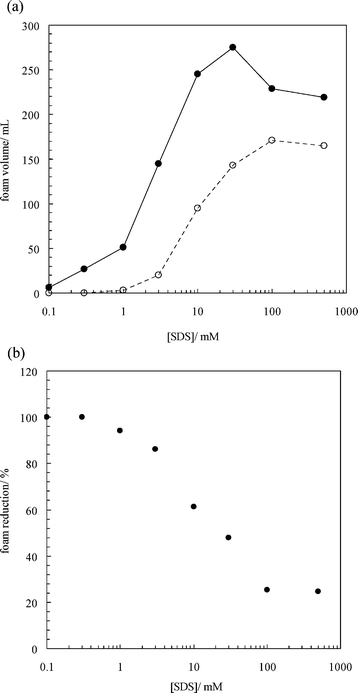 |
| | Fig. 9 (a) Initial foam volume of 20 mL of aqueous SDS solutions as a function of surfactant concentration with (open points) and without (filled points) 5 mg of hydrophobic silica powder (HDK-H18). Foams were prepared by hand shaking immediately after adding the powder to the solution surface. (b) Percentage foam reduction caused by solid particles as a function of surfactant concentration. | |
The derived FR data are shown in Fig. 9(b); the reduction is maximum at low SDS concentrations but decreases progressively with concentration, reaching a minimum of around 25% at and above 100 mM. Recalling the results in Fig. 7(b), the contact angle of the particles at the air–water surfaces will be high at low concentrations and low at high concentrations. If surfactant has time to adsorb on particle surfaces during immediate foam formation, then the decrease in the effectiveness of the particles as antifoams can be understood in terms of them being rendered increasingly hydrophilic as a function of SDS concentration. The large difference in SDS concentration required to reach saturation (∼6 mM, Fig. 7(b) and ∼100 mM, Fig. 9(b)) is due to the very different solid surface area exposed to surfactant solution in the two experiments (low for contact angle, high for foam).
Regarding foam stability, the volume of foam remaining is plotted as a function of time in Fig. 10(a) at different SDS concentrations, with and without particles. At higher concentrations in the former, the aqueous phase which drained from the foam layer was bluish indicative of dispersed particles being present which are effectively transferred from air to water as a result of surfactant adsorption. As with most foams, there is at first a gradual decrease in volume for a period of time followed by a more noticeable reduction leading to complete foam collapse. The foam half-life, defined as the time taken for the foam volume to fall to half its initial value, is shown in Fig. 10(b)versus surfactant concentration. In the absence of particles, the half-life increases continuously with concentration, particularly at high concentrations where micelles in the film phase between bubbles hinder its drainage. On addition of particles, there is no measurable effect on stability up to 10 mM SDS, above which foam stability is greatly reduced to a maximum value.
 |
| | Fig. 10 (a) Volume of foam formed from systems in Fig. 9 as a function of time for different selected surfactant concentrations with (open points) and without (filled points) 5 mg of hydrophobic silica powder; circles—3 mM, triangles—10 mM, squares—30 mM, diamonds—100 mM SDS. (b) Foam half-life versus surfactant concentration for foams in (a); filled points—no particles, open points—with particles. | |
In order to further explore the effect of surfactant adsorption by the particles on their effectiveness in foam breaking, we decided to vary the time particles and surfactant were in contact before foam formation. This was achieved by stirring 5 mg of hydrophobic silica with 20 mL of 10 mM SDS solution and creating a vortex to enhance the mutual contact of the two phases. As the equilibration time te increased, we noticed that more and more of the powdered particles were wetted by the aqueous phase giving them a bluish colour. We show in Fig. 11(a) initial foam volumes as a function of te. For te less than about 4 h the initial foam volume is little affected and particles are good antifoams, reducing the foam volume to around 90 mL compared to 250 mL in their absence. For larger te, however, initial foam volumes rise substantially with equilibration time as a result of the decreased effectiveness of the particles in reducing foaming. This is likely to be due to particles becoming increasingly hydrophilic via surfactant adsorption, which clearly occurs more slowly than at the plane solid–water interface. In order to compare the foam stabilities from dispersions of different foamabilities, we define
| |  | (7) |
where the vol terms refer to foam volumes initially or after a certain time
t. A value of unity refers to a foam which breaks down completely, whereas a value of zero is for a foam stable to both drainage and coalescence. In
Fig. 11(b) we plot the stability after 2 h as a function of equilibration time. Interestingly, the stability value appears to pass through a minimum with respect to
te,
i.e. the foam stability exhibits a maximum at intermediate
te. Assuming that the main influence of
te in this system is to render particles progressively more hydrophilic, a tentative explanation for the maximum could be as follows. At low
te, initially very hydrophobic particles remain hydrophobic and yield a certain level of foam stability. At intermediate
te, particles with a low level of adsorbed
surfactant are partially hydrophobic and can themselves adsorb around bubbles in addition to
surfactant molecules enhancing the foam stability. This synergism has been demonstrated before for mixtures of initially hydrophilic silica
nanoparticles and cationic
surfactant.
8 At high
te,
surfactant-coated particles are hydrophilic and do not remain at the air–water surface, leading to a subsequent
reduction in the foam stability.
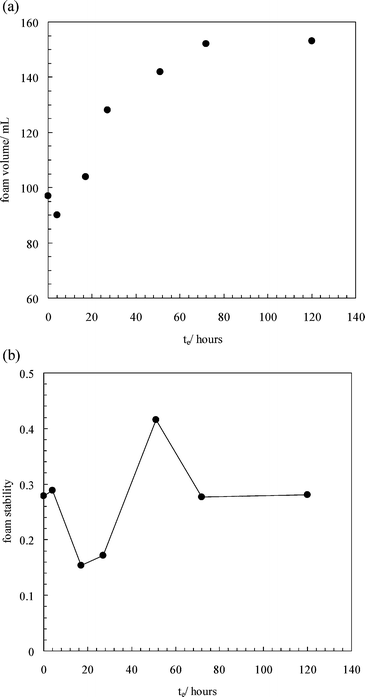 |
| | Fig. 11 (a) Initial foam volume of 10 mM SDS solutions in the presence of 5 mg of hydrophobic silica powder which was pre-equilibrated with the surfactant solutions for various times before the formation of foams. The foam volume in the absence of silica is 250 cm3. (b) Foam stability after 2 h versus equilibration time for systems in (a). | |
The interaction between initially hydrophobic silica particles and ionic surfactant leads to a change in the type of material formed when air and water are mixed under high shear as well as a change in the ability of particles to prevent foaming in mixtures prepared at low shear. The main reason for this behaviour is the reduction in the hydrophobicity of the particles as a result of surfactant adsorption. This is summarised schematically in Fig. 12.
 |
| | Fig. 12 Schematic of the likely mechanism responsible for the inversion of dry water to aqueous foam in systems containing hydrophobic particles, ionic surfactant, water and air under high shear and the ability of particles to act as antifoams under low shear. | |
Conclusions
We have described the phase inversion of water-in-air dry powders stabilised by hydrophobic particles alone to air-in-water foams formed on addition of ionic surfactant. Additional contact angle, surface tension, zeta potential and microscopy measurements allow us to put forward a mechanism for this inversion in terms of progressive changes in the wettability of the particles at the air–water surface. This change is also responsible for the decreased effectiveness of the particles as antifoams of aqueous foams.
Acknowledgements
This work was funded by Unilever Corporate Research, Colworth (UK). We thank Mr Mark Kirkland for carrying out the freeze-fracture SEM measurements and for useful comments relating to them.
References
-
Colloidal Particles at Liquid Interfaces, ed. B. P. Binks and T. S. Horozov, Cambridge University Press, Cambridge, 2006, p. 1 Search PubMed.
- Z. Du, M. P. Bilbao-Montoya, B. P. Binks, E. Dickinson, R. Ettelaie and B. S. Murray, Langmuir, 2003, 19, 3106 CrossRef CAS.
- B. P. Binks and T. S. Horozov, Angew. Chem., Int. Ed., 2005, 117, 3788 CrossRef.
- S. Fujii, A. J. Ryan and S. P. Armes, J. Am. Chem. Soc., 2006, 128, 7882 CrossRef CAS.
- U. T. Gonzenbach, A. R. Studart, E. Tervoort and L. J. Gauckler, Angew. Chem., Int. Ed., 2006, 45, 3526 CrossRef CAS.
- A. B. Subramaniam, M. Abkarian, L. Mahadevan and H. A. Stone, Langmuir, 2006, 22, 10204 CrossRef CAS.
- A. Cervantes-Martinez, E. Rio, G. Delon, A. Saint-Jalmes, D. Langevin and B. P. Binks, Soft Matter, 2008, 4, 1531 RSC.
- B. P. Binks, M. Kirkland and J. A. Rodrigues, Soft Matter, 2008, 4, 2373 RSC.
- Q. Liu, S. Zhang, D. Sun and J. Xu, Colloids Surf., A, 2009, 338, 40 CrossRef CAS.
- B. P. Binks and R. Murakami, Nat. Mater., 2006, 5, 865 CrossRef CAS.
- S. Hasenzahl, A. Gray, E. Walzer and A. Braunagel, SÖFW-J, 2005, 131, 2 Search PubMed.
- L. Forny, I. Pezron, K. Saleh, P. Guigon and L. Komunjer, Powder Technol., 2007, 171, 15 CrossRef CAS.
- B. P. Binks and S. O. Lumsdon, Langmuir, 2000, 16, 8622 CrossRef CAS.
- B. P. Binks, B. Duncumb and R. Murakami, Langmuir, 2007, 23, 9143 CrossRef CAS.
- R. D. Kulkarni, E. D. Goddard and B. Kanner, Ind. Eng. Chem. Fundam., 1977, 16, 472 CrossRef CAS.
- P. R. Garrett, J. Colloid Interface Sci., 1979, 69, 107 CrossRef CAS; H. Zhang, C. A. Miller, P. R. Garrett and K. H. Raney, J. Colloid Interface Sci., 2004, 279, 539 CrossRef CAS.
- A. Dippenaar, Int. J. Miner. Process., 1982, 9, 1 CrossRef CAS.
- M. P. Aronson, Langmuir, 1986, 2, 653 CrossRef CAS.
- G. C. Frye and J. C. Berg, J. Colloid Interface Sci., 1989, 127, 222 CrossRef CAS.
- R. Aveyard, P. Cooper, P. D. I. Fletcher and C. E. Rutherford, Langmuir, 1993, 9, 604 CrossRef CAS.
- R. Aveyard, B. P. Binks, P. D. I. Fletcher and C. E. Rutherford, J. Dispersion Sci. Technol., 1994, 15, 251 CrossRef CAS.
- N. D. Denkov, Langmuir, 2004, 20, 9463 CrossRef CAS.
- P. H. F. Hansen, S. Rödner and L. Bergström, Langmuir, 2001, 17, 4867 CrossRef CAS.
- P. Aussillous and D. Quéré, Nature, 2001, 411, 924 CrossRef CAS.
- M. Dandan and H. Y. Erbil, Langmuir, 2009, 25, 8362 CrossRef CAS.
- A. B. Subramaniam, M. Abkarian, L. Mahadevan and H. A. Stone, Nature, 2005, 438, 930 CrossRef.
- T. Dederichs, M. Möller and O. Weichold, Langmuir, 2009, 25, 2007 CrossRef CAS.
- L. Jiang, L. Gao and J. Sun, J. Colloid Interface Sci., 2003, 260, 89 CrossRef CAS.
- S. Krishnakumar and P. Somasundaran, Colloids Surf., A, 1996, 117, 227 CrossRef.
- M. J. Wirth, D. A. Piasecki-Coleman and M. E. Montgomery, Jr, Langmuir, 1995, 11, 990 CrossRef CAS.
- M. Preuss and H.-J. Bütt, Langmuir, 1998, 14, 3164 CrossRef CAS.
- T. S. Horozov, D. A. Braz, P. D. I. Fletcher, B. P. Binks and J. H. Clint, Langmuir, 2008, 24, 1678 CrossRef CAS.
- E. H. Lucassen-Reynders, J. Phys. Chem., 1963, 67, 969 CAS.
-
C. E. Rutherford, PhD thesis, University of Hull, 1995.
-
Wacker HDK® Fumed Silica brochure, Wacker-Chemie GmbH, Germany, 2000 Search PubMed.
- S.-G. Oh and D. O. Shah, Langmuir, 1991, 7, 1316 CrossRef CAS.
Footnote |
| † This work was presented at ‘Association In Solution II, Structure, Function & Performance’ held in Tomar, Portugal, July 2009. |
|
| This journal is © The Royal Society of Chemistry 2010 |
Click here to see how this site uses Cookies. View our privacy policy here.