Grafting poly(phenylene oxide) with poly(vinylphosphonic acid) for fuel cell membranes
Mark
Ingratta
a,
Matti
Elomaa
b and
Patric
Jannasch
*a
aDepartment of Chemistry, Polymer and Materials Chemistry, Lund University, P.O.B. 124, SE 221 00, Lund, Sweden. E-mail: patric.jannasch@polymat.lth.se
bLaboratory of Polymer Chemistry, University of Helsinki, P B 55, 00014, Finland
First published on 12th March 2010
Abstract
Densely phosphonated electrolyte membranes were prepared from poly(2,6-dimethyl-1,4-phenylene oxide) (PPO) grafted with poly(vinylphosphonic acid) (PVPA) side chains. In the first step, PPO was lithiated in solution at room temperature by adding n-butyllithium to form an anionic macroinitiatior. Next, diethyl vinylphosphonate was anionically polymerized from the lithiated sites at −78 °C. This protocol gave good control over the density of the grafting sites and the copolymer composition. Films of copolymers containing between 35 and 74 wt% poly(diethyl vinylphosphonate) were first cast from solution and subsequently fully hydrolyzed to produce transparent flexible proton conducting membranes of PPO-graft-PVPA containing up to 6 mmol phosphonic acid groups per gram of dry copolymer. Thermogravimetric analysis showed anhydride formation at increasing temperatures above 100 °C with no copolymer degradation occurring until nearly 400 °C under air. Fully hydrated membranes reached proton conductivities above 1 mS cm−1 at −20 °C and 80 mS cm−1 at 120 °C.
Introduction
A robust, inexpensive, highly proton conducting membrane at the heart of the hydrogen polymer electrolyte membrane fuel cell has been the target of a considerable amount of research over the past decade.1–9 The desired characteristics of the membrane include a low gas crossover, high thermal and chemical stability, possibilities for low-cost mass production, and, of course, high proton conductivity over a wide temperature and humidity range. All of these requirements necessitate a multifunctional material with the mechanical strength to withstand the stresses placed upon it in a fuel cell, while at the same time efficiently conducting protons across the membrane.The current state-of-the-art membrane Nafion® is a sulfonated fluoropolymer, which exhibits high stability and high proton conductivity within its optimal operating temperature window between 0 and 80 °C. While Nafion® has attracted strong interest as the standard for proton conductivity, it still has several drawbacks. For example, it has a relatively high price, and its conductivity drops drastically once outside its optimal temperature and humidity range. This drop is due to Nafion’s® dependence on the presence of water for proton transport within the hydrophilic channels in the membrane, and is caused by water freezing at low temperatures and evaporation at high temperatures.
One proposed strategy for conductive polymers with an increased operating temperature window at low relative humidity (RH) is to substitute the sulfonic acid groups for an intrinsically proton conducting functionality.10 In this way, water is not required for proton transport across the membrane. Polymers functionalized with phosphonic acid11–15 and various imidazoles16–21 have been investigated for this purpose, and the results have shown that the concentration and mode of immobilization of these groups are very important for the proton conductivity. We have previously studied poly(vinylphosphonic acid) (PVPA) in graft and block copolymers, in combination with poly(arylene ether sulfone) (PSU)22 and polystyrene (PS),23 respectively. Both of these copolymers showed relatively high proton conductivity in the range of 1–5 and 10–100 mS cm−1 in the nominally dry and hydrated state, respectively. Several recent investigations using 1H MAS (magic angle spinning) NMR and 31P NMR spectroscopy have been conducted to determine the effect of humidity and thermal history on the proton conducting properties of homopolymers of PVPA.24,25 It was shown that RHs above 40%, equivalent to 15 wt% water, or 0.8 water molecules per acid group, were required to minimize anhydride formation between phosphonic acid groups. Temperatures greater than 150 °C also favored anhydride formation, which decreased the proton conductivity since increasing cross-linking lowered the acid concentration and the chain mobility, and hence also the proton mobility. Several strategies have evolved in an attempt to reduce anhydride formation, including copolymers with both phosphonic acid and basic functions,26–28 blends29 containing PVPA and basic polymers, and the use of block copolymers30 containing poly(vinylbenzylphosphonic acid) and PS or polyetheretherketone (PEEK).
PPO is a versatile aromatic polymer, which can advantageously be used as a precursor in the preparation of graft and block copolymers.31 For example, chain end hydroxyl groups can be exploited for polycondensation reactions and have also been used to introduce initiator sites for the atom transfer radical polymerization (ATRP) of styrene to form PPO-block-PS.32 Alternatively, the aromatic ring and benzylic functions in the PPO main chain can be employed in several functionalization reactions, such as electrophilic substitution reactions, chlorination, and sulfonation, to name a few.31 PPO has also been used recently to synthesize PPO-graft-PS,33 PPO-graft-poly(methyl methacrylate),33 and PPO-graft-poly(styrene-sulfonic acid)34 by first brominating PPO and then using ATRP to grow the side chains.
In the current work, PPO was successfully grafted with diethyl vinylphosphonate (DEVP) in a single step via anionic polymerization to give PPO-graft-poly(diethyl vinylphosphonate) (PPOgPDEVP). n-Butyllithium was used to introduce anionic initiator sites along the PPO backbone,35,36 followed by the addition of DEVP. Films of PPOgPDEVP were cast and then hydrolyzed to form transparent, flexible PPOgPVPA membranes. The influence of the copolymer structure on the morphology and key membrane properties, such as thermal stability, water uptake and proton conductivity were studied.
Experimental section
Materials
PPO was purchased from Sigma-Aldrich and was determined to have a number average molecular weight (Mn) of 16.6 kg mol−1 and polydispersity (Mw/Mn) of 2.4. The molecular weight data was obtained relative to polystyrene standards using size-exclusion chromatography with Shodex KF–805, KF–804 and KF–802.5 columns in series, a model 250 Viscotek refractometer and chloroform as the mobile phase at an elution rate of 1 mL min−1 at room temperature. The PPO was dried in a vacuum oven for 24 h at 80 °C prior to use. Tetrahydrofuran (THF, Fisher Scientific, HPLC grade) was dried over molecular sieves (Acros; 4 Å, 8–12 mesh), which were activated at 250 °C for 24 h and cooled to room temperature in a vacuum oven prior to use. Nafion® 117 (Alfa Aesar), methanol (Fisher Scientific; HPLC grade) pentane (Prolab; 97%), 1-methyl-2-pyrrolidinone (NMP; Acros; 99%), diethylvinylphosphonate (DEVP; Aldrich; 97%), and trimethylchlorosilane (TMCS; Aldrich; 99+%) were used as received. n-Butyllithium (n-BuLi, Acros; 2.5M in hexanes) was used as received after titration to determine the exact concentration.37Synthesis of graft copolymers
A typical reaction was carried out as follows: a 250 mL round bottom flask equipped with a magnetic stirrer bar, thermometer, septum and argon inlet was charged with 150 mL dry tetrahydrofuran (THF) and 1.0 g PPO. The solution was first cooled to −40 °C and degassed 7 times. Next, the solution was warmed to 65 °C to fully dissolve the PPO, and then finally cooled to room temperature. n-BuLi solution was added drop-wise to titrate the small amount of impurities in the THF and PPO. Next, a specific amount of n-BuLi was added to lithiate the PPO, at which point the solution maintained a bright yellow-orange colour. After 10 min, the solution was cooled to −78 °C and left to stir for another 20 min. DEVP was added all at once and the colour changed to yellow with a small increase in temperature, typically to −65 °C, and a marked increase in the solution viscosity. The polymerization was left for either 20 min or 2 h, followed by the addition of 1 mL TMCS or methanol (see Table 1 for specific conditions for each sample). The yellow colour gradually disappeared over 5–10 min of stirring. The reaction solution was then poured into pentane to precipitate the copolymer, which was then filtered off. After drying, the polymer was dissolved and precipitated once again in THF–pentane. The white, fluffy polymer was dried before being stirred in water overnight and filtered once more. The ratio of PPO to PDEVP was determined by 1H NMR spectroscopy, as described below, and was found to match the weight percent monomer added initially.| Copolymer | Target DLa | Polymerization time/min | TMCS added | TMS in aryl position on PPOb | TMS on PDEVP chain endc | PDEVP contentd/wt% | Degree of polymerizatione |
|---|---|---|---|---|---|---|---|
| a DL = degree of lithiation, the average number of lithiated sites per PPO monomer unit. b Average number of TMS groups attached at the aryl position per PPO monomer unit (n.d. = not detected). c Average number of TMS groups attached at the PDEVP chain end per PPO monomer unit. d Determined by 1H NMR data. e Calculated using the PDEVP content and the number of TMS groups on the PDEVP chain ends as determined by 1H NMR data (n.c. = not calculated). | |||||||
| PPOgPDEVP1 | 0.15 | 120 | y | 0.023 | 0.037 | 38 | 12 |
| PPOgPDEVP2 | 0.15 | 120 | y | 0.024 | 0.040 | 44 | 15 |
| PPOgPDEVP3 | 0.15 | 120 | n | — | — | 54 | n.c. |
| PPOgPDEVP4 | 0.15 | 20 | y | 0.052 | 0.035 | 59 | 31 |
| PPOgPDEVP5 | 0.15 | 120 | y | 0.028 | 0.047 | 60 | 23 |
| PPOgPDEVP6 | 0.15 | 120 | n | — | — | 74 | n.c. |
| PPOgPDEVP7 | 0.075 | 20 | y | 0.01 | 0.018 | 35 | 22 |
| PPOgPDEVP8 | 0.075 | 20 | y | 0.01 | 0.018 | 44 | 31 |
| PPOgPDEVP9 | 0.075 | 120 | y | n.d. | 0.016 | 73 | 124 |
Structural characterization
FTIR analysis was completed using a Bruker IFS 66 spectrometer. The dry polymer samples were ground together with KBr and pressed into tablets. The spectra were recorded from 400 to 4000 cm−1 with a resolution of 2 cm−1 after 128 scans.1H NMR analysis was completed using a Bruker 400 MHz spectrometer. Spectra of the PPOgPDEVP samples were recorded at 400.13 MHz in deuterated chloroform. NMR analysis was not performed on the PPOgPVPA samples due to their insolubility. Representative 1H NMR spectra of PPO, PPO reacted with TMCS and PPOgPDEVP8 are shown in Fig. 1a–c, respectively. The weight percent of PDEVP was determined by integrating the aromatic protons of the PPO backbone at 6.47 ppm relative to those of the CH2 of the ester group of the PDEVP unit at 4.10 ppm. The peaks from the methyl protons of the trimethylsilyl (TMS) groups were used to quantify the number and distribution of active lithiated sites at the end of the grafting reaction, and appeared at 0.45, 0.17 and −0.069 ppm for Ar–Si(CH3)3, PDEVP–Si(CH3)3, and ArCH2–Si(CH3)3 respectively.
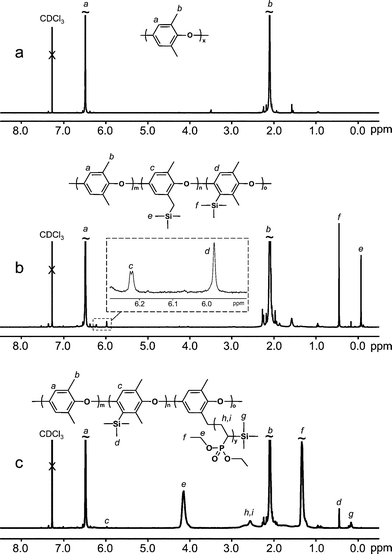 | ||
| Fig. 1 1H NMR spectra of (a) neat PPO, (b) PPO substituted with TMS groups, and (c) PPOgPDEVP8. All of the spectra were collected using CDCl3 solutions. | ||
Membrane preparation and water uptake measurements
PPOgPDEVP membranes were first cast and then hydrolyzed to give transparent PPOgPVPA membranes. The membranes were prepared in this fashion due to the very poor solubility of PPOgPVPA in any solvent. Complete hydrolysis of the ester function was confirmed by thermogravimetric analysis (TGA) of the dried, hydrolyzed membranes through the absence of a decomposition step at 300 °C. This is described in further detail in the thermal analysis section. The procedure for membrane preparation was as follows: a 5 wt% solution of PPOgPDEVP in NMP was prepared and required gentle heating in some cases. The solution was passed through a 0.4 μm teflon filter into a Petri-dish, which was then placed in an oven at 90 °C and kept under a flow of nitrogen for 48 h, followed by 24 h in a vacuum oven at 50 °C. The transparent yellow membranes were then leached with Milli-Q water for at least 8 h before being dried once more in a vacuum oven at 50 °C for 24 h.Hydrolysis of the membranes to obtain the PPOgPVPA membrane was achieved using concentrated aqueous HCl. The dry PPOgPDEVP membranes were placed in a round bottomed flask equipped with a reflux condenser and charged with 50 mL aqueous HCl. The solution was refluxed for 8 h, after which the acidic membranes were leached with Milli-Q water at least 5 times to remove traces of HCl. The membranes were finally dried in a vacuum oven for 24 h.
The water uptake (wwater) was determined according to eqn (1) for both PPOgPDEVP and PPOgPVPA membranes. Dry weights (wdry) were determined after drying the membranes in a vacuum oven at 50 °C for 48 h while wet weights (wwet) were determined by immersing the membrane in Milli-Q water for 24 h. The wet membranes were weighed after excess water was quickly removed using tissue paper.
| wwater = [(wwet − wdry)/wdry] × 100% | (1) |
Thermal analysis
TGA was conducted using a Q500 thermogravimetric analyzer from TA instruments. Polymer thermal stability was measured under nitrogen or air up to 600 °C with a scan rate of 10 °C min−1 and 1 °C min−1, respectively. The polymer was pre-dried at 150 °C for 10 min prior to the scanning cycle. Complete hydrolysis of the PPOgPDEVP membranes to PPOgPVPA was determined by checking the thermal stability of the dry membrane. Fully hydrolyzed membranes showed no decomposition at 300 °C, which indicated the absence of any ester units.Differential scanning calorimetry (DSC) was used to determine the glass transition temperatures (Tgs) for all PPOgPDEVP and PPOgPVPA membranes and was performed using a TA Instruments Q1000 DSC. Each PPOgPVPA and PPOgPDEVP sample was examined using hermetically sealed pans with the following sequence of scans: 40 → 150 → 50 → 200 → 50 → 250 → 50 → 300 °C. The heating and cooling rates were 10 °C min−1 and Tgs were determined from the last heating scan.
Morphology investigation
Copolymer morphologies were investigated by analyzing the surfaces of thin films using atomic force microscopy (AFM). Samples in the ester form were first dissolved in NMP (approx. 5 mg mL−1). All samples were then further diluted 100 times with chloroform and cast on freshly cleaved mica surfaces and dried under vacuum at 120 °C. The copolymer surfaces were analyzed under ambient air using a Veeco's MultiMode V AFM in tapping mode. Simultaneous topographic and phase imaging was carried out at a scanning frequency of 1 Hz. The probe was Veeco's RTESP (40 N m−1, 300 kHz, symmetric tip, no coatings). No image processing except flattening was done.Proton conductivity measurements
The proton conductivity was evaluated by electrochemical impedance spectroscopy (EIS) using a Novocontrol V 1.01S high-resolution dielectric analyzer equipped with a Novocool temperature system. Samples were equilibrated under immersed conditions before being placed into the closed cell electrode for EIS measurements. In-plane conductivity was measured on an 8 × 8 mm membrane clamped between two stainless steel electrodes. Impedance data was collected between 10−1 and 107 Hz at a voltage amplitude of 50 mV from −20 to 120 °C. The conductivity was determined by plotting the imaginary part of the conductivity vs. the real part, and the conductivity taken as the real value corresponding to the minimum imaginary response.Results and discussion
Synthesis and structural characterization
PPO is an attractive polymer for use in fuel cell applications because of its high thermal stability, low methanol crossover, and good membrane forming properties, in combination with a large variety of synthetic pathways available to modify its function and properties.31 Here we report on the use of anionic polymerization to graft long PDEVP chains from the PPO main chain. After film preparation and hydrolysis to convert PDEVP into PVPA, nano-sized phase domains containing very high local concentrations of proton conducting phosphonic acid groups were expected to be separated from the phase formed by the hydrophobic PPO main chain. A series of PPOgPVPA membranes with PVPA contents ranging from 26 to 64 wt% (Table 2) were prepared in order to study the effect of the copolymer structure on key membrane properties, such as water uptake and proton conductivity.| Copolymer | Theor. IEC/mmol g−1 | PVPA content (wt%) | w water (wt%) | [H2O]/[–PO3H2] | T g/°C |
|---|---|---|---|---|---|
| PPOgPVPA1 | 2.5 | 28 | 16 | 3.5 | 231 |
| PPOgPVPA2 | 3.2 | 34 | 23 | 4.1 | 234 |
| PPOgPVPA3 | 4.0 | 43 | 32 | 4.5 | 255 |
| PPOgPVPA4 | 4.5 | 49 | 43 | 5.3 | 249 |
| PPOgPVPA5 | 4.6 | 49 | 44 | 5.4 | 251 |
| PPOgPVPA6 | 6.0 | 65 | 111 | 11.1 | 253 |
| PPOgPVPA7 | 2.4 | 26 | 19 | 4.3 | 245 |
| PPOgPVPA8 | 3.1 | 34 | 24 | 4.2 | 224 |
| PPOgPVPA9 | 6.0 | 65 | 152 | 14.3 | 257 |
An anionic polymerization technique was selected in order to develop a straightforward one pot synthesis where PPO can be lithiated to provide initiating sites for the subsequent DEVP polymerizations. This procedure may be compared to alternative polymerization methods involving techniques, such as ATRP, where a “macroinitiator” must first be synthesized and purified prior to the polymerization step. We have previously polymerized DEVP anionically from lithiated PSU,22 and from polystyryl anions in sequential polymerizations23 to form graft and block copolymers, respectively. One significant difference in the synthesis procedure used in the current work was that PPO was much less soluble in THF than PSU or PS, thus requiring a more carefully controlled lithiation procedure to avoid polymer precipitation. The mixture of PPO in THF was first warmed to 60 °C under stirring to fully dissolve the PPO. n-Butyllithium was then added at room temperature to lithiate the PPO before cooling to −78 °C. Non-lithiated PPO would precipitate out of solution upon reaching approx. −30 °C. However, lithiated PPO is much more soluble in THF up to a degree of lithiation (DL, the average number of lithiated sites per repeat unit of PPO) of approximately 0.5, at which point the polymer begins to gel out of solution. Also, in both previous cases where anionic polymerization of DEVP was performed, the polymerization was initiated by adding 1,1-diphenylethylene (DPE) to modify the reactivity of the anionic sites. In the present work, no additions of DPE were necessary, since the benzyllithium formed on PPO was found to be an efficient initiator site for DEVP at −78 °C (Scheme 1).
 | ||
| Scheme 1 Grafting PDEVP from PPO by anionic polymerization followed by acidic hydrolysis of the grafts to PVPA. | ||
In an initial study, 1H NMR analysis was used to estimate the number and positions of the titrated sites initiated by butyllithium, as done previously by Chalk et al.35,36 Two PPO samples were lithiated followed by the addition of TMCS. As shown in Fig. 1b, two new peaks were present for the Ar–H and Si–CH3 protons, respectively, at 5.98 and 0.45 ppm when TMS was attached at the aryl position, and at 6.22 and −0.069 ppm with TMS attached at the benzyl position. Two different levels of DL were targeted, 0.15 and 0.075. Using the peak intensities at 0.45 and −0.069 ppm in the NMR spectra, it was calculated that on average 0.12 and 0.05 lithiated sites per PPO repeat unit reacted with TMCS when targeting DLs of 0.15 and 0.075, respectively, in approximately a 65![[thin space (1/6-em)]](https://www.rsc.org/images/entities/char_2009.gif) :
:![[thin space (1/6-em)]](https://www.rsc.org/images/entities/char_2009.gif) 35 ratio for the aryl vs. benzyl position. These values are in agreement with previous findings.35,36 In addition, a PDEVP homopolymer end-capped with TMS was synthesized using 1,1-diphenylhexyllithium.23 The chemical shift for TMS at the PDEVP chain end was confirmed at 0.17 ppm.
35 ratio for the aryl vs. benzyl position. These values are in agreement with previous findings.35,36 In addition, a PDEVP homopolymer end-capped with TMS was synthesized using 1,1-diphenylhexyllithium.23 The chemical shift for TMS at the PDEVP chain end was confirmed at 0.17 ppm.
Most of the graft polymerizations were terminated by the addition of TMCS. This provided a way to measure the number of active PDEVP chain ends and any remaining lithiated sites along the PPO chain by NMR spectroscopy. Fig. 1c shows the 1H NMR spectrum of sample PPOgPDEVP8, which indicates the presence of TMS in aryl positions and at PDEVP chain ends. Table 1 contains the data on the average number of TMS groups found in these positions per PPO repeat unit in the respective graft copolymer. Importantly, no peak was found for TMS attached at the benzyl position of PPO in any of the samples, which strongly suggested that this was the initiation site for the graft polymerization and that it was thus completely consumed. The degree of polymerization of the PDEVP grafts was calculated by the use of the average number of TMS groups attached at the PDEVP chain ends. As seen in Table 1, this number was found to be between 20 and 30% of the DL. The number of active sites remaining on PPO main chain and the PDEVP side chain ends was found to be lower than when only TMCS was added to lithiated PPO, which indicated that a portion of the lithiated sites was deactivated by the addition of DEVP. Increasing the reaction time from 20 min to 120 min for DEVP had no effect on the monomer conversion or the number of active PDEVP chain ends, while a slight decrease in the number of lithiated aryl positions was noted (Table 1, samples PPOgPDEVP4 and -5). This indicated that the majority of the deactivation reactions occurred immediately upon the addition of DEVP and were likely due to traces of impurities in the feed monomer. The number of active chain ends for PDEVP was used to estimate the average graft chain length in combination with the PDEVP content determined from the integration of the characteristic –O–CH2–CH3 signals at 4.1 ppm in the 1H NMR spectra (Fig. 1c, Table 1).
Fig. 2 depicts partial FTIR spectra of pristine PPO and representative samples of the graft copolymers in the ester and acid form. As can be seen, the spectra of the copolymers in the ester form contained several new peaks, consistent with that expected after grafting with PDEVP. For example, there was a band for the (P![[double bond, length as m-dash]](https://www.rsc.org/images/entities/char_e001.gif) O) stretch at 1230 cm−1, and bands clearly visible at 1052, 1023 and 776 cm−1 for absorptions from the (P)–O–C ester linkages. Also, there was the P–O–(C) vibration at 946 cm−1. After hydrolysis of the ester groups, these characteristic bands disappeared and new bands assigned to (P)–O–H were present at 990 and 2300 cm−1, respectively.
O) stretch at 1230 cm−1, and bands clearly visible at 1052, 1023 and 776 cm−1 for absorptions from the (P)–O–C ester linkages. Also, there was the P–O–(C) vibration at 946 cm−1. After hydrolysis of the ester groups, these characteristic bands disappeared and new bands assigned to (P)–O–H were present at 990 and 2300 cm−1, respectively.
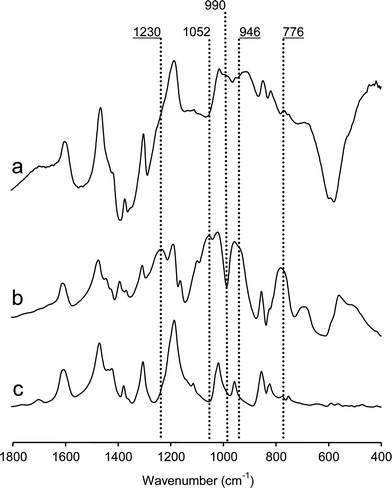 | ||
| Fig. 2 FTIR spectra of (a) PPO, (b) PPOgPDEVP6 and (c) PPOgPVPA6. | ||
Thermal stability
Thermal degradation was studied for all the PPOgPDEVP samples and the hydrolyzed PPOgPVPA membranes up to 600 °C under N2 and air, at scanning rates of 10 °C min−1 and 1 °C min−1, respectively. Fig. 3a shows representative TGA traces of the copolymers in the ester and acid form under N2. For the acidic copolymers, a slow formation of P–O–P anhydride bonds and the loss of water resulted in a slow weight loss above 150 °C. Notably, the copolymers in the ester form also initially lost weight because of absorbed water. The first degradation step of the ester began at around 300 °C and was attributed to the degradation of the ester groups by the formation and loss of ethylene. The magnitude of the weight loss was proportional to the content of PDEVP in the sample, as previously observed for other copolymers.38 The inset of Fig. 3a shows the weight loss up to 350 °C as a function of the PDEVP content determined by 1H NMR analysis, as discussed in the Experimental section. The degradation steps between 400 and 500 °C were attributed to the cleavage of the C–P bond25 and degradation of the PVPA chain.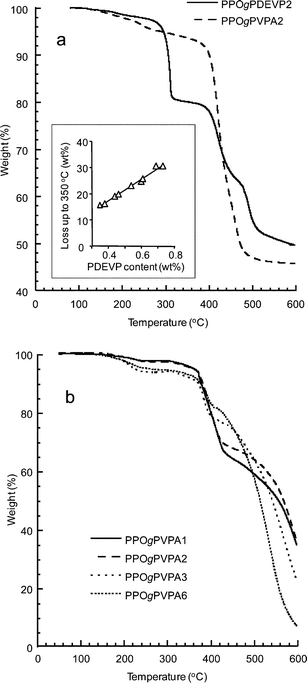 | ||
| Fig. 3 The TGA traces of (a) PPOgPDEVP2 and PPOgPVPA2 recorded at 10 °C min−1 under nitrogen and (b) the TGA traces of several PPOgPVPA samples with PVPA contents ranging from 28 to 65 wt%, recorded at 1 °C min−1 under air. | ||
Fig. 3b shows the degradation of the PPOgPVPA membranes under air with PVPA contents ranging from 28 to 65 wt%. The slow weight loss beginning at ∼150 °C has already been discussed and was attributed to the reversible condensation of the phosphonic acid groups. Actually, a small weight increase was noted at approximately 250 °C, which may be due to oxygen uptake in connection with the formation of phosphates. The major degradation occurred above 350 °C for all membranes and was ascribed to the degradation of PVPA, which has been shown to occur at approximately 330 and 380 °C under atmospheric and inert conditions, respectively.25 Also, the magnitude of the weight loss above 400 °C decreases with increasing PVPA content. This is likely due to the flame-retardant mechanism of phosphoric acid.39
DSC was used to measure the Tgs of the copolymers. Graft and block copolymers with a distinct phase separation of the blocks typically show two distinct glass transitions.40 Block copolymers of PS and PVPA, as well as PSU grafted with PVPA, showed two distinct glass transitions, with the Tg from PVPA increasing with an increase in the annealing temperature.22,23 In the current work, both the PPOgPDEVP and PPOgPVPA membranes were studied. In the case of PPOgPDEVP, only a single Tg was detected at 166–186 °C, and only for the four samples with the lowest PDEVP content. This transition most probably originated from a PPO-rich phase, with the Tg significantly depressed in comparison with that of the unmodified PPO at 218 °C. This finding may indicate a partial miscibility between the PPO and the PDEVP.
The PPOgPVPA samples showed only a single glass transition with the Tg increasing with increasing temperatures during the thermal cycling in the DSC, as shown in Fig. 4 and summarised in Table 2. This indicated that the transition originated from the PVPA phase, where successively increasing temperatures during the cycling led to increasing formation and concentration of phosphonic acid anhydride bridges, which resulted in increased crosslinking and Tgs. Any glass transition from a PPO-rich phase was thus not detected for the PPOgPVPA copolymers. The use of dynamic mechanical analysis of the PPOgPDEVP and PPOgPVPA membranes would most probably increase the chance of observing two glass transitions.
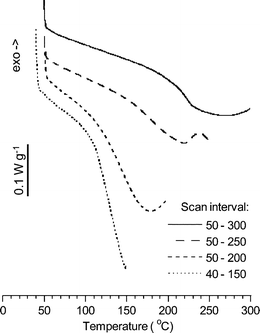 | ||
| Fig. 4 DSC heating traces of PPOgPVPA2 from 40 → 150 → 50 → 200 → 50 → 250 → 50 → 300 °C at 10 °C min−1. | ||
Membrane morphology
Thin films of the PPOgPDEVP copolymers were cast on a mica surface and dried at 120 °C under vacuum. Fig. 5 shows the phase and topographic images of a 500 × 500 nm section of PPOgPDEVP8 and PPOgPDEVP9. In accordance with previous work, harder PPO sections are most probably lighter while the soft PDEVP grafts are shown darker.23 Both films showed an irregular, phase-separated structure, indicative of the phase-separated morphology required for the proton conduction of the PPOgPVPA membranes. A rather similar irregular phase separation has been observed previously with PS-block-PDEVP.23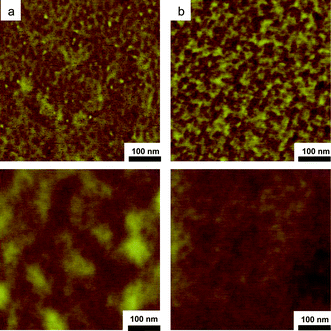 | ||
| Fig. 5 AFM tapping mode topography (lower) and phase (upper) images of thin films of PPOgPDEVP8 (a) and -9 (b). | ||
Water uptake and proton conductivity
The water uptake was measured for all membranes in both the ester and acid form under fully immersed conditions. The number of water molecules taken up per phosphonate group ([H2O]/[PO3X2], where X = Et and H for PPOgPDEVP and PPOgPVPA, respectively) is shown in Fig. 6 as a function of the number of mmoles of phosphonate groups per gram of dry polymer. This number is also the theoretical IEC for the PPOgPVPA membranes, taking into account one proton per phosphonic acid group. There was a 1.2 ± 0.1 times increase in the number of mmoles of phosphonate groups per gram of copolymer for PPOgPVPA compared to PPOgPDEVP due to the loss of mass after hydrolysis of the PDEVP side chains. The data in Fig. 6 shows that the PPOgPDEVP membranes already had a significant water absorption. However, excluding the copolymer with the lowest PDEVP content (PPOgDEVP7), the water uptake increased by a factor of 1.7 ± 0.2 for the membranes after hydrolysis of PDEVP to form PVPA, illustrating the greater affinity for water of PVPA compared to PDEVP. Fig. 6 shows a slow increase in water uptake for low IEC copolymers, followed by a strong increase in water uptake for PPOgPDEVP and PPOgPVPA (Table 2) membranes with values above 3.6 and 4.8 mmol g−1, respectively. While not obvious from the AFM images in Fig. 5, this was a likely indication of a change in the morphology and the ability of the PVPA and PDEVP segments to accommodate a much greater number of water molecules per phosphonate group. The abrupt increase in water uptake at a specific IEC value was very different from the water uptake characteristics determined for PSUgPVPA membranes,22 which showed a steady increase in water uptake with IEC.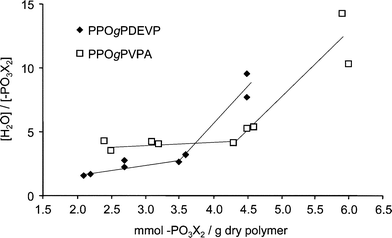 | ||
| Fig. 6 The water uptake of PPOgPDEVP and PPOgPVPA membranes as a function of the IEC, i.e., mmoles phosphonate per gram of dry polymer (X denotes –H and –CH2CH3 for PPOgPVPA and PPOgPDEVP, respectively; the lines are only shown to guide the eye). | ||
Also of note is the increasing water uptake with a decreasing DL for copolymers with similar, high IEC values. The water uptake of PPOgPVPA9 (DL = 0.075) was 50% higher than for the more densely grafted PPOgPVPA6 (DL = 0.15), although both copolymers had an IEC of 6.0 mmol g−1. At a constant IEC, a decrease in DL will increase the chain length and lead to an increased size of PVPA domains. The effect of the DL was, however, not observed for membranes with IEC values below 4.8 mmol g−1, where the water uptake was moderate with increasing IEC values.
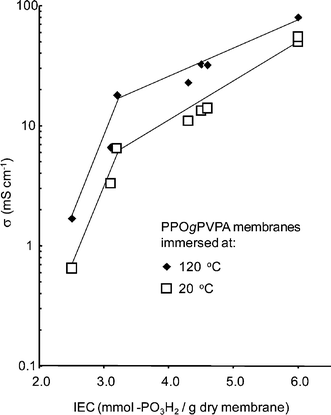
The proton conductivity of the PPOgPVPA membranes fully immersed in water was measured from −20 up to 120 °C, and the results are plotted in Fig. 7. The corresponding data for Nafion® 117 was included for reference. As can be seen, the conductivity increased sharply between −20 and 0 °C because of the melting of the absorbed water and reached high values at higher temperatures. The effect of the melting water was most pronounced for the Nafion® 117 membrane. As expected, the PVPA content and the subsequent water uptake was the dominant factor in influencing the membrane conductivity, with a 40 fold increase from 2 to 80 mS cm−1 at 120 °C when increasing the IEC from 2.5 to 6.0 mol g−1. The effect of the PVPA content was most pronounced at low IEC values between 2.5 and 3.0 mmol g−1, increasing 10 fold, but there was still a strong increase from 3.0 to 6.0 mmol g−1, as shown in Fig. 8. On the other hand, the DL and PVPA chain length appeared to have had little influence on the conductivity, as all the membranes fell on the same trend line regardless of the DL. This is in contrast with the previously noted water uptake for the two copolymers with an IEC of 6.0 and is likely due to a dilution of the phosphonic acid moieties, which disfavors the membrane with the highest water uptake. The conductivity of 80 mS cm−1 for the highest PVPA contents at 120 °C is very close to the value of 93 mS cm−1 achieved for PSUgPVPA under the same conditions.22 Thus, the similar water uptake characteristics and conductivities of the two copolymers implied that their morphologies were equally efficient for proton transport.
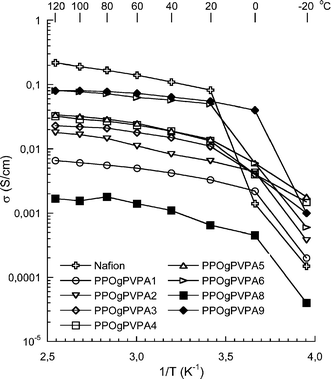 | ||
| Fig. 7 Conductivity data for the PPOgPVPA membranes measured by EIS under immersed conditions in a sealed cell from −20 to 120 °C. The corresponding data for Nafion® 117 has been added for reference. | ||
Conclusions
PPO was conveniently grafted by lithiation and anionic polymerization of DEVP in a single step. Film formation and subsequent hydrolysis of PDEVP to PVPA gave highly proton conducting, thermally stable membranes. The membrane water uptake was found to depend strongly on the IEC at values greater than 4.0 mmol g−1 polymer for PPOgPVPA. Increasing IEC and water uptake led to increased conductivity up to 80 mS cm−1 for PPOgPVPA with an IEC of 6.0 mmol g−1 of polymer. The water uptake showed a strong dependence on the value of DL at the highest IEC (6.0 mmol g−1). However, the conductivity remained unchanged, most likely due to the dilution of the phosphonic acid groups as the water uptake increased. The copolymers were found to be thermally stable up to nearly 400 °C with only loss of water due to reversible anhydride formation between phosphonic acid groups. While there is a strong difference in the hydrophilic/hydrophobic segments of the copolymer, and AFM measurements clearly indicated nanophase separation of the PPO and PDEVP phases, only single glass transitions were observed by DSC for both the PPOgPDEVP and PPOgPVPA membranes.Acknowledgements
This work was funded by the Integrated Project AUTOBRANE under the 6th Framework Program of the European Commission.References
- W. L. Harrison, M. A. Hickner, Y. S. Kim and J. E. McGrath, Fuel Cells, 2005, 5, 201 CrossRef CAS
.
- P. Jannasch, Fuel Cells, 2005, 5, 248 CrossRef CAS
.
- C. Iojoiu and J.-Y. Sanchez, High Perform. Polym., 2009, 21, 673 CrossRef CAS
.
- T. Higashihara, K. Matsumoto and M. Ueda, Polymer, 2009, 50, 5341 CrossRef CAS
.
- K. D. Kreuer, J. Membr. Sci., 2001, 185, 29 CrossRef CAS
.
- K. A. Mauritz and R. B. Moore, Chem. Rev., 2004, 104, 4535 CrossRef CAS
.
-
B. Lafitte and P. Jannasch, On the prospects for phosphonated polymers as proton-exchange fuel cell membranes, in Advances in Fuel Cells, ed. T. S. Zhao, K. D. Kreuer and T. Van Nguyen, 2007, Elsevier, Oxford, vol. 1, pp. 119–185 Search PubMed
.
- A. L. Rusanov, P. V. Kostoglodov, M. J. Abadie, V. Y. Voytekunas and D. Y. Likhachev, Adv. Polym. Sci., 2008, 216, 125 CAS
.
- D. J. Jones and J. Roziere, Adv. Polym. Sci., 2008, 215, 219–245 CAS
.
- M. Schuster, T. Rager, A. Noda, K. D. Kreuer and J. Maier, Fuel Cells, 2005, 5, 355 CrossRef CAS
.
- H. Steininger, M. Schuster, K. D. Kreuer, A. Kaltbeitzel, B. Bingol, W. H. Meyer, S. Schauff, G. Brunklaus, J. Maier and H. W. Spiess, Phys. Chem. Chem. Phys., 2007, 9, 1764 RSC
.
- H. Steininger, M. Schuster, K. D. Kreuer and J. Maier, Solid State Ionics, 2006, 177, 2457 CrossRef CAS
.
- B. Lafitte and P. Jannasch, J. Polym. Sci., Part A: Polym. Chem., 2005, 43, 273 CrossRef CAS
.
- B. Lafitte and P. Jannasch, J. Polym. Sci., Part A: Polym. Chem., 2007, 45, 269 CrossRef CAS
.
- T. Bock, H. Mohwald and R. Mulhaupt, Macromol. Chem. Phys., 2007, 208, 1324 CrossRef CAS
.
- H. G. Herz, K. D. Kreuer, J. Maier, G. Scharfenberger, M. F. H. Schuster and W. H. Meyer, Electrochim. Acta, 2003, 48, 2165 CrossRef CAS
.
- M. F. H. Schuster, W. H. Meyer, M. Schuster and K. D. Kreuer, Chem. Mater., 2004, 16, 329 CrossRef CAS
.
- J. C. Persson and P. Jannasch, Macromolecules, 2005, 38, 3283 CrossRef CAS
.
- J. C. Persson and P. Jannasch, Chem. Mater., 2006, 18, 3096 CrossRef CAS
.
- S. Granados-Focil, R. C. Woudenberg, O. Yavuzcetin, M. T. Tuominen and E. B. Coughlin, Macromolecules, 2007, 40, 8708 CrossRef CAS
.
- G. Frutsaert, L. Delon, G. David, B. Ameduri, D. J. Jones, X. Glipa and J. Roziere, J. Polym. Sci., Part A: Polym. Chem., 2010, 48, 223 CrossRef CAS
.
- J. Parvole and P. Jannasch, Macromolecules, 2008, 41, 3893 CrossRef CAS
.
- R. Perrin, M. Elomaa and P. Jannasch, Macromolecules, 2009, 42, 5146 CrossRef CAS
.
- Y. J. Lee, B. Bingol, T. Murakhtina, D. Sebastiani, W. H. Meyer, G. Wegner and H. W. Spiess, J. Phys. Chem. B, 2007, 111, 9711 CrossRef CAS
.
- A. Kaltbeitzel, S. Schauff, H. Steininger, B. Bingol, G. Brunklaus, W. H. Meyer and H. W. Spiess, Solid State Ionics, 2007, 178, 469 CrossRef CAS
.
- S. U. Celik, U. Akbey, R. Graf, A. Bozkurt and H. W. Spiess, Phys. Chem. Chem. Phys., 2008, 10, 6058 RSC
.
- F. Jiang, A. Kaltbeitzel, W. H. Meyer, H. Pu and G. Wegner, Macromolecules, 2008, 41, 3081 CrossRef CAS
.
- F. Jiang, A. Kaltbeitzel, B. Fassbender, G. Brunklaus, H. Pu, W. H. Meyer, H. W. Spiess and G. Wegner, Macromol. Chem. Phys., 2008, 209, 2494 CrossRef CAS
.
- A. Aslan and A. Bozkurt, J. Power Sources, 2009, 191, 442 CrossRef CAS
.
- D. Markova, A. Kumar, M. Klapper and K. Mullen, Polymer, 2009, 50, 3411 CrossRef CAS
.
- T. Xu, D. Wu and L. Wu, Prog. Polym. Sci., 2008, 33, 894 CrossRef CAS
.
- S.-W. Kuo, C.-F. Huang, P.-H. Tung, W.-J. Huang, J.-M. Huang and F.-C. Chang, Polymer, 2005, 46, 9348 CrossRef CAS
.
- M. Liang, Y.-J. Jhuang, C.-F. Zhang, W.-J. Tsai and H.-C. Feng, Eur. Polym. J., 2009, 45, 2348 CrossRef CAS
.
- C. G. Cho, H. Y. Jang, Y. G. You, G. H. Li and S. G. An, High Perform. Polym., 2006, 18, 579 CrossRef CAS
.
- A. J. Chalk and T. J. Hoogeboom, J. Polym. Sci., Part A-1, 1969, 7, 1359 CrossRef CAS
.
- A. J. Chalk and A. S. Hay, J. Polym. Sci., Part A-1, 1969, 7, 691 CrossRef CAS
.
- A. F. Burchat, J. M. Chong and N. Nielson, J. Organomet. Chem., 1997, 542, 281 CrossRef CAS
.
- N. Inagaki, K. Goto and K. Katsuura, Polymer, 1975, 16, 641 CrossRef CAS
.
-
Plastics Flamability Handbook: Pronciples Regulations, Testing, and Approval; J. Troitzsch, Ed.; Hanser Publishers: Munich, 1983; Chapter 5.1.2.2 Search PubMed
.
- Y. S. Yang, A. Siu, T. J. Peckham and S. Holdcroft, Adv. Polym. Sci., 2008, 215, 55 CAS
.
| This journal is © The Royal Society of Chemistry 2010 |

