A reliable method for detecting complexed DNA in vitro†‡
C.
Holladay
,
M.
Keeney
,
B.
Newland
,
A.
Mathew
,
W.
Wang
and
A.
Pandit
*
Network of Excellence for Functional Biomaterials, National University of Ireland, NFB building, IDA business park, Dangan, Newcastle, Galway, Ireland. E-mail: abhay.pandit@nuigalway.ie; Tel: +353 91 49 2758
First published on 8th September 2010
Abstract
Quantification of eluted nucleic acids is a critical parameter in characterizing biomaterial based gene-delivery systems. The most commonly used method is to assay samples with an intercalating fluorescent dye such as PicoGreen®. However, this technique was developed for unbound DNA and the current trend in gene delivery is to condense DNA with transfection reagents, which interfere with intercalation. Here, for the first time, the DNA was permanently labeled with the fluorescent dye Cy5 prior to complexation, an alternative technique hypothesized to allow quantification of both bound and unbound DNA. A comparison of the two methods was performed by quantifying the elution of six different varieties of DNA complexes from a model biomaterial (collagen) scaffold. After seven days of elution, the PicoGreen® assay only allowed detection of three types of complexes (those formed using Lipofectin™ and two synthesised copolymers). However, the Cy5 fluorescent labeling technique enabled detection of all six varieties including those formed via common transfection agents poly(ethylene imine), poly-L-lysine and SuperFect™. This allowed reliable quantification of the elution of all these complexes from the collagen scaffold. Thus, while intercalating dyes may be effective and reliable for detecting double-stranded, unbound DNA, the technique described in this work allowed reliable quantification of DNA independent of complexation state.
Introduction
Many emerging non-viral gene therapy techniques combine nucleic acids with polymers or biomaterials to modify their release or delivery.1–4 Nucleic acid release profiles have therefore become a relatively common component of publications that report on gene delivery. However, in many cases, the techniques described can only accurately quantify release of completely unbound, double-stranded DNA.There are a variety of techniques used in the quantification of DNA. Ultraviolet spectroscopy,5,6 intercalating dyes,7–17 and detection of radiolabeled DNA18–20 are the most commonly employed methods. Ultraviolet spectroscopy is simple and straightforward, using absorption of ultraviolet light at 260 and 280 nm to calculate DNA content. However, this method is effective for detecting DNA in relatively limited sample types as proteins (among other biomolecules) have significant extinction coefficients at the wavelengths used to quantify DNA (260–280 nm).21 To minimize error, DNA release studies that quantify with UV spectroscopy use clear, aqueous buffers such as phosphate-buffered saline or Tris–EDTA.5,21,22
A more robust option is the use of intercalating dyes. These dyes can accommodate themselves between base pairs in double-stranded nucleic acids. Once bound in position, the fluorescence of the molecule is greatly increased. Examples of commonly cited intercalating dyes include PicoGreen® (PG), ethidium bromide and its derivatives, and Hoechst.23 PG is commonly used both for quantifying genomic DNA and in quantifying the release of plasmid DNA from biomaterial scaffolds. When DNA is released without any bound proteins or polymers, intercalating dyes should be effective. However, the recent trend in gene delivery has been towards complexation of plasmids with a variety of novel carriers in order to improve transfection efficiency.3,24–35 Theoretically, tightly bound DNA is not detectable by an intercalating dye as the binding sites are not accessible.23,36,37 If it is possible to fully dissociate the complexes, this is not problematic. However, one of the barriers that reduce the efficiency of non-viral gene delivery is the fact that some transfection reagents are difficult to separate from plasmids.4
In this case, the third technique, radiolabeling is by far the most reliable. Plasmids are modified to include radioactive bases which can later be quantified with radioactive detection techniques. This technique has been used successfully in applications such as plasmid release from a PEG-based hydrogel.20,23 However, both the consumables and equipment are expensive and considerable health and safety precautions must be in place, thereby limiting the popularity of radiolabeling.
The technique described here is conceptually similar to radiolabeling, but instead of radioactive bases a fluorescent dye is covalently attached to purified plasmids, allowing fluorescence-based quantification of the DNA content. Fig. 1 shows a pictorial representation of the concept. It is hypothesized that this technique will allow accurate quantification of DNA concentration independent of complexation. PG and the fluorescent labeling method will be used to detect complexes formed with a variety of transfection reagents. Ultimately, the two techniques will be used to assess the release of a variety of complexes from a standard cross-linked collagen scaffold. If found effective, the technique will simplify and improve the reliability of nucleic acid release studies which are crucial in the characterization of scaffolds intended for gene delivery.
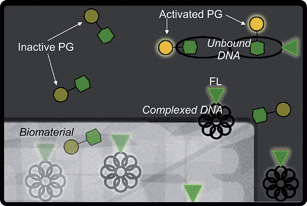 | ||
| Fig. 1 Schematic representation of plasmid DNA detection by PG and FL as DNA elutes from a biomaterial scaffold. The PG dye molecule (represented by the dim yellow circle attached to the green hexagon) is only activated (bright yellow) when associated with unbound DNA, as in the top right corner. The fluorescent label (represented by the glowing green triangle) is glowing in all cases. Thus, PG is only able to detect unbound DNA while FL can detect all DNA. | ||
Experimental
Labeling of plasmids
Gaussia princeps luciferase plasmids (GLuc; New England Biosciences, Ipswich, USA) were propagated and isolated using standard techniques, as described elsewhere.38 These plasmids were then fluorescently labeled (FL) with Cy5 dye using a Cy5 labeling kit (Mirus, Madison, USA). Briefly, the dye was combined with the plasmid in the provided buffers and incubated for 1 hour. At the end of the incubation, the plasmid was purified through a microspin column and stored in a light-protected environment at −20 °C.Complexing of plasmids to transfection reagents
For each set of experiments, a single vial of labeled plasmid was used in order to minimize batch-to-batch variability. Thus, each set of complexes was prepared from the same initial plasmid solution. The ratios used to prepare each variety of complex are detailed in Table 1. These ratios were chosen based on optimized transfection studies.| Polymer | Mass of DNA prepared/µg | Polymer![[thin space (1/6-em)]](https://www.rsc.org/images/entities/char_2009.gif) : :![[thin space (1/6-em)]](https://www.rsc.org/images/entities/char_2009.gif) DNA weight ratio DNA weight ratio |
Polymer concentration |
|---|---|---|---|
| a Linear poly(DMEAMA)–hyperbranched(PEGMEMA/EGDMA) (44 kDa). b Hyperbranched poly(DMAEMA/EGDMA) (14 kDa) where DMAEMA is 2-dimethyl amino ethyl methacrylate, PEGMEMA is poly(ethylene glycol) methyl ether methacrylate and EGDMA is ethylene glycol dimethacrylate. | |||
| Partially degraded polyamidoamine (SuperFect™) | 10 | 15![[thin space (1/6-em)]](https://www.rsc.org/images/entities/char_2009.gif) : :![[thin space (1/6-em)]](https://www.rsc.org/images/entities/char_2009.gif) 1 1 |
3 mg ml−1 |
| Polyethylene imine (PEI) | 10 | 2![[thin space (1/6-em)]](https://www.rsc.org/images/entities/char_2009.gif) : :![[thin space (1/6-em)]](https://www.rsc.org/images/entities/char_2009.gif) 1 1 |
3 mg ml−1 |
| Poly-L-lysine (PLL) | 10 | 2![[thin space (1/6-em)]](https://www.rsc.org/images/entities/char_2009.gif) : :![[thin space (1/6-em)]](https://www.rsc.org/images/entities/char_2009.gif) 1 1 |
3 mg ml−1 |
| Lipofectin™ (Lipo) | 10 | 5![[thin space (1/6-em)]](https://www.rsc.org/images/entities/char_2009.gif) : :![[thin space (1/6-em)]](https://www.rsc.org/images/entities/char_2009.gif) 1 1 |
1 mg ml−1 |
| PD-b-P/Ea | 10 | 10![[thin space (1/6-em)]](https://www.rsc.org/images/entities/char_2009.gif) : :![[thin space (1/6-em)]](https://www.rsc.org/images/entities/char_2009.gif) 1 1 |
3 mg ml−1 |
| PD-Eb | 10 | 6![[thin space (1/6-em)]](https://www.rsc.org/images/entities/char_2009.gif) : :![[thin space (1/6-em)]](https://www.rsc.org/images/entities/char_2009.gif) 1 1 |
3 mg ml−1 |
PLL (40–60 kDa) and PEI (25 kDa) were used as purchased from Sigma, SuperFect™ was purchased from Qiagen and Lipofectin™ from Invitrogen. Deactivation enhanced atom transfer radical polymerization (ATRP) as described by Tai et al. was used to synthesize PD-b-P/E and PD-E.39 ATRP is a particular type of controlled radical polymerization developed in the lab of Dr K. Matyjaszewski at Carnegie Mellon University. It uses a special catalyst which adds one or more monomers at a time to a growing chain. The synthesis process is easily regulated by adjusting temperature or other reaction conditions, thus allowing precise control of polymer structure.40
Elution study
Cross-linked bovine atelocollagen scaffolds as described elsewhere38 were used as a model biomaterial. Complexes in a total volume of 50 µL were added to 1 mg of scaffolds in a black 96 well plate, and the scaffolds incubated for 3 hours. After incubation, 100 µL of 10% serum media were added to each well and scaffolds transferred to the following row immediately afterwards to provide a time 0 elution measurement (wash solution). At each subsequent time point, the scaffolds were transferred to the next row. After 7 days, a full 96 well plate of elution was obtained. Standard curves were prepared in the same plates as samples. All samples were prepared at the same time, and the entire plate was read in the plate reader at the end of the study so that every well was treated identically throughout the experiment. For the curves prepared in Tris–EDTA (TE) buffer (10 mM Tris–HCl and 1 mM EDTA, pH = 7.5), 100 µL of TE were added in place of 100 µL of 10% serum media.Quantification of plasmid
Fluorescence emitted from the PicoGreen® (Invitrogen) (PG) or Cy5 dye (FL) was used to quantify the DNA content. The same sets of wells were quantified with both techniques in order to ensure accurate comparison. Briefly, Cy5 fluorescence was measured by reading the black well plate after the final time point (ex = 649 nm and em = 670 nm) in a Varioskan Flash plate reader (Thermo Scientific, Ireland). FL was measured first because the fluorescence from PG has a small contribution to the total fluorescence intensity at the Cy5 wavelength. Cy5, however, does not have any appreciable signal at the PG detection wavelength. The standard curves were used to relate the fluorescence readings to known plasmid content. For PG analysis, 100 µL of 1×dye were added to each well (both standard curves and samples) and incubated for 5 minutes before being read (ex = 485 nm and em = 530 nm) in the same plate reader.Statistics
Results are expressed as mean ± standard deviation. Regression analysis of standard curves was performed in SPSS using mean data. A p value greater than 0.05 was considered statistically significant.Results
The process of complexation was found to significantly decrease the PG signal intensity, as shown in Fig. 2. The decrease in PG signal was a transient process, i.e. immediately after complexation, no statistical difference was found between the PG signal in the PD-b-P/E and PD-E groups compared to the naked plasmid control, but after 7 days the signal level in these samples was approximately 70% that of naked plasmid control. Initially, the SF, PEI, and PLL samples had signal levels 60–70% of the control, but after 7 days the PG signal was not statistically different from samples containing no DNA. Thus, in order to correctly quantify DNA content via PG, it is critical that samples and standard curves be prepared at the same time. Otherwise, the actual DNA quantity in samples would be consistently underestimated.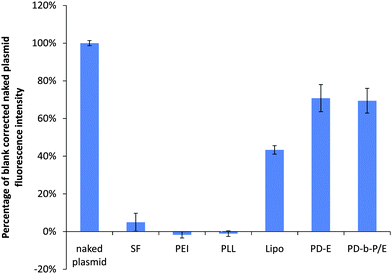 | ||
| Fig. 2 Comparison of PG fluorescence levels of 1 µg of plasmid after 7 days as a function of complexation agent. The blank-subtracted fluorescence intensity of the plasmid decreased approximately 20 fold when the plasmid was complexed with SF. The signal in the PEI and PLL samples was negligibly different to the blanks. Lipo, PD-E, and PD-b-P/E retained approximately 43%, 71%, and 69% of the fluorescent intensity obtained with uncomplexed plasmids. Data expressed as mean ± standard deviation, n = 3, p < 0.05. | ||
The standard curves in Fig. 3a have acceptably high Pearson's coefficients (>0.99), thus implying quantification of complexes prepared with Lipo, PD-E, and PD-b-P/E is feasible using the PG technique. However, complexes prepared with SF, PEI, and PLL were not reliably detected with PG after 7 days, as shown in both Fig. 2 and 3b, which shows the standard curves prepared with the three complexation agents. Regression analysis of the 4 curves in Fig. 3b indicated no significant relationship between the PG signal and the mass of plasmid, and thus the curves could not be used for quantification of samples.
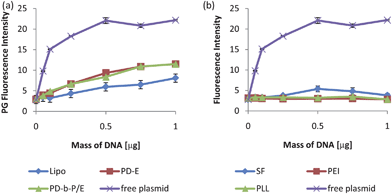 | ||
| Fig. 3 Sample standard curves measured with PG 7 days after preparation. The standard curves for Lipo, PD-E, and PD-b-P/E (a) were acceptable, with Pearson's coefficients of 0.99, 0.97, and 0.98 respectively. For SF, PEI, and PLL, however, regression analysis indicated no significant trend, and thus the standard curves could not be used for sample quantification (b). The standard curves prepared with free plasmid are included in both figures for comparison. The fluorescence intensity from the plasmid reached the detection maximum by 0.5 µg which is why the values reach a plateau. Thus, PG could not be used to quantify DNA content in containing SF, PEI, or PLL complexes. Data expressed as mean ± standard deviation, n = 3, p < 0.05. | ||
In contrast to the PG technique, the standard curves measured with FL after 7 days, as shown in Fig. 4, all have statistically significant slopes. The lowest Pearson's coefficient for these curves was 0.994. Thus, all of these standard curves were reliable and could be used for sample quantification. While there is quenching (up to 60% reduction in maximum fluorescence value), the standard curves for each type of complex should have the same amount of quenching as the samples, and thus can be reliably used for quantification.
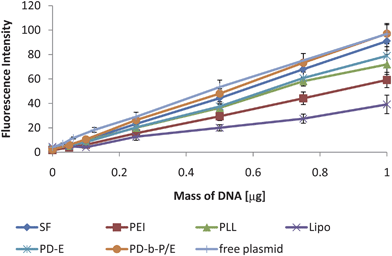 | ||
| Fig. 4 Sample standard curves measured via FL. While there is variability in the slopes of the curves, the lowest Pearson's coefficient was 0.994 and all trends were significant. Thus, the DNA quantification is reliable with all six varieties of complexes. A standard curve prepared with free plasmid DNA was included as well to show that there is a decrease in the slope due to complexation, but all slopes are linear. Data expressed as mean ± standard deviation, n = 3, p < 0.05. | ||
As a final test of the technique, elution from a common biomaterial scaffold was measured for each of the six complex varieties. The general shapes of the curves (as shown in Fig. 5) are similar to other elution curves described in the literature.10 Lipo was observed to have the lowest initial release, but had the highest rate of release over the first 24 hours (about 81% of plasmid was released from the scaffold), after which no significant elution was observed. PLL had relatively low encapsulation efficiency, with approximately 50% of the complexes detected in the wash solution at time 0. SF, PEI, PD-E, and PD-b-P/E were all observed to release continuously over 7 days. When the same wells were analyzed using PG, as shown in Fig. S1†, significantly lower plasmid release was observed (30–50% lower plasmid release was observed using the PG technique).
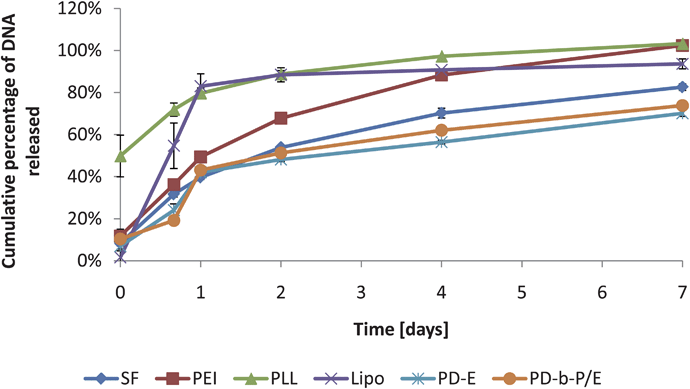 | ||
| Fig. 5 Plasmid release measured with FL with a variety of complexation agents as a function of time. All scaffolds were loaded with 1 µg of complexes and treated identically afterwards. Data expressed as mean ± standard deviation, n = 3, p < 0.05. | ||
Discussion
Complexation of plasmid with polymers, as shown in Fig. 2 and 3, greatly decreases the fluorescent intensity measurable via PG. This implies a reduction in the binding of the intercalating portion of the dye to the double helix of the DNA. This is plausible, considering that complexation is hypothesized to involve in winding of the molecule around the smaller complexation molecules.23,27,35,36,41–43 The reduction in fluorescence intensity may actually provide an indication of the tightness of binding.23,37 Possible evidence of this is that the three polymers with the greatest reduction in PG fluorescence intensity, SF, PEI and PLL, are highly effective DNA binding agents.36,37,41,43–45 Hypothetically, highly effective binding agents should reduce the ability of PG to intercalate, thereby reducing the PG signal.All of the FL standard curves shown in Fig. 4 had high determination coefficients (>0.988), while PG was only effective in detecting three out of six varieties of complexes (Fig. 3), and with slightly lower coefficients of determination (0.945 to 0.983). As discussed, the three varieties of complex that PG did not detect (SF, PEI, and PLL) are among the most popular transfection reagents described in gene delivery literature.28,30 These reagents bind DNA extremely effectively, thereby interfering with PG binding. However, the three of the six compounds were detectable. These were Lipo (Lipofectin™), a liposome, PD-E, a hyper-branched polymer, and PD-b-P/E, a linear polymer with a hyper-branched PEG-based modification. While this is not necessarily a reflection of their transfection efficiency, it may reflect differences in how the reagents bind DNA.
For example, in a recent release study, Hoechst, another intercalating dye, was seen to have similar fluorescence levels before and after DNA was combined with Lipo.46 This may be because Lipo allows the DNA to remain in an expanded form,47 and thus binding sites are still largely accessible. Both PD-E and PD-b-P/E use a tertiary amine (present in the DMAEMA monomer) in contrast to SF, PEI and PLL, which use primary amines (along with others) to bind DNA. Differences in DNA binding strength between these types of amines may arise due to the varying surrounding alkyl groups (both through steric and inductive effects). As PEI, PLL and SF are all high in primary amines, they may cause structural changes in the DNA which affects intercalation of PG. Lipo, PD-E and PD-b-P/E may complex DNA with less alteration of the structure of the molecule, thus allowing some PG binding to occur. It should be noted that while PG is able to detect the complexes, there is not necessarily a higher fraction of free DNA in the solutions.
A significant advantage of this technique is that the standard curves are prepared and detected under precisely the same conditions and at the same time as the samples and thus both user variability and batch-to-batch variability can be minimized. When standard curves are prepared at the time of analysis, a significant, systematic error is introduced because the signal intensity is up to 12% higher in freshly prepared samples. In this technique, the standard curves are prepared and detected at the same time as the samples, so while there is quenching in the FL signal after complexation (up to a maximum of 40% in the case of Lipo), all samples are affected by the same factors and no systematic errors should be introduced.
The elution curves shown in Fig. 5 are similar in shape to those described elsewhere in the literature,8,48 but with a higher maximum release than most curves measured using PG. Elution curves could not be calculated using the PG standard curves for SF, PEI, or PLL. Comparing the curves obtained by measuring the same samples with both techniques in Fig. S1†, it is evident that FL detects significantly more DNA than PG. The difference between the curves is difficult to explain, as the same wells are used and therefore each sample contains precisely the same amount of DNA. Potentially, breakdown products from the collagen scaffold could have bound some fraction of the DNA, interfering with PG detection, or otherwise altered the microenvironment so as to decrease the overall PG signal. The FL elution curves, however, should not be affected.
The only factor that appears to have affected the FL is that complexation results in some loss of signal intensity (0–60% reduction in total fluorescence). This may be related to quenching, but is irrelevant because the standard curves are prepared with the complexes and thus the standard curves have the same degree of signal reduction as the samples. The same is true of photo-bleaching, because all samples are prepared and detected at the same time, and thus all samples should be affected to the same extent by any external factors.
In a previous study, complex elution from a scaffold was calculated using PG.38 However, minimal elution was observed at all time points after 2 days while transfection was observed over almost 14 days. The authors suggested that cells migrating through the scaffold might be exposed to complexes bound to the proteins of the scaffold as a possible explanation for the extended high levels of transfection with essentially no elution.38 However, considering the finding that PG cannot readily detect SF complexes after 7 days, the most likely explanation is that the PG dye could not bind to the complexes and thus it was only able to detect the complexes prepared within the first 48 hours.
The comparison between the complex release in buffer TE and 10% serum media highlights the importance of the elution media. It has been observed in vivo that negatively charged proteins in serum interact with positively charged DNA complexes.44In vitro, Fig. 6 highlights the difference in elution in a typical serum-free buffer, and in 10% serum cell-culture media. In the presence of negatively charged serum proteins, the initial release of complexes was >15% higher and the average cumulative release after 7 days was approximately 10% higher. Thus, where possible, 10% serum media should be used as it is a far more accurate representation of in vivo conditions and yields significantly different elution curves. This decreases the applicability of UV spectroscopy for DNA quantification as the accuracy and sensitivity of UV-based DNA quantification are greatly decreased by the addition of proteins and carbohydrates into the solution.21
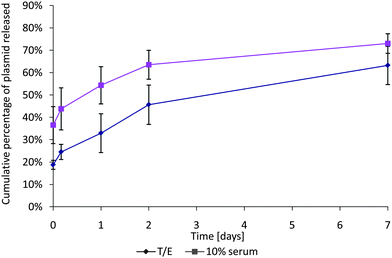 | ||
| Fig. 6 Comparison between elution of SF complexes in serum-free buffer TE and in 10% serum media. The plasmid release is significantly higher in serum than in buffer, and the encapsulation is about 18% higher in buffer TE. Data expressed as mean ± standard deviation, n = 3, p < 0.05. | ||
A combination of the PG and FL techniques may provide a more complete understanding of the elution process. PG is highly effective at detecting free DNA, while FL indicates the total amount of DNA in the well. Thus, it is possible to calculate the total amount of DNA eluted with the FL technique and the fraction of the DNA that is unbound with PG. To illustrate, Fig. S2† compares the fractions of free DNA and total amount of DNA eluted after 7 days. The lowest fraction of free DNA was seen with PLL (∼1.1%) and the highest fraction with PD-b-P/E (15.4%). This could be valuable for understanding the mechanisms of elution-based transfection, as free DNA has very low transfection efficiency in vitro. It could also be valuable for the characterization of new DNA-binding polymers like PD-E and PD-b-P/E.
Quantification of complexed DNA via fluorescent labeling was found to be significantly more reliable than detection of those complexes with an intercalating dye such as PicoGreen®. The intercalating dye could not readily detect SF, PEI and PLL complexes and could only detect a fraction of Lipo, PD-E and PD-b-P/E. The fluorescently labeled plasmids yielded perfect standard curves 7 days after preparation, with minimal loss in sensitivity. Sample elution curves from a commonly used biomaterial were obtained. When compared to a previously published curve obtained with PG, these elution curves highlight the limitations of the PicoGreen® assay—limitations which the fluorescent labeling technique is not subject to. Thus, quantification of complexed DNA can be accurately preformed over time by covalently labeling plasmids with a fluorescent dye prior to complexation.
Abbreviations
| PG | PicoGreen® |
| FL | fluorescent labeling technique |
| PAMAM | polyamidoamine dendrimer |
| GLuc | Gaussia princeps luciferase |
| DMAEMA | 2-dimethyl amino ethyl methacrylate |
| PEGMEMA | poly(ethylene glycol) methyl ether methacrylate |
| EGDMA | ethylene glycol dimethacrylate |
| PD-b-P/E | linear poly(DMEAMA)–hyperbranched(PEGMEMA/EGDMA) |
| PD-E | hyperbranched poly(DMAEMA/EGDMA) |
| SF | SuperFect™ |
| PEI | poly(ethylene imine) |
| PLL | poly-L-lysine |
| Lipo | lipofectin™ |
| TE | Tris–EDTA buffer |
Acknowledgements
Thanks to Mr Anthony Sloan for editorial assistance and Dr Aram Saeed for useful discussion.References
- C. W. Pouton and L. W. Seymour, Key issues in non-viral gene delivery, Adv. Drug Delivery Rev., 1998, 46, 187–203.
- L. De Laporte and L. D. Shea, Matrices and scaffolds for DNA delivery in tissue engineering, Adv. Drug Delivery Rev., 2007, 59, 292–307 CrossRef.
- S. Y. Wong, J. M. Pelet and D. Putnam, Polymer systems for gene delivery-past, present, and future, Prog. Polym. Sci., 2007, 32, 799–837 CrossRef CAS.
- D. V. Schaffer, N. A. Fidelman, N. Dan and D. A. Lauffenburger, Vector unpacking as a potential barrier for receptor-mediated polyplex gene delivery, Biotechnol. Bioeng., 2000, 67(5), 598–606 CrossRef CAS.
- Q. K. Lin, K. F. Ren and J. Ji, Hyaluronic acid and chitosan–DNA complex multilayered thin film as surface-mediated nonviral gene delivery system, Colloids Surf., B, 2009, 74, 298–303 CrossRef CAS.
- A. U. Bielinska, C. L. Chen, J. Johnson and J. R. Baker, DNA complexing with polyamidoamine dendrimers: implications for transfection, Bioconjugate Chem., 1999, 10, 843–850 CrossRef CAS.
- G. Pitarresi, R. Calabrese, F. S. Palumbo, M. Licciardi and G. Giammona, Polysaccharide/polyaminoacid composite scaffolds for modified DNA release, Int. J. Pharm., 2009, 382, 7–14 CrossRef CAS.
- D. Luo, K. Woodrow-Mumford, N. Belcheva and W. M. Saltzman, Controlled DNA delivery systems, Pharm. Res., 1999, 16, 1300–1308 CrossRef CAS.
- I. K. Ko, A. Ziady, S. W. Lu and Y. J. Kwon, Acid-degradable cationic methacrylamide polymerized in the presence of plasmid DNA as tunable non-viral gene carrier, Biomaterials, 2008, 29, 3872–3881 CrossRef CAS.
- H. M. Nie and C. H. Wang, Fabrication and characterization of PLGA/HAp scaffolds for delivery of BMP-2 plasmid composite DNA, J. Controlled Release, 2007, 120, 111–121 CrossRef CAS.
- S. Premaraj, B. Mundy, J. Parker-Barnes, P. Winnard and A. Moursi, Collagen gel delivery of Tgf-B2 non-viral plasmid DNA in rat osteoblast and calvarial culture, Orthodont. Craniofacial Res., 2005, 8, 320–322 Search PubMed.
- R. M. Capito and M. Spector, Collagen scaffolds for nonviral IGF-1 gene delivery in articular cartilage tissue engineering, Gene Ther., 2007, 14, 721–732 CrossRef CAS.
- X. Xu, R. M. Capito and M. Spector, Delivery of plasmid IGF-1 to chondrocytes via cationized gelatin nanoparticles, J. Biomed. Mater. Res., Part A, 2008, 84a, 73–83 CrossRef CAS.
- M. Dadsetan, J. P. Szatkowski, K. L. Shogren, M. J. Yaszemski and A. Maran, Hydrogel-mediated DNA delivery confers estrogenic response in nonresponsive osteoblast cells, J. Biomed. Mater. Res., Part A, 2009, 91a, 1170–1177 CrossRef CAS.
- A. J. Ditto, P. N. Shah, L. R. Gump and Y. H. Yun, Nanospheres formulated from L-tyrosine polyphosphate exhibiting sustained release of polyplexes and in vitro controlled transfection properties, Mol. Pharmaceutics, 2009, 6, 986–995 CrossRef CAS.
- A. Sano, M. Maeda and S. Nagahara, et al., Atelocollagen for protein and gene delivery, Adv. Drug Delivery Rev., 2003, 55, 1651–1677 CrossRef CAS.
- A. S. Juan, G. Ducrocq, H. Hlawaty, I. Bataille, E. Guénin, D. Letourneur and L. J. Feldman, Tubular cationized pullulan hydrogels as local reservoirs for plasmid DNA, J. Biomed. Mater. Res., Part A, 2007, 83a, 819–827 CrossRef.
- J. F. KukowskaLatallo, A. U. Bielinska, J. Johnson, R. Spindler, D. A. Tomalia and J. R. Baker, Efficient transfer of genetic material into mammalian cells using starburst polyamidoamine dendrimers, Proc. Natl. Acad. Sci. U. S. A., 1996, 93, 4897–4902 CrossRef CAS.
- M. Hussain, M. S. Shchepinov, M. Sohail, I. F. Benter, A. J. Hollins, E. M. Southern and S. Akhtar, A novel anionic dendrimer for improved cellular delivery of antisense oligonucleotides, J. Controlled Release, 2004, 99, 139–155 CrossRef CAS.
- J. A. Wieland, T. L. Houchin-Ray and L. D. Shea, Non-viral vector delivery from PEG-hyaluronic acid hydrogels, J. Controlled Release, 2007, 120, 233–241 CrossRef CAS.
- M. J. Holden, R. J. Haynes, S. A. Rabb, N. Satija, K. Yang and J. R. Blasic, Factors affecting quantification of total DNA by UV spectroscopy and picogreen fluorescence, J. Agric. Food Chem., 2009, 57, 7221–7226 CrossRef CAS.
- S. Son and W. J. Kim, Biodegradable nanoparticles modified by branched polyethylenimine for plasmid DNA delivery, Biomaterials, 2010, 31, 133–143 CrossRef CAS.
- D. Shcharbin, E. Pedziwiatr and M. Bryszewska, How to study dendriplexes I: characterization, J. Controlled Release, 2009, 135, 186–197 CrossRef CAS.
- M. A. Mintzer and E. E. Simanek, Nonviral vectors for gene delivery, Chem. Rev., 2009, 109, 259–302 CrossRef CAS.
- B. Barteau, R. Chevre, E. Letrou-Bonneval, R. Labas, O. Lambert and B. Pitard, Physicochemical parameters of non-viral vectors that govern transfection efficiency, Curr. Gene Ther., 2008, 8, 313–323 Search PubMed.
- H. Boulaiz, J. A. Marchal, J. Prados, C. Melguizo and A. Aranega, Non-viral and viral vectors for gene therapy, Cell. Mol. Biol., 2005, 51, 3–22 Search PubMed.
- C. Dufes, I. F. Uchegbu and A. G. Schatzlein, Dendrimers in gene delivery, Adv. Drug Delivery Rev., 2005, 57, 2177–2202 CrossRef CAS.
- H. Eliyahu, Y. Barenholz and A. J. Domb, Polymers for DNA delivery, Molecules, 2005, 10, 34–64 Search PubMed.
- H. K. Haider, I. Elmadbouh, M. Jean-Baptiste and M. Ashraf, Nonviral vector gene modification of stem cells for myocardial repair, Mol. Med., 2008, 14, 79–86 CAS.
- H. C. Kang, M. Lee and Y. H. Bae, Polymeric gene carriers, Crit. Rev. Eukaryotic Gene Expression, 2005, 15, 317–342 Search PubMed.
- S. Kawakami, Y. Higuchi and M. Hashida, Nonviral approaches for targeted delivery of plasmid DNA and oligonucleotide, J. Pharm. Sci., 2008, 97, 726–745 CrossRef CAS.
- B. Martin, M. Sainlos and A. Aissaoui, et al., The design of cationic lipids for gene delivery, Curr. Pharm. Des., 2005, 11, 375–394 CrossRef CAS.
- A. Ragusa, I. Garcia and S. Penades, Nanoparticles as nonviral gene delivery vectors, IEEE Trans. NanoBiosci., 2007, 6, 319–330 CrossRef.
- N. M. Rao and V. Gopal, Cationic lipids for gene delivery in vitro and in vivo, Expert Opin. Ther. Pat., 2006, 16, 825–844 Search PubMed.
- P. Vicennati, A. Giuliano, G. Ortaggi and A. Masotti, Polyethylenimine in medicinal chemistry, Curr. Med. Chem., 2008, 15, 2826–2839 CrossRef CAS.
- P. Lampela, P. Soininen, A. Urtti, P. T. Mannisto and A. Raasmaja, Synergism in gene delivery by small PEIs and three different nonviral vectors, Int. J. Pharm., 2004, 270, 175–184 CrossRef CAS.
- L. Zhou, L. Gan, H. Li and X. Yang, Studies on the interactions between DNA and PAMAM with fluorescent probe [Ru(phen)2dppz]2+, J. Pharm. Biomed. Anal., 2007, 43, 330–334 CrossRef CAS.
- C. Holladay, M. Keeney, U. Greiser, M. Murphy, T. O'Brien and A. Pandit, A matrix reservoir for improved control of non-viral gene delivery, J. Controlled Release, 2009, 136, 220–225 CrossRef CAS.
- H. Tai, W. Wang and T. Vermonden, et al., Thermoresponsive and photocrosslinkable PEGMEMA–PPGMA–EGDMA copolymers from a one-Step ATRP synthesis, Biomacromolecules, 2009, 10, 822–828 CrossRef CAS.
- J.-S. Wang and K. Matyjaszewski, Controlled/”living” radical polymerization: atom transfer radical polymerization in the presence of transition-metal complexes, J. Am. Chem. Soc., 1995, 117, 5614–5615 CrossRef CAS.
- D. K. Smith, Dendrimers and the double helix—from DNA binding towards gene therapy, Curr. Top. Med. Chem., 2008, 8, 1187–1203 CrossRef.
- D. G. Shcharbin, B. Klajnert and M. Bryszewska, Dendrimers in gene transfection, Biochemistry (Moscow), 2009, 74, 1070–1079 CrossRef CAS.
- P. P. Kundu and V. Sharma, Synthetic polymeric vectors in gene therapy, Curr. Opin. Solid State Mater. Sci., 2008, 12, 89–102 CrossRef CAS.
- M. Ruponen, P. Honkakoski, S. Rönkkö, J. Pelkonen, M. Tammi and A. Urtti, Extracellular and intracellular barriers in non-viral gene delivery, J. Controlled Release, 2003, 93, 213–217 CrossRef CAS.
- A. K. Pannier and L. D. Shea, Controlled release systems for DNA delivery, Mol. Ther., 2004, 10, 19–26 CrossRef CAS.
- P. Lei, R. M. Padmashali and S. T. Andreadis, Cell-controlled and spatially arrayed gene delivery from fibrin hydrogels, Biomaterials, 2009, 30, 3790–3799 CrossRef CAS.
- L. A. Wangerek, H.-H. M. Dahl and T. J. Senden, et al., Atomic force microscopy imaging of DNA-cationic liposome complexes optimised for gene transfection into neuronal cells, J. Gene Med., 2001, 3, 72–81 CrossRef CAS.
- H. Hosseinkhani, Y. Inatsugu, Y. Hiraoka, S. Inoue, H. Shimokawa and Y. Tabata, Impregnation of plasmid DNA into three-dimensional scaffolds and medium perfusion enhance in vitro DNA expression of mesenchymal stem cells, Tissue Eng., 2005, 11, 1459–1475 CrossRef CAS.
Footnotes |
| † Electronic supplementary information (ESI) available: Figures showing total and free plasmid release and a comparison of release profiles quantified by the two methods. See DOI: 10.1039/c0nr00456a |
| ‡ Research support: Funding for this project was provided by Science Foundation Ireland, Strategic Research Cluster under Grant No. 07/SRC/B1163. |
| This journal is © The Royal Society of Chemistry 2010 |
