DOI:
10.1039/C0NR00246A
(Paper)
Nanoscale, 2010,
2, 2131-2138
Received
15th April 2010
, Accepted 30th June 2010
First published on
8th September 2010
Abstract
Polyaniline-intercalated layered vanadium oxide nanocomposites were successfully synthesized by an one-pot hydrothermal method and characterized by X-ray diffraction (XRD), scanning electron microscopy (SEM), transmission electron microscopy (TEM), high resolution transmission electron microscopy (HRTEM), selected area electron diffraction (SAED), Fourier transform infrared spectroscopy (FT-IR), and Raman spectroscopy. The effects of reaction conditions, such as pH value of the precursor solution, reaction temperature and time, and the amount of aniline on the structure and morphology of the obtained samples, were systematically investigated. Based on the experimental results, an in situ intercalation-polymerization-exfoliation mechanism was put forward for the formation of layered nanocomposites. The application of the resulting layered nanocomposite as the cathode material in lithium battery was tested and the results showed that the polyaniline-intercalated layered vanadium oxide nanocomposite prepared at 140 °C had a good cycling performance and might act as a promising cathode material for high-energy-density rechargeable lithium batteries.
Introduction
Vanadium oxides and their related compounds have been investigated both extensively and intensively due to their novel physicochemical properties and potential applications in lithium batteries,1 electric field-effect transistors2–4 and chemical sensors.5,6 The layered structure and redox ability of vanadium oxides allow the insertion of various guest species such as polymers, leading to the formation of hybrid materials with a mixed valence of vanadium (V4+/V5+).7 Organic–inorganic hybrid structures have been designed to achieve new materials with improved properties because of the synergic effects of their constituents at a molecular level.8,9 Specifically, the intercalation of conducting polymers into layered inorganic hosts has been a topic of research interest over the past half century.10–13 Among the family of conducting polymers, polyaniline is of great interest because its electrical and optical properties can be controlled by a simple and reversible acid–base doping–dedoping process.14 Polyaniline–vanadium oxide hybrid material, a new kind of conducting polymer/oxide bronze, has received much attention because of the mixed electronic charge-transport properties10,15,16 and potential applications in lithium secondary batteries,17–19 sensors20 and electrochromic devices.21 Considerable efforts have been made on the synthesis of conventional polyaniline–vanadium oxide hybrid materials via in situ oxidative polymerization/intercalation of aniline in V2O5 xerogel15,16,22 and the layer-by-layer method,23 respectively. However, these methods often involve lengthy procedures with several steps and need more time. Thus, it is necessary to develop more efficient synthetic methods to simplify preparation procedures and shorten time. Recently, the hydrothermal and ultrasound routes to prepare polyaniline–vanadium oxide hybrid nanomaterials have drawn more attention in this regard. For example, C. Zhang et al. have reported a one-step hydrothermal reaction between aniline and peroxovanadic acid to prepare polyaniline–vanadium oxide hybrid hierarchical architectures.24 Malta et al. have reported an ultrasound route to synthesize hybrid vanadium–polyaniline nanowires starting from crystalline V2O5 and aniline.25 Nevertheless, these reports are mainly focused on the specific preparation methods, and there is still little work, which is not systemized, on the one-pot synthesis of polyaniline-intercalated layered vanadium oxide nanocomposites and their application in lithium battery.
Herein, we report an efficient method for the controlled fabrication of polyaniline-intercalated layered vanadium oxide nanocomposites via a facile one-pot hydrothermal route. The effects of the pH value of the precursor solution, reaction temperature and time, and the amount of aniline on the structure and morphology of the resulting product were discussed in detail and an in situ intercalation-polymerization-exfoliation formation mechanism was put forward. Moreover, the potential application of the resulting layered nanocomposite in the lithium battery was investigated.
Experimental section
Preparation of samples
All reagents were of analytical grade and used as received without further purification. Distilled water was used throughout. In a typical procedure, 0.18 g of V2O5 powders were added into 30 mL of distilled water and stirred for 10 min. Then, 60 μL of aniline were added into the slurry solution. The pH value of the precursor solution was adjusted to about 3 through the addition of 3 mol L−1 hydrochloric acid. The slurry solution was stirred for about 30 min and transferred to a 50 mL Teflon-lined autoclave. The autoclave was heated to 120 °C and held for 24 h, then allowed to cool down to room temperature. The dark green precipitate was collected and washed several times with distilled water and anhydrous alcohol, then dried at 60 °C for several hours and kept for further characterization. The samples synthesized at 120 °C and 180 °C are noted as sample 1 and sample 2, respectively.
Characterization
All samples were characterized by powder X-ray diffraction (XRD) on a Philips X'Pert X-ray diffractometer with monochromatized Cu Kα (λ = 1.5418 Å) incident radiation. The size distribution and morphology of all samples were analyzed by TEM observation on a JEOL JEM-200CX transmission electron microscope. SEM images and energy-dispersive X-ray spectra (EDS) were obtained on a JEOL JEM-6300F electron microscope equipped with EDS detector. HRTEM images were taken on a JEOL 2010 microscope at an accelerating voltage of 200 kV. Fourier transform infrared (FT-IR) spectra were acquired with a Nicolet 6700 FT-IR spectrometer using KBr pellets. Raman spectra were recorded on a Renishaw inVia Raman microscope (excited with an Ar+ line at 514 nm).
Electrochemical test
To test the obtained samples as cathode in lithium cells, the as-prepared samples were mixed with carbon black and Teflon powder (Dupont) in a weight ratio of 80![[thin space (1/6-em)]](https://www.rsc.org/images/entities/char_2009.gif) :15:5. Lithium foil (Aldrich) was used as the negative electrode, 1M LiPF6 in EC:DMC = 1:1 was used as the electrolyte, and Celgard 2320 was used as the separator. The cells were assembled in an argon-filled glove box with less than 5 ppm of water and oxygen. Cycling and charge-discharge performances of the testing cells were carried out on a battery test system LAND CT2001A in galvanostatic mode, operating at a constant current density of 29.5 mA g−1 with controlled cut off potentials of 1.8–3.5 V(vs Li/Li+).
:15:5. Lithium foil (Aldrich) was used as the negative electrode, 1M LiPF6 in EC:DMC = 1:1 was used as the electrolyte, and Celgard 2320 was used as the separator. The cells were assembled in an argon-filled glove box with less than 5 ppm of water and oxygen. Cycling and charge-discharge performances of the testing cells were carried out on a battery test system LAND CT2001A in galvanostatic mode, operating at a constant current density of 29.5 mA g−1 with controlled cut off potentials of 1.8–3.5 V(vs Li/Li+).
Results and discussion
Structural study
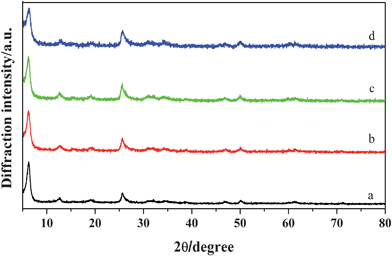
The composition and phase purity of the products were characterized by XRD. Fig. 1 shows the XRD patterns of V2O5 precursor, sample 1 and sample 2. The diffraction peaks in Fig. 1a can be readily indexed to the pure orthorhombic crystalline phase of V2O5 (JCPDS 41-1426, with the lattice constants of a = 1.151 nm, b = 0.3565 nm, c = 0.4372 nm, space group Pmmn) and no characteristic peaks were observed for other impurities. A set of peaks characteristic of (00l) reflections for the layered phase are observed in sample 1 (see Fig. 1b), indicating that polyaniline is intercalated into the layered V2O5 under hydrothermal conditions.15,16 It is concluded that polyaniline-intercalated layered vanadium oxide nanocomposites can be obtained under the present synthetic conditions. The strongest peak observed at the lowest 2θ angle corresponds to the (001) plane of the layered V2O5 structure and is directly related to the interlayer spacing. Upon intercalation, the interlayer spacing of V2O5 is increased from 0.43 to 1.4 nm, which is in good agreement with the result reported by Huguenin et al.19 On the other hand, all the diffraction peaks of sample 2 as shown in Fig. 1c can be indexed to the monoclinic crystalline phase of VO2 (JCPDS 81-2392, with the lattice constants of a = 1.129 nm, b = 0.3702 nm, c = 0.6433 nm) and no characteristic peaks were observed for other impurities.
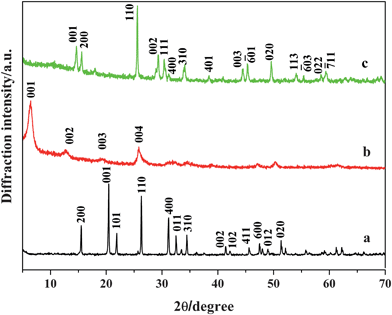 |
| | Fig. 1 XRD pattern of (a) V2O5 precursor, (b) sample 1, and (c) sample 2. | |
The energy-dispersive X-ray spectra (EDS) were measured to determine the chemical composition of the as-prepared samples. As shown in Fig. S1 (supporting information),† sample 1 contains V, O, C and N; however, the atomic ratio of V and O cannot be determined because one peak for the element V overlaps with the peak for the element O.
Fig. 2 presents FT-IR spectra of V2O5 precursor, sample 1, and sample 2. In Fig. 2a, two absorption bands at 3460 and 1643 cm−1 can be attributed to the stretching and bending modes of O–H vibrations, respectively. It means that some water molecules are intercalated into V2O5 layers.26 The absorption bands between 400 and 1050 cm−1 can be indexed to various (group) vibrations of V–O type.26 The characteristic band situated at 1023 cm−1 is related to the V![[double bond, length as m-dash]](https://www.rsc.org/images/entities/char_e001.gif) O stretching, the bands located at 598 and 824 cm−1 can be attributed to the symmetric and asymmetric vibrational modes of the V–O–V stretching in V2O5, respectively.15,27,28 In Fig. 2b, the typical bands of polyaniline can be observed clearly. The peaks in the range of 3200–3500 cm−1 (e.g. 3231 cm−1) are due to the N–H stretching vibrations of the leucoemeraldine component. The characteristic peaks at 1575 cm−1 and 1487 cm−1 are assigned to the CC stretching mode of quinoid and benzenoid rings, respectively. The peaks at 1323 cm−1and 1248 cm−1 correspond to the stretching vibrations of C–N and CN, respectively. The peak at 1138 cm−1 is assigned to the in-plane bending of C–H.20,29 The appearance of all these peaks indicates that protonated polyaniline is formed after the reaction of initial V2O5 precursor with aniline under hydrothermal conditions. The characteristic band of VO stretching at 995 cm−1(Fig. 2c) and 1023 cm−1(Fig. 2a) are of the oxidation and reduction states of the vanadium V4+ and V5+ oxides, respectively.30 The shift of the VO stretching vibration mode from 1023 cm−1 in the V2O5 precursor to 1002 cm−1 in the nanocomposite suggests that V5+ is reduced to V4+ partially.
O stretching, the bands located at 598 and 824 cm−1 can be attributed to the symmetric and asymmetric vibrational modes of the V–O–V stretching in V2O5, respectively.15,27,28 In Fig. 2b, the typical bands of polyaniline can be observed clearly. The peaks in the range of 3200–3500 cm−1 (e.g. 3231 cm−1) are due to the N–H stretching vibrations of the leucoemeraldine component. The characteristic peaks at 1575 cm−1 and 1487 cm−1 are assigned to the CC stretching mode of quinoid and benzenoid rings, respectively. The peaks at 1323 cm−1and 1248 cm−1 correspond to the stretching vibrations of C–N and CN, respectively. The peak at 1138 cm−1 is assigned to the in-plane bending of C–H.20,29 The appearance of all these peaks indicates that protonated polyaniline is formed after the reaction of initial V2O5 precursor with aniline under hydrothermal conditions. The characteristic band of VO stretching at 995 cm−1(Fig. 2c) and 1023 cm−1(Fig. 2a) are of the oxidation and reduction states of the vanadium V4+ and V5+ oxides, respectively.30 The shift of the VO stretching vibration mode from 1023 cm−1 in the V2O5 precursor to 1002 cm−1 in the nanocomposite suggests that V5+ is reduced to V4+ partially.
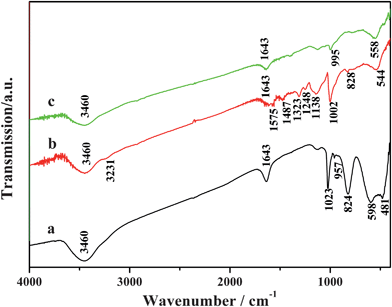 |
| | Fig. 2 FT-IR spectra of (a) V2O5 precursor, (b) sample 1, and (c) sample 2. | |
Fig. 3 shows the Raman spectra of the V2O5 precursor, sample 1, and sample 2. All samples show the typical Raman scattering bands of orthorhombic V2O5, which is in good agreement with those described in the ref. 31 and 32. The low-wavenumber peaks at 143 and 189 cm−1 correspond to the external [VO5]–[VO5] modes, indicating the retention of long range order in these structures.31 The peaks at 686 and 521 cm−1 can be attributed to antiphase bridging V–O and chaining V–O stretching modes, characteristics of orthorhombic V2O5.31,32 The strong peak at 988 cm−1 is attributed to the stretching mode of the vanadyl VO moiety.33
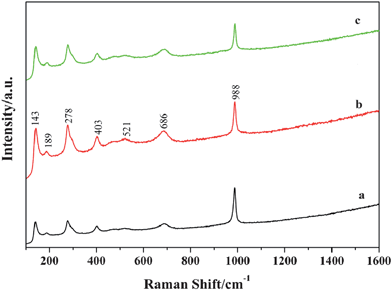 |
| | Fig. 3 Raman spectra of (a) V2O5 precursor, (b) sample 1, and (c) sample 2. | |
Morphology
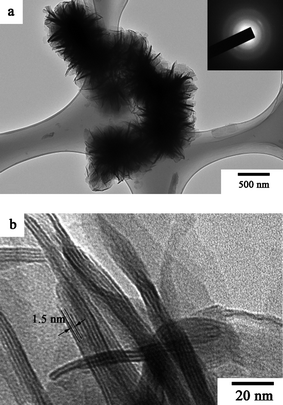
Fig. 4 shows the SEM images of the V2O5 precursor, sample 1 and sample 2. The V2O5 precursor has the morphology of irregular nanoflakes. On the other hand, sample 1, polyaniline-intercalated layered vanadium oxide nanocomposite, has the morphology of white fungus self-assembled from the nanosheets. As shown in the magnified SEM images (Fig. 4d), the thickness of the nanosheets is between 10 and 20 nm, and the typical lateral dimension of the nanosheets is in the range of hundreds of nanometres to several micrometres. In addition, the SEM results also suggest that there is no bulk deposition of polyaniline on the surface of microcrystallites. The 2D white fungus-like nanostructure can also be seen clearly in the corresponding TEM image (Fig. 5a). The thickness and lateral dimension of the nanosheets are consistent with the SEM result. The electron diffraction pattern (inset of Fig. 5a) indicates that the polyaniline-intercalated layered vanadium oxide nanocomposite is quasi-crystalline, which is quite similar to the result reported by Zhang et al.22 More significantly, the HRTEM image in Fig. 5b shows the hierarchical architectures of the obtained layered nanocomposite, suggesting that the in situ redox intercalative polymerization by hydrothermal treatment is topotactic and the layered host structure still remains unchanged. It can also be seen from the HRTEM image that the obtained nanocomposite consists of several conducting polymer nanosheets and the low scattering power caused bright contrast for white lines, each with a width of ∼1.5 nm between two dark fringes of host layers, which is in good agreement with the interlayer spacing d001 = 1.4 nm evaluated from XRD. Thus, from the HRTEM image and XRD, it can be concluded that highly crystalline vanadium oxide layers are separated alternatively by polyaniline nanosheets in the hybrid nanocomposite.
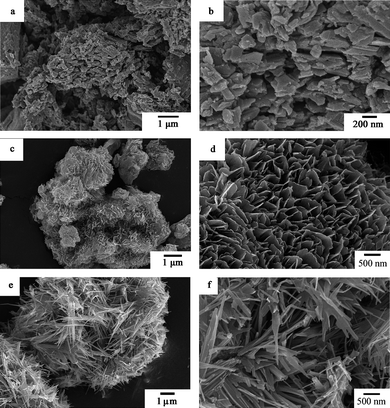 |
| | Fig. 4 SEM images of (a), (b) V2O5 precursor, (c), (d) sample 1, and (e), (f) sample 2. | |
Formation mechanisms
The in situ intercalation and polymerization reaction of aniline with layered V2O5 was carried out under hydrothermal conditions. To further understand the formation mechanism of polyaniline–intercalated layered vanadium oxide nanocomposite, the influences of reaction parameters, such as the pH value of the precursor solution, reaction temperature and time, and the amount of aniline on the structure and morphology of the resulting samples were investigated in detail.
The XRD patterns of the as-prepared samples obtained at different pH values are shown in Fig. 6. The diffraction peaks of all samples can be indexed to the layered phase of the polyaniline-intercalated vanadium oxide nanocomposite. Fig. 7 shows the corresponding SEM images of the as-prepared samples obtained at different pH values. As shown in Fig. 7a, the sample synthesized at pH = 1 has the morphology of nanosheets, and some bulk deposition of polyaniline on the surface of the nanosheet. The samples synthesized at pH = 2, 4, 5 have a similar morphology, but the nanosheets are not assembled in order (Fig. 7b, c, d). It is worth noting that, when the pH value of the precursor solution is adjusted to 7 and 9 through adding 3 mol L−1 ammonia, no precipitate can be obtained after reaction at 120 °C for 24 h. It reveals that an acidic environment is an indispensable condition to synthesize polyaniline-intercalated vanadium oxide nanocomposites. On the one hand, the pH value of the precursor solution influences the species and states of vanadate. According to ref. 34, when the vanadium concentration is 3.3 × 10⁻² mol L−1, and the pH is 1, 2, 3, 4 and 5, the corresponding main phases are attributed to the flocculated, dispersed, dispersed, flocculated and flocculated ribbon samples, respectively. So the samples obtained at pH 1, 4 and 5 are more compactly assembled than the samples obtained at pH 2 and 3. When the pH is 7 and 9, the main phases are attributed to polyvanadates, so no precipitate can be obtained after reaction. On the other hand, the pH value of the precursor solution also influences the charge of the colloid and then the condensation mode and rate. When the pH was lower than 2.6 (isoelectric point of V2O5 sol), the charge of the colloid was positive as H+ was absorbed at the surface of the colloid, and the olation reaction was dominant and gave rise to the corner-sharing chain polymers.35 The lower the pH value, the higher the condensation rate. When the pH was higher than 2.6, the charge of the colloid was negative as OH− was absorbed at the surface of the colloid, and the oxolation reaction was dominant and led to the formation of edge-sharing double chains.35 The higher the pH value, the higher the condensation rate. In addition, considering that the polyanilines obtained at different pH values have different doping degrees, the as-prepared samples obtained at different pH values may have different electronic conductivities and further different performances in lithium ion batteries.
 |
| | Fig. 6 XRD patterns of the as-prepared samples obtained at different pH values (T = 120 °C, t = 24 h). (a) pH = 1, (b) pH = 2, (c) pH = 4, (d) pH = 5. | |
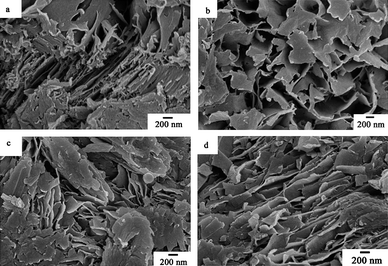 |
| | Fig. 7 SEM images of the as-prepared samples obtained at different pH values (T = 120 °C, t = 24 h). (a) pH = 1, (b) pH = 2, (c) pH = 4, (d) pH = 5. | |
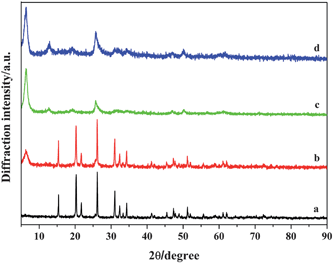
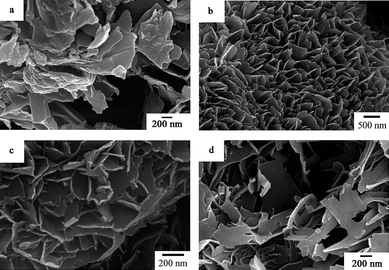
Fig. 8 and Fig. 9 show XRD patterns and SEM images of the as-prepared samples synthesized at different reaction temperatures, respectively. The diffraction peaks of the samples synthesized at 80 °C, 100 °C, 120 °C and 140 °C can be indexed to the layered phase of the polyaniline-intercalated vanadium oxide nanocomposite. As shown in Fig. 9a and Fig. 9b, the sample synthesized at 120 °C has the morphology of white fungus self-assembled from the nanosheets, while the sample synthesized at 140 °C has the morphology of shale self-assembled from the nanosheets. As the temperature is increased to 160 °C, the XRD pattern (Fig. 8e) reveals that the obtained sample is composed of two different phases, i.e. layered phase of the polyaniline-intercalated vanadium oxide nanocomposite and monoclinic crystalline phase of VO2 (JCPDS 81-2392), and the SEM image (Fig. 9c) shows it has a mixed morphology of nanosheets and nanobelts. When the temperature is further increased to 180 °C, all the diffraction peaks of the resulting sample can be indexed to the monoclinic crystalline phase of VO2 (see Fig. 8f) and the sample shows the morphology of uniform nanobelts (Fig. 9d). These results suggest that an appropriate reaction temperature is crucial for the formation of the polyaniline-intercalated layered vanadium oxide nanocomposite.
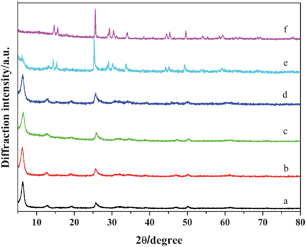 |
| | Fig. 8 XRD patterns of the as-prepared samples obtained at different reaction temperatures (pH = 3, t = 24 h). (a) 80 °C, (b) 100 °C, (c) 120 °C, (d) 140 °C, (e) 160 °C, (d) 180 °C. | |
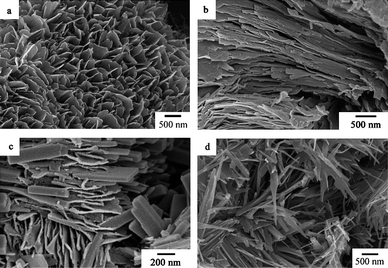 |
| | Fig. 9 SEM images of the as-prepared samples obtained at different reaction temperatures (pH = 3, t = 24 h). (a) 120 °C, (b) 140 °C, (c) 160 °C, (d) 180 °C. | |
Fig. 10 shows the XRD patterns of the as-prepared samples synthesized at 120 °C for different reaction times. The sample synthesized at 120 °C for 15 min can be indexed to the pure orthorhombic crystalline phase of V2O5 (Fig. 10a), and the layered phase of the polyaniline-intercalated vanadium oxide nanocomposite appeared in the sample obtained after 30 min (Fig. 10b). As shown in Fig. 10c and 10d, when the reaction time is further increased to 1 h and thereafter, all the Bragg peaks of the obtained samples are consistent with those of the polyaniline-intercalated vanadium oxide nanocomposite. It reveals that the polyaniline-intercalated vanadium oxide hybrid material can be synthesized within 1 h. Fig. 11 shows the corresponding SEM images of the as-prepared samples obtained at different reaction times. As shown in Fig. 11a, the sample obtained at a reaction temperature of 120 °C for 15 min has the morphology of nanoplates, similar with the precursor V2O5 but with a decreased thickness. As the reaction time is increased to 30 min, the obtained sample has a mixed morphology of nanoplates and nanosheets (Fig. 11b). With prolonging the reaction time, the sample obtained at 60 min presents a homogeneous morphology of nanosheets (Fig. 11c). The sample obtained after 15 h has the morphology of nanosheets and the nanosheets become more uniform and ordered (Fig. 11d).
 |
| | Fig. 10 XRD patterns of the as-prepared samples obtained at 120 °C for different reaction times (pH = 3). (a) 15 min, (b) 30 min, (c) 1 h, (d) 15 h. | |
 |
| | Fig. 11 SEM images of the as-prepared samples obtained at 120 °C for different reaction times (pH = 3). (a) 15 min, (b) 30 min, (c) 1 h, (d) 15 h. | |
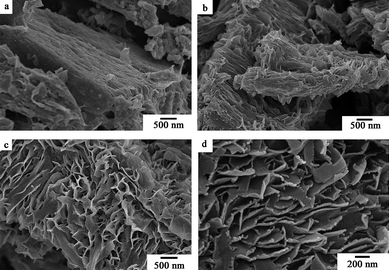
Fig. 12 and Fig. 13 show XRD patterns and corresponding SEM images of the resulting samples synthesized in the presence of different amounts of aniline at 120 °C for 24 h. As shown in Fig. 12, all the samples can be indexed to the layered phase of the polyaniline-intercalated vanadium oxide nanocomposite. In Fig. 13, it can be found that the resulting samples present the morphology of nanosheets and the thickness of the nanosheets is decreased from 30–40 nm to 10–20 nm with the increase of the amount of aniline, which is similar to that reported in ref. 22.
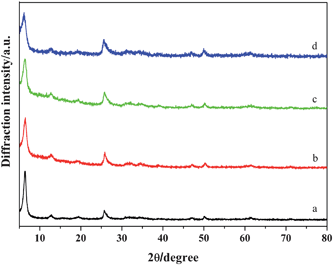 |
| | Fig. 12 XRD patterns of polyaniline-intercalated vanadium oxide hybrid nanocomposites obtained in the presence of different amounts of aniline (pH = 3, T = 120 °C, t = 24 h). (a) 30 μL, (b) 60 μL, (c) 120 μL, (d) 240 μL. | |
 |
| | Fig. 13 SEM images of polyaniline-intercalated vanadium oxide hybrid nanocomposites obtained in the presence of different amounts of aniline (pH = 3, T = 120 °C, t = 24 h). (a) 30 μL, (b) 60 μL, (c) 120 μL, (d) 240 μL. | |
Based on the above-mentioned results, a possible formation mechanism of polyaniline-intercalated layered vanadium oxide nanocomposite is put forward as follows: In the early stage of the reaction, the aniline monomer was first converted to the anilinium cation in an acidic environment. Since the vanadium oxide presents a high affinity for nitrogenated compounds (through N–H+⋯OV bonds) because of its Brønsted-acid character,36 the anilinium cations were intercalated into the interlayer space of V2O5 due to an acid–base interaction and subjected to oxidative polymerization between the layers. As the in situ intercalation and polymerization proceeded, the bulk layered V2O5 was exfoliated to a certain extent to form nanosheets of the polyaniline-intercalated layered vanadium oxide nanocomposite. The white fungus morphology of the resulting nanocomposite was self-assembled from the nanosheets. The intercalation and oxidative polymerization of aniline modified the band structure of vanadium oxide, leading to the formation of a layered nanocomposite with a mixed valence of V4+/V5+, where the negatively charged oxide host layers counter-balance the semi-oxidized guest polyaniline.16,19 When the amount of aniline and reaction temperature were increased, the intercalation of anilinium cations into the interlayer space of V2O5 was favored, thus the thickness of the obtained layered nanocomposite nanosheets was decreased. The detailed formation mechanism of the polyaniline-intercalated layered vanadium oxide nanocomposite nanosheets needs further investigation.
Electrochemical properties
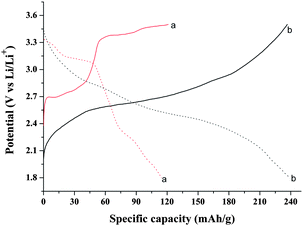
The initial charge and discharge profiles of the V2O5 precursor and polyaniline-intercalated layered vanadium oxide nanocomposite are showed in Fig. 14. The discharge profile of pure V2O5 shows a distinct plateau due to structural changes from α-LixV2O5 to ε-LixV2O5, δ-LixV2O5 and γ-LixV2O5.1 On the contrary, the potential decreases more smoothly down to ∼2.7 V for the nanocomposite, displaying a minor plateau around 2.5 V. A similar continuous decrease in potential has also been observed for the V2O5 xerogel, and for other conductive polymer/V2O5 nanocomposites,37 where the common structural feature is the enhanced separation of vanadium oxide layers due to the presence of interlayered molecules such as polyaniline or H2O. The cell fabricated with the sample obtained at 140 °C shows good electrochemical behavior, with a first discharge capacity of 239 mAh·g−1, which is nearly 87% of the theoretical capacity of V2O5 (276 mAh·g−1, n = 2).38 By comparison, the maximum discharge capacity of the cell fabricated with V2O5 precursor is only 114.5 mAh·g−1. The improved performance of the layered hybrid material is presumably due to the larger separation between vanadium oxide layers, leading to an enhanced “bidimensionality”. Furthermore, the intercalation of polyaniline may improve the electronic conductance of the obtained nanocomposite, being beneficial for the increase of capacity. The electronic conductance of sample 1 was measured as 3.2 × 10⁻³ S·cm−1, which is nearly 50 times higher than that of pristine V2O5 (6.78 × 10⁻⁵ S·cm−1).37 It is worth mentioning that the polyaniline-intercalated layered vanadium oxide nanocomposite reveals a larger capacity during the first charge than the first discharge. It can be attributed to the presence of V4+, which could be easily oxidized by an electrochemical method, as already reported in the case of conductive polymer/V2O5 hybrids.39,40
 |
| | Fig. 14 First charge (solid line) and discharge (dotted line) profiles of the cells fabricated with (a) pure V2O5, (b) sample obtained at 140 °C (pH = 3, t = 24 h). | |
Charge-discharge (chronopotentiometric) experiments were performed according to ref. 18 to test the specific capacities of the obtained samples. Fig. S2† shows such data for V2O5 (dotted line) and polyaniline-intercalated vanadium oxide layered nanocomposites obtained at 140 °C (solid line). The specific capacities of these samples calculated from the experimental data are 134.1 mAh·g−1 and 167.6 mAh·g−1, respectively. These values are not as large as those reported in ref. 18. Nevertheless, the nanocomposite prepared at 140 °C shows a superior specific capacity and charge-discharge behavior in comparison with the parent material, which is in agreement with the tested result of the fabricated cell.
Good cycling performance is a desirable feature in battery applications. Recently, much work was concentrated on improving the cycling performance of V2O5 through doping.41,42Fig. 15 shows the cycling performances of cells fabricated with pure V2O5 and the resulting samples obtained at different reaction temperatures, respectively. Compared with pure V2O5, the samples obtained at 140 °C and 160 °C exhibit much better cycling ability and higher reversible capacity. After 30 cycles, the capacity of the cell fabricated with the sample obtained at 140 °C decreases to 209 mAh·g−1 at a rate of 29.5 mA·g−1, which is 87% of its initial capacity. This comparative analysis clearly suggests that the obtained layered nanocomposite may act as a promising cathode material in high-energy-density rechargeable lithium microbatteries.
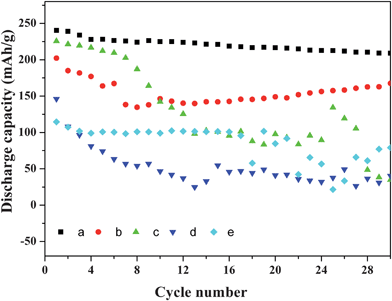 |
| | Fig. 15 Cycling performances of the cells fabricated with samples obtained at different reaction temperatures (a) 140 °C, (b) 160 °C, (c) 120 °C, (d) 180 °C and (e) pure V2O5. | |
Conclusion
In summary, polyaniline-intercalated layered vanadium oxide nanocomposites have been synthesized by in situ intercalation and polymerization of aniline with bulk V2O5 under hydrothermal conditions. The resulting polyaniline-intercalated vanadium oxide layered nanocomposites have hybrid hierarchical architectures with a morphology of white fungus which are self-assembled from the nanosheets with a thickness between 10–20 nm and a typical lateral dimension in the range of hundreds of nanometres to several micrometres. The influence of several reaction parameters on the structure and morphology of the resulting samples was discussed. It was found that acidic environment and proper reaction temperature are vital for the synthesis of the polyaniline-intercalated layered vanadium oxide nanocomposite. An in situ intercalation-polymerization-exfoliation mechanism was put forward for the formation of layered nanocomposites based on the experiment results. The method reported here is fast and simple, and is also applicable for the synthesis of other polymer-intercalated layered nanocomposites such as polypyrrole-intercalated and poly(3,4-ethylenedioxythiophene)-intercalated layered vanadium oxide nanocomposites. The lithium intercalation performances of the obtained nanocomposite were measured. The results suggest that the polyaniline-intercalated layered vanadium oxide nanocomposite obtained at 140 °C can act as a promising cathode material for high-energy-density rechargeable lithium microbatteries.
Acknowledgements
The authors greatly appreciate the financial support of the National Natural Science Foundation of China (Grant No. 20773065, 20635020), National Basic Research Program (973 project) (Grant No. 2007CB936302) and Modern Analysis Center of Nanjing University.
References
- Y. Wang and G. Z. Cao, Chem. Mater., 2006, 18, 2787 CrossRef CAS.
- G. T. Kim, J. Muster, V. Krstic, J. G. Park, Y. W. Park, S. Roth and M. Burghard, Appl. Phys. Lett., 2000, 76, 1875 CrossRef CAS.
- J. Muster, G. T. Kim, V. Krstic, J. G. Park, Y. W. Park, S. Roth and M. Burghard, Adv. Mater., 2000, 12, 420 CrossRef CAS.
- P. R. Somani, R. Marimuthu and A. B. Mandale, Polymer, 2001, 42, 2991 CrossRef CAS.
- G. Gu, M. Schmid, P. W. Chiu, A. Minett, J. Fraysse, G. T. Kim, S. Roth, M. Kozlov, E. Munoz and R. H. Baughman, Nat. Mater., 2003, 2, 316 CrossRef CAS.
- L. Biette, F. Carn, M. Maugey, M. F. Achard, T. Maquet, N. Steunou, T. Livage, H. Serier and R. Backov, Adv. Mater., 2005, 17, 2970 CrossRef CAS.
- T. Chirayil, P. Y. Zavalij and M. S. Whittingham, Chem. Mater., 1998, 10, 2629 CrossRef CAS.
- A. Sellinger, P. M. Weiss, A. Nguyen, Y. F. Lu, R. A. Assink, W. L. Gong and C. J. Brinker, Nature, 1998, 394, 256 CrossRef CAS.
- K. Yamamoto, Y. Sakata, Y. Nohara, Y. Takahashi and T. Tatsumi, Science, 2003, 300, 470 CrossRef CAS.
- P. Gomez-Romero, Adv. Mater., 2001, 13, 163 CrossRef CAS.
- G. Yang, W. H. Hou, Z. Z. Sun and Q. J. Yan, J. Mater. Chem., 2005, 15, 1369 RSC.
- G. Yang, W. H. Hou, X. M. Feng, X. F. Jiang and J. Guo, Adv. Funct. Mater., 2007, 17, 3521 CrossRef CAS.
- G. Yang, W. H. Hou, X. M. Feng, L. Xu, Y. G. Liu, G. Wang and W. P. Ding, Adv. Funct. Mater., 2007, 17, 401 CrossRef CAS.
- W. S. Huang, B. D. Humphrey and A. G. Macdiarmid, J. Chem. Soc., Faraday Trans. 1, 1986, 82, 2385 RSC.
- M. G. Kanatzidis, C. G. Wu, H. O. Marcy and C. R. Kannewurf, J. Am. Chem. Soc., 1989, 111, 4139 CrossRef CAS.
- C. G. Wu, D. C. DeGroot, H. O. Marcy, J. L. Schindler, C. R. Kannewurf, Y. J. Liu, W. Hirpo and M. G. Kanatzidis, Chem. Mater., 1996, 8, 1992 CrossRef CAS.
- F. Huguenin and R. M. Torresi, J. Phys. Chem. C, 2008, 112, 2202 CrossRef CAS.
- F. Huguenin, M. T. D. Gambardella, R. M. Torresi, S. I. de Torresi and D. A. Buttry, J. Electrochem. Soc., 2000, 147, 2437 CrossRef CAS.
- F. Huguenin, R. M. Torresi and D. A. Buttry, J. Electrochem. Soc., 2002, 149, A546 CrossRef CAS.
- J. Dexmer, C. M. Leroy, L. Binet, V. Heresanu, P. Launois, N. Steunou, C. Coulon, J. Maquet, N. Brun, J. Livage and R. Backov, Chem. Mater., 2008, 20, 5541 CrossRef CAS.
- F. Huguenin, M. Ferreira, V. Zucolotto, F. C. Nart, R. M. Torresi and O. N. Oliveira, Chem. Mater., 2004, 16, 2293 CrossRef CAS.
- S. P. Pang, G. C. Li and Z. K. Zhang, Macromol. Rapid Commun., 2005, 26, 1262 CrossRef CAS.
- M. Ferreira, F. Huguenin, V. Zucolotto, J. E. P. da Silva, S. I. C. de Torresi, M. L. A. Temperini, R. M. Torresi and O. N. Oliveira, J. Phys. Chem. B, 2003, 107, 8351 CrossRef CAS.
- C. Q. Zhang, L. Wang, H. R. Peng, K. Z. Chen and G. C. Li, Polym. Int., 2009, 58, 1422 CrossRef CAS.
- M. Malta, L. H. Silva, A. Galembeck and M. Korn, Macromol. Rapid Commun., 2008, 29, 1221 CrossRef CAS.
- F. Sediri and N. Gharbi, J. Phys. Chem. Solids, 2007, 68, 1821 CrossRef CAS.
- M. Malta and R. M. Torresi, Electrochim. Acta, 2005, 50, 5009 CrossRef CAS.
- N. Pinna, M. Willinger, K. Weiss, J. Urban and R. Schlogl, Nano Lett., 2003, 3, 1131 CrossRef CAS.
- G. C. Li, L. Jiang and H. R. Peng, Macromolecules, 2007, 40, 7890 CrossRef CAS.
- C. V. S. Reddy, S. I. Mho, R. R. Kalluru and Q. L. Williams, J. Power Sources, 2008, 179, 854 CrossRef CAS.
- Y. J. Wei, C. W. Ryu and K. B. Kim, J. Power Sources, 2007, 165, 386 CrossRef CAS.
- R. Baddour-Hadjean, J. P. Pereira-Ramos, C. Navone and M. Smirnov, Chem. Mater., 2008, 20, 1916 CrossRef CAS.
- R. Enjalbert and J. Galy, Acta Crystallogr., Sect. C: Cryst. Struct. Commun., 1986, 42, 1467 CrossRef.
- B. Vigolo, C. Zakri, F. Nallet, J. Livage and C. Coulon, Langmuir, 2002, 18, 9121 CrossRef CAS.
- J. Livage, Solid State Ionics, 1996, 86–88, 935 CrossRef CAS.
- I. Boyano, M. Bengoechea, I. de Meatza, O. Miguel, I. Cantero, E. Ochoteco, J. Rodriguez, M. Lira-Cantu and P. Gomez-Romero, J. Power Sources, 2007, 166, 471 CrossRef CAS.
- A. V. Murugan, C. W. Kwon, G. Campet, B. B. Kale, A. B. Mandale, S. R. Sainker, C. S. Gopinath and K. Vijayamohanan, J. Phys. Chem. B, 2004, 108, 10736 CrossRef CAS.
- D. Sun, C. W. Kwon, G. Baure, E. Richman, J. MacLean, B. Dunn and S. H. Tolbert, Adv. Funct. Mater., 2004, 14, 1197 CrossRef CAS.
- G. R. Goward, F. Leroux and L. F. Nazar, Electrochim. Acta, 1998, 43, 1307 CrossRef CAS.
- J. Bullot, P. Cordier, O. Gallais, M. Gauthier and F. Babonneau, J. Non-Cryst. Solids, 1984, 68, 135 CrossRef CAS.
- F. Coustier, J. Hill, B. B. Owens, S. Passerini and W. H. Smyrl, J. Electrochem. Soc., 1999, 146, 1355 CrossRef CAS.
- A. Dobley, K. Ngala, S. F. Yang, P. Y. Zavalij and M. S. Whittingham, Chem. Mater., 2001, 13, 4382 CrossRef CAS.
|
| This journal is © The Royal Society of Chemistry 2010 |
Click here to see how this site uses Cookies. View our privacy policy here.