Near-infrared luminescent copolymerized hybrid materials built from tin nanoclusters and PMMA†
Weiqiang
Fan
ab,
Jing
Feng
ab,
Shuyan
Song
ab,
Yongqian
Lei
ab,
Liang
Zhou
ab,
Guoli
Zheng
ab,
Song
Dang
ab,
Song
Wang
ab and
Hongjie
Zhang
*a
aState Key Laboratory of Rare Earth Resource Utilization, Changchun Institute of Applied Chemistry, Changchun, 130022, People's Republic of China. E-mail: hongjie@ciac.jl.cn; Fax: +86-431-85698041; Tel: +86-431-85262127
bGraduate School of the Chinese Academy of Sciences, Beijing, 100049, People's Republic of China
First published on 5th August 2010
Abstract
Novel near-infrared (NIR) luminescent copolymerized hybrid materials were prepared by covalently grafting and physically doping Ln complexes (Ln = Er, Sm, Yb, and Nd) into a copolymer matrix built from nanobuilding blocks. The structures of the obtained hybrid materials were investigated by Fourier transform infrared (FTIR) spectra, nuclear magnetic resonance (NMR), gel permeation chromatography (GPC), and thermogravimetric analysis (TGA). In the photoluminescence studies, the hybrid materials showed characteristic NIR luminescence of corresponding Ln3+ ions through intramolecular energy transfer from ligands to Ln3+ ions. Transparent films of these materials can be easily prepared through spin-coating on indium tin oxide (ITO) glasses taking advantage of the matrix nature.
Introduction
While increasing studies have been performed on the utilization of the NIR emission of rare earths in bioimaging,1 optical electroluminescent,2 and laser materials,3 it remains an interesting pursuit for people to synthesize new kinds of rare earth optical materials with wide applications. Among all the rare earth ions, Er(III), Sm(III), Yb(III), and Nd(III) are commonly popular ions used in preparing materials with NIR luminescence, which is attributed to both their wide wavelength range (varying from 900 nm to 1600 nm) and their relative strong emitting.4 However, since the Laporte-forbidden 4f → 4f transitions can prevent direct excitation of the photoluminescence and make the absorption coefficients of the lanthanide ions very low,5 separate lanthanide ions are rarely chosen in the synthesis of optical hybrid materials due to their unsatisfactory luminescent efficiency. Interestingly, lanthanide complexes with organic ligands have more efficient absorption coefficients and energy transfer between ligands and lanthanide ions, which have found wide applications in optical hybrid materials.6 Considering their relative low stability and plasticity, lanthanide complexes were usually applied through introducing them into matrixes. Some kinds of stable organic and inorganic materials have been recommended as matrixes for doping (or grafting) lanthanide complexes inside, and corresponding hybrid materials with excellent optical properties have been reported.7 But, as we all know, lanthanide complexes are usually hydrophobic, thus making them difficult to dope in some inorganic matrixes especially through physically doping. So, it is still a topic of long-term interest for people to explore new matrix materials suitable for doping lanthanide complexes without destroying their structure and reducing their optical properties.Organic-inorganic hybrid materials built from nanobuilding blocks have attracted intensive attention in the field of class II hybrid materials due to their multiple properties from both organic and inorganic components.8 Since the oxo-hydroxo butyltin cluster {(BuSn)12O14(OH)6}(OH)2 has been reported in several papers, it has become challenges to design inorganic/organic hybrid materials from butyltin cluster nanobuilding blocks.9 L. Angiolini and F. Ribot, et al. have reported some kinds of inorganic/organic hybrid materials prepared from functionalized {(BuSn)12O14(OH)6}2+ clusters,10 and also doped the hybrid materials with photochromic dyes as functional hybrid materials.11 In our recent report,12 we successfully designed europium complex-doped polymer materials built from oxo-hydroxo organotin nanobuilding blocks (Sn12clusters) and MMA. The europium complexes were used as optical probes, and visible optical property of the hybrid materials were investigated. We found that this kind of the matrix could be easily grafted with europium complexes, and also has a high capacity for physical doping for europium complexes, which could be attributed to their special structure where the PMMA chains are bridged with nanobuilding blocks endowing the material with micro-space structure. This flexible polymer structure also makes these kinds of luminescent hybrid materials have shape controllability. So, it is considered as a novel matrix for lanthanide (Ln) complexes. Otherwise, the Ln complexes have been studied in the optical field for a long time, and their optical properties are mainly classified into two parts (visible and near-infrared emitting), due to their remarkably different wavelength and applications in optics. Therefore, we further prepared NIR luminescent hybrid materials built from tin nanoclusters in order to extend the application of this matrix in NIR optical area.
In this paper, we introduced NIR lanthanide complexes into the copolymer based on Sn12clusters. Two kinds of the NIR lanthanide complexes were prepared: Ln(TTA)3phen (Ln = Er, Sm, Yb, and Nd) were used for physically doping inside the copolymer, while LnAA(TTA)2phen for grafting with PMMA (TTA = 2-thenoyltrifluoroacetone, phen = phenanthroline and AA = acrylic acid). The obtained hybrid materials exhibited characteristic NIR luminescence of corresponding Ln3+ ions. Furthermore, the structure and properties of these hybrid materials were characterized by GPC, TGA, SEM, 1H NMR, 119Sn NMR, FTIR, diffuse reflectance (DR) spectra, and photoluminescence (PL) spectra respectively. Transparent films are also prepared from PMMA-co-Sn12Cluster/Ln(TTA)3phen and PMMA-co-Sn12Cluster-co-LnAA(TTA)2phen by spin-coating.
Results and discussion
2.1 Structural characterizations of PMMA-co-Sn12Cluster/Ln(TTA)3phen and PMMA-co-Sn12Cluster-co-LnAA(TTA)2phen
The proposed mechanisms for the formation of PMMA-co-Sn12Cluster-co-LnAA(TTA)2phen (step a) and PMMA-co-Sn12Cluster/Ln(TTA)3phen (step b) hybrid materials are described in Scheme 1.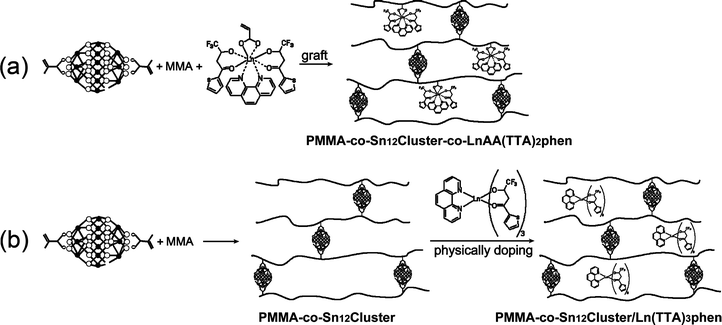 | ||
| Scheme 1 The proposed mechanisms for the formation of PMMA-co-Sn12Cluster/Ln(TTA)3phen and PMMA-co-Sn12Cluster-co-LnAA(TTA)2phen hybrid materials (Ln = Er, Yb, Nd, and Sm). | ||
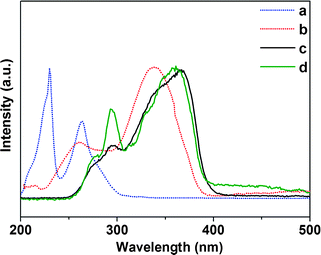
In steps a and b, {(BuSn)12O14(OH)6}2(MA)2 was introduced as nanobuilding blocks into the polymers through covalent polymerization with MMA, and the MMA forms the PMMA chains bridged with Sn12 clusters due to the two methacrylate groups on the opposite sides of the Sn12 clusters. Thus, the soft PMMA chains were supported by rigid inorganic clusters and the structure with micro-spaces formed. The copolymerization was verified by IR spectra (Fig. 1), the four sharp bands (672 cm−1, 623 cm−1, 536 cm−1, and 430 cm−1) due to the vibrations related to the Sn–O–Sn framework were maintained in {(BuSn)12O14(OH)6}2(MA)2 and products (PMMA-co-Sn12Cluster, PMMA-co-Sn12Cluster/Er(TTA)3phen, and PMMA-co-Sn12Cluster-co-ErAA(TTA)2phen),13 which could approximately indicate that the Sn12 cluster framework were preserved during the reaction process. Moreover, two bands at 3650 cm−1 and 1647 cm−1 in {(BuSn)12O14(OH)6}(MA)2 are attributed to the typical ν(O–H) of Sn–OH around and νas(C![[double bond, length as m-dash]](https://www.rsc.org/images/entities/char_e001.gif) C) of the MA, and the copolymerization between MA and MMA could be easily explained from the disappearance of νas(CC) in the copolymers. The 1581 and 1417 cm−1 (COO–) were found in the ErAA(TTA)2phen complexes, which suggested that the AA ligand was bonded with the Er3+ ions. the ErAA(TTA)2phen complexes with active CHCH2 group could subsequently be copolymerized with MMA and {(BuSn)12O14(OH)6}(MA)2 to form PMMA-co-Sn12Cluster-co-ErAA(TTA)2phen hybrid materials. The IR data of the other samples (such as Sm, Yb, and Nd) were similar to the Er sample.
C) of the MA, and the copolymerization between MA and MMA could be easily explained from the disappearance of νas(CC) in the copolymers. The 1581 and 1417 cm−1 (COO–) were found in the ErAA(TTA)2phen complexes, which suggested that the AA ligand was bonded with the Er3+ ions. the ErAA(TTA)2phen complexes with active CHCH2 group could subsequently be copolymerized with MMA and {(BuSn)12O14(OH)6}(MA)2 to form PMMA-co-Sn12Cluster-co-ErAA(TTA)2phen hybrid materials. The IR data of the other samples (such as Sm, Yb, and Nd) were similar to the Er sample.
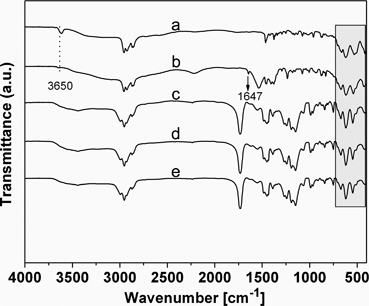 | ||
| Fig. 1 IR spectra for {(BuSn)12O14(OH)6}2(OH)2 (a), {(BuSn)12O14(OH)6} (MA)2 (b), PMMA-co-Sn12Cluster (c), PMMA-co-Sn12Cluster/Er(TTA)3phen (d), PMMA-co-Sn12Cluster-co-ErAA(TTA)2phen (e). | ||
As previously reported, the Sn12 cluster is composed of six tin atoms in the five-coordinate sites and six atoms in the six-coordinate sites respectively, and the Sn12 cluster fine structure in the products could be studied by 119Sn NMR (CD2Cl2) through testing the tin atoms in the two sites.14 As see in Fig. 2, the 119Sn NMR spectra of the hybrid materials (PMMA-co-Sn12Cluster, PMMA-co-Sn12Cluster/Er(TTA)3phen, and PMMA-co-Sn12Cluster-co-ErAA(TTA)2phen) all show the two characteristic resonances at −282 and −454 ppm, which correspond to the five- and six-coordinate tin atoms in the Sn12 cluster respectively.11 The ratio of the two resonances is almost 1![[thin space (1/6-em)]](https://www.rsc.org/images/entities/char_2009.gif) :1. Therefore, we consider that the structure of the Sn12 cluster in the hybrid materials was preserved, and Er complexes doped or grafted into the polymer system hardly affected the existence of Sn12 cluster.
:1. Therefore, we consider that the structure of the Sn12 cluster in the hybrid materials was preserved, and Er complexes doped or grafted into the polymer system hardly affected the existence of Sn12 cluster.
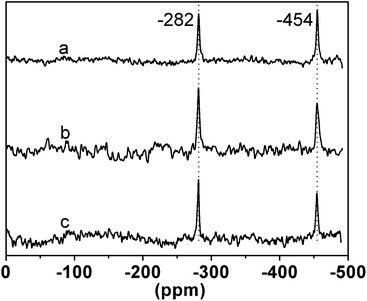 | ||
| Fig. 2 119Sn NMR spectra for PMMA-co-Sn12Cluster (a), PMMA-co- Sn12Cluster/Er(TTA)3phen (b), and PMMA-co-Sn12Cluster-co-ErAA(TTA)2phen (c). | ||
During the copolymerization process, though the feeding ratios of the Sn12 cluster and the MMA are all 1:30, the ratios would be changed in the obtained products due to incomplete polymerization. The molar ratios of the Sn12 cluster and the MMA in the products could be calculated according to the TGA data. The molar ratios altered between 40:1 and 64:1, which are lower than the feeding ratio. In Table 1, the number-average molecular weight (Mn), and polydispersity indexes (Mw/Mn) of final products are in the range of 8000–11000 and 1.2–1.3, respectively, the low molecular weight would enhance the solubility of the hybrid materials and facilitate the formation of films. The Er/Sn molar ratio determined by ICP in the PMMA-co-Sn12Cluster-co-ErAA(TTA)2phen is just about 2% (the feeding ratios is 5%).
| SnO2 content (wt%) | MMA/Sn12Clustera | M n/g mol−1 | M w/Mn | |
|---|---|---|---|---|
| a Experimental calculated MMA/Sn12Cluster molar ratio in hybrid materials. | ||||
| PMMA-co-Sn12Cluster | 26.6 | 42/1 | 10347 | 1.3 |
| PMMA-co-Sn12Cluster-co-ErAA(TTA)2phen (5%) | 23.5 | 51/1 | 8186 | 1.2 |
| PMMA-co-Sn12Cluster-co-SmAA(TTA)2phen (5%) | 21.6 | 57/1 | 8278 | 1.2 |
| PMMA-co-Sn12Cluster-co-YbAA(TTA)2phen (5%) | 21.0 | 60/1 | 8071 | 1.2 |
| PMMA-co-Sn12Cluster-co-NbAA(TTA)2phen (5%) | 20.1 | 64/1 | 8372 | 1.2 |
2.2. Optical property studies
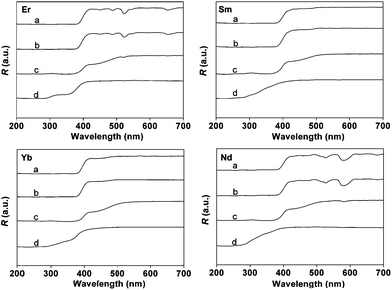 | ||
| Fig. 3 DR spectra for Ln(TTA)3phen (a), LnAA(TTA)2phen (b), PMMA-co-Sn12Cluster/Ln(TTA)3phen (c), PMMA-co-Sn12Cluster-co-LnAA(TTA)2phen (d) (Ln = Er, Sm, Yb, and Nd). | ||
The excitation and emission spectra of Er complexes and hybrid materials (PMMA-co-Sn12Cluster/Er(TTA)3phen, and PMMA-co-Sn12Cluster-co-ErAA(TTA)2phen). As is shown in Fig. 5, the excitation spectra of the Er samples were obtained by monitoring the characteristic emission of the Er3+ ions at 1535 nm. In the excitation spectra, there are broad bands ranging from 250 to 450 nm for Er complexes and broad bands from 250 to 400 nm for Er hybrid materials, which are also in agreement with the DR spectra mentioned above. We then compared the excitation spectra with the absorption spectra of corresponding ligands in order to further study the broad bands in the excitation spectra. In Fig. 4, the absorption bands of the TTA and phen are overlapped with the excitation spectra, especially the bands of the TTA are almost consistent with the excitation spectra, which indicate that the excitation spectra mainly came from the organic ligands and there are energy transfers between ligands and Er3+ ions. Otherwise, the excitation bands of Er hybrid materials are relatively narrower, which may be attributed to the change of the environment surrounding the Er complexes in polymer matrix materials.19 In the excitation spectra, we also could see the f–f absorption transitions originating from the Er3+ ions above 400 nm. The bands at 450 nm and 486 nm can be attributed to the energy transitions 4I15/2 → 4F5/2 and 4I15/2 → 4F7/2. Based on the excitation spectra, excitation bands are mainly contributed by the ligands, which indicated that the ligands still coordinated to the Er3+ ions and then the ligands transferred the energy absorbed from the ultraviolet (UV) light to the Er3+ ions. Moreover, it also gives a further proof that the Er complexes still keep their structure in the polymer matrix materials whether physically doping or grafting.
 | ||
| Fig. 4 UV-vis absorption spectra of phen (a) and TTA (b) in ethanol, excitation spectra for PMMA-co-Sn12Cluster/Er(TTA)3phen (c) and PMMA-co-Sn12Cluster-co-ErAA(TTA)2phen (d). | ||
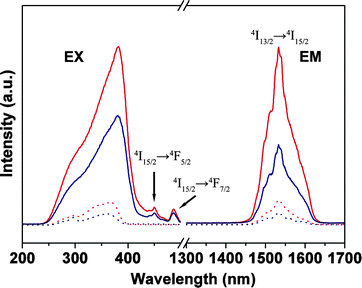 | ||
| Fig. 5 Excitation (EX, λem = 1535 nm) and emission spectra for Er(TTA)3phen (red solid line, λex = 381 nm), ErAA(TTA)2phen (blue solid line, λex = 381 nm), PMMA-co-Sn12Cluster/Er(TTA)3phen (red dot line, λex = 365 nm), PMMA-co-Sn12Cluster-co-ErAA(TTA)2phen (blue dot line, λex = 361 nm). | ||
The emission spectra are shown in Fig. 5; all the Er samples were excited at a wavelength that maximises the excitation broad band according to excitation spectra respectively, the emission maxima all located at 1535 nm which is attributed to the transition from the first excited state (4I13/2) to the ground state (4I15/2) of Er3+ ions. The emission bands cover large spectral ranges extending from 1445 to 1640 nm, and all the samples have almost the same spectral width, it may suggest that the light emitting sites in hybrid materials are same as the Er complexes. Therefore, the luminescence of hybrid materials came from the corresponding Er complexes, and the polymer matrix just functionalized as the skeleton without damage to the Er complexes. In addition, PL intensity of the ErAA(TTA)2phen is lower than the Er(TTA)3phen which can be attributed to the molecular vibration of the AA, however, the low intensity of the PMMA-co-Sn12Cluster-co-ErAA(TTA)2phen compared with the PMMA-co-Sn12Cluster/Er(TTA)3phen are mainly because of the lower ratios of the ErAA(TTA)2phen and Sn12 cluster than the feeding ratio during the grafting process according to the ICP data.
The transition 4I13/2 → 4I15/2 of Er3+ ion is in the right position for the third telecommunication window. Therefore, these Er hybrid materials with 1.5 μm emission of Er3+ ions have attracted considerable attention.20 The full width at half maximum (fwhm) of the erbium is an important parameter for potential application in the telecommunication area, due to the urgent demand for optical amplifiers with a wide and flat gain spectrum in the telecommunication window because of the rapid increase of information capacity recently. However, the erbium-doped inorganic materials commonly show relatively small fwhm, so erbium organic compounds, endowed with the nature of broad-band emission at 1.5 μm have been intensively studied.17,21 The Er samples we prepared here have a relative broad band, the fwhm of the 4I13/2 → 4I15/2 transition for PMMA-co-Sn12Cluster-co-ErAA(TTA)2phen and PMMA-co-Sn12Cluster/Er(TTA)3phen are 65 and 60 nm respectively. Such relative broad spectra may enable a wide gain bandwidth for optical amplification.
Similarly, the PL spectra of the other three Ln (Sm, Yb, and Nb) hybrid materials were obtained, and the emission spectra showed strong and characteristic luminescence of the three kinds of Ln3+ ions.
In Fig. 6, the strong bands at 955 nm are observed in the emission spectrum of the Sm samples and are assigned to the transitions 4G5/2 → 6F5/2 of the Sm3+ ions, and two other weak bands (1034 nm and 1185 nm) could also be observed in the longer wavelength, which came from the transitions of 4G5/2 → 6F7/2 and 4G5/2 → 6F9/2.
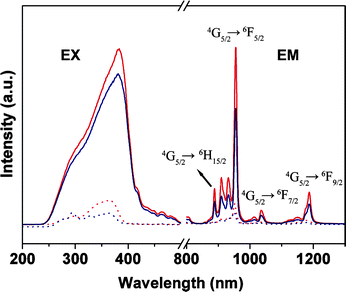 | ||
| Fig. 6 Excitation (EX, λem = 955 nm) and emission spectra for Sm(TTA)3phen (red solid line, λex = 381 nm), SmAA(TTA)2phen (blue solid line, λex = 381 nm), PMMA-co-Sn12Cluster/Sm(TTA)3phen (red dot line, λex = 365 nm), PMMA-co-Sn12Cluster-co-SmAA(TTA)2phen (blue dot line, λex = 361 nm). | ||
For the emission spectra of Yb complexes, the 2F5/2 → 2F7/2 transitions of the Yb3+ ions were split into three bands (978, 1009, and 1038 nm) in Fig. 7, which may be because of the ligand field effects.22 However, when the Yb complexes are physically doped or grafted in the polymer matrix, the last two bands almost merged into a broad band, which is probably due to the polarity of polymer matrix.11 In the field of the laser materials, materials with Yb attract much attention due to the 2F5/2 → 2F7/2 transition of the Yb3+ ions, for its very simple energy levels and relatively broad absorption which will be well-suitable for laser diode and pumping in this range, and the smaller Stokes shift between absorption and emission reduces the thermal loading of the material during laser operation.23
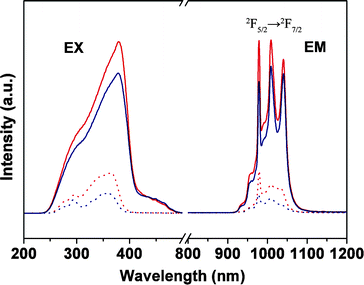 | ||
| Fig. 7 Excitation (EX, λem = 980 nm) and emission spectra for Yb(TTA)3phen (red solid line, λex = 381 nm), YbAA(TTA)2phen (blue solid line, λex = 380 nm), PMMA-co-Sn12Cluster/Yb(TTA)3phen (red dot line, λex = 364 nm), PMMA-co-Sn12Cluster-co-YbAA(TTA)2phen (blue dot line, λex = 358 nm). | ||
Besides the application within laser systems, the Nd-containing materials also have potential application in the optical amplification due to the characteristic emitting wavelength of the Nd3+ ions. Because two telecommunication windows for amplification are commonly used for long distance communication, except for 1.5 μm, the second one at 1.3 μm is suitable for Nd emission.24 In Fig. 8, excited at UV light, the four Nd samples exhibited three bands: 885 nm (4F3/2 → 4I9/2), 1065 nm (4F3/2 → 4I11/2), and 1336 nm (4F3/2 → 4I13/2), respectively. The bands at 1065 nm and 1336 nm of the Nd hybrid materials will offer the opportunity to develop new materials for application in laser and amplifiers.
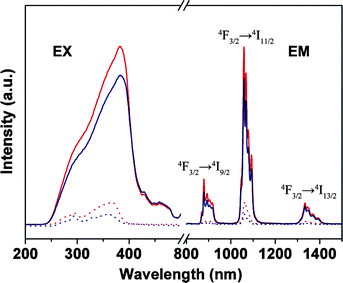 | ||
| Fig. 8 Excitation (EX, λem = 1061 nm) and emission spectra for Nd(TTA)3phen (red solid line, λex = 382 nm), NdAA(TTA)2phen (blue solid line, λex = 382 nm), PMMA-co-Sn12Cluster/Nd(TTA)3phen (red dot line, λex = 365 nm), PMMA-co-Sn12Cluster-co-NdAA(TTA)2phen (blue dot line, λex = 360 nm). | ||
| Sample | Lifetime/μs | Sample | Lifetime/μs |
|---|---|---|---|
| a Ln doped materials (PMMA-co-Sn12Cluster/Ln(TTA)3phen). Ln grafted materials (PMMA-co- Sn12Cluster-co-LnAA(TTA)2phen). b The lifetime fitted by a single-exponential function: I = Aexp(−t/τ). c The lifetime fitted double-exponential functions: I = A1exp(−t/τ1) + A2exp(−t/τ2) and the lifetime was calculated as average lifetime. | |||
| Er(TTA)3phen | 1.82b | ErAA(TTA)2phen | 1.81b |
| Er doped material | 1.80b | Er grafted material | 1.81b |
| Sm(TTA)3phen | 76.03b | SmAA(TTA)2phen | 77.73b |
| Sm doped material | 54.25b | Sm grafted material | 74.22c |
| Yb(TTA)3phen | 11.29b | YbAA(TTA)2phen | 12.37b |
| Yb doped material | 9.80c | Yb grafted material | 10.89c |
| Nd(TTA)3phen | 1.17b | NdAA(TTA)2phen | 1.14b |
| Nd doped material | 1.11b | Nd grafted material | 0.65b |
2.3. Films made from PMMA-co-Sn12Cluster/Ln(TTA)3phen and PMMA-co-Sn12Cluster-co-LnAA(TTA)2phen
We chose Er hybrid materials as an example to spin-coat on indium tin oxide (ITO) glass, and dried them in air. The obtained films on the ITO glass are transparent as we can see in Fig. 9a and 9b. The morphology of films were further studied by SEM images, as shown in Fig. 9c and 9d; the films are homogeneous and flat coated on the ITO glasses. We consider that the feasible formation of film from these hybrid materials is mainly due to the soft PMMA chains in the matrix. Therefore, this kind of hybrid material is very suitable for film forming, which will make it conducive to designing NIR optical devices.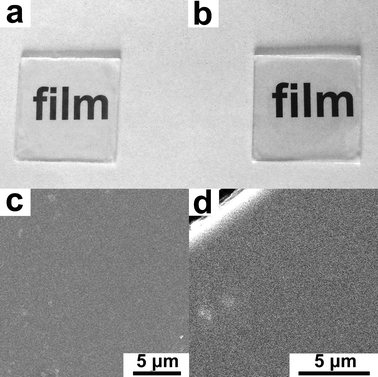 | ||
| Fig. 9 Photographs for the PMMA-co-Sn12Cluster/Er(TTA)3phen film (a), PMMA-co-Sn12Cluster-co-ErAA(TTA)2phen film (b). SEM images for PMMA-co-Sn12Cluster/Er(TTA)3phen film (c), PMMA-co-Sn12Cluster-co-ErAA(TTA)2phen film (d). | ||
Conclusions
Two kinds of lanthanide complexes were introduced into the PMMA-co-Sn12Cluster matrix. The LnAA(TTA)2phen (Ln = Er, Sm, Nd, and Yb) complexes with vinyl group were grafted on the PMMA chains of the PMMA-co-Sn12Cluster matrix, while the Ln(TTA)3phen without vinyl group were just physically doped in the matrix. The obtained hybrid materials all showed similar NIR photoluminescence properties compared with the pure NIR lanthanide complexes, which indicated that the NIR lanthanide complexes keep their structures inside the matrix. Due to their good solubility in organic solvents and capacity to forming films, we also prepared transparent films of hybrid materials on ITO glasses through spin-coating. Incorporating NIR lanthanide complexes into the matrix built from butyltin cluster nanobuilding blocks, which combine the NIR luminescence properties and soft structure bridged inorganic clusters into a single material, would extend the applications of the rare earth in NIR optical fields.Experimental
Solid reagents were of analytical grade and used as received without further purification. Liquid reagents were used after desiccation.4.1. Synthesis of polymer PMMA-co-Sn12Cluster
{(BuSn)12O14(OH)6}2(OH)2 [Sn12Cluster(OH)2], {(BuSn)12O14(OH)6}(MA)2, and copolymer were prepared according to ref. 9 and 10 10 wt% solution of {(BuSn)12O14(OH)6}(MA)2 in THF was mixed with methyl methacrylate (MMA) (MMA : cluster = 30:1). The reaction mixture was heated at 70 °C for 60 h using 2,2′-azobis (isobutyronitrile) (AIBN) (5% molar ratio of the methacrylic group) as radical initiator at N2 atmosphere. Finally, the polymer was obtained by precipitation of the product in diethyl ether. {(BuSn)12O14(OH)6}(MA)2, 1H NMR (400 MHz, CDCl3): δ = 5.87, 5.21 (ss, 4 H, (CH3)CCH2), 1.90 (s, 6H, (CH3)CCH2), 1.16 (m, 24H, CH2CH2CH2CH3), 1.72, 1.57 (m, 24H, CH2CH2CH2CH3), 1.32 (m, 24 H, CH2CH2CH2CH3), 0.94, 0.87 (tt, J = 7.2 Hz, 36 H, CH2CH2CH2CH3).
4.2. PMMA-co-Sn12Cluster physically doped with the Er(TTA)3phen complex [PMMA-co-Sn12Cluster/Er(TTA)3phen]
The Er(TTA)3phen complex was synthesized according to a typical procedure.26 Er(TTA)3phen complex was dissolved in the tetrahydrofuran (THF), then added dropwise into a THF solution of PMMA-co-Sn12Cluster, with the Er/Sn12Cluster molar ratio of 5%. The solution was stirred until totally dissolved, and then dried in air.4.3. Synthesis of PMMA-co-Sn12Cluster polymer grafted with ErAA(TTA)2phen [PMMA-co-Sn12Cluster-co-ErAA(TTA)2phen]
ErAA(TTA)2phen was prepared similarly to the previously report.27 The synthesis procedure for PMMA-co-Sn12Cluster-co-ErAA(TTA)2phen was similar to that of PMMA-co-Sn12Cluster except that ErAA(TTA)2phen (Er/cluster molar ratio = 5%) was added into the reaction mixture. ErAA(TTA)2phen (IR, cm−1): 1581 and 1417 (COO–), 1520 (phen CC), 1600 (coordinated CO), 416 (Er–O).
The Sm(III), Yb(III), and Nd(III) hybrid materials were synthesized using the same procedures as Er described above.
4.4. Preparation of the films from PMMA-co-Sn12Cluster/Er(TTA)3phen, and PMMA-co-Sn12Cluster-co-ErAA(TTA)2phen
The transparent films were easily prepared by first dissolving the samples in the THF, then spin-coating on the ITO glass, and finally drying in air.4.5. Characterization
Field-emission scanning electron microscopy (FE-SEM) images were obtained with a XL30 ESEM FEG microscope. The luminescence excitation and emission spectra were recorded on a HORIBA Jobin Yvon FluoroLog-3 spectrofluorometer equipped with a 450 W Xe-lamp as an excitation source and a liquid-nitrogen-cooled R5509-72 PMT as a detector. The time-resolved measurements were performed by using the third harmonic (355 nm) of a Spectra-physics Nd:YAG laser with a 5 ns pulse width and 5 mJ of energy per pulse as a source, and the NIR emission lines were dispersed by the emission monochromator of the HORIBA Jobin Yvon FluoroLog-3 equipped with a liquid-nitrogen-cooled R5509-72 PMT, and the data were analysed with a LeCroy WaveRunner 6100 1GHz Oscilloscope. The optical measurements were performed at room temperature. FT-IR spectra were measured within a 4000–400 cm−1 region on an American BIO-RAD Company model FTS135 infrared spectrophotometer using the KBr pellet technique. The diffuse reflectance (DR) measurements were recorded on a SHIMADZU UV-3600 spectrophotometer. 1H and 119Sn NMR spectra were recorded on Bruker AV-400 spectrometer, 119Sn NMR spectra (CD2Cl2) were obtained under proton decoupling and chemical shifts are relative to external tetramethyltin. TGA measurements were performed on a Perkin–Elmer Thermal Analysis Pyris Diamond TG/DTA. The samples were heated under air from 40 to 800 °C at a heat rate of 10 °C min−1. The content of Er3+ ions was obtained by inductively coupled plasma-atomic emission spectroscopy (ICP-AES-MS) with a TJA-POEMS spectrometer. The molecular weights and molecular weight distributions of the samples were determined in THF with a Gel Permeation Chromatography (GPC) instrument using WATERS-410GPC equipped with WATO44219 HT6E.Acknowledgements
The authors are grateful for financial aid from the National Natural Science Foundation of China (Grant No. 20631040, and 20771099) and the MOST of China (Grant No. 2006CB601103, 2006DFA42610).Notes and references
- (a) M. Nyk, R. Kumar, T. Y. Ohulchanskyy, E. J. Bergey and P. N. Prasad, Nano Lett., 2008, 8, 3834 CrossRef CAS; (b) S. Comby, D. Imbert, C. Vandevyver and J.-C. G. Bünzli, Chem.–Eur. J., 2007, 13, 936 CrossRef CAS.
- (a) L. Kou, D. C. Hall and H. Wu, Appl. Phys. Lett., 1998, 72, 3411 CrossRef CAS; (b) R. G. Sun, Y. Z. Wang, Q. B. Zheng, H. J. Zhang and A. J. Epstein, J. Appl. Phys., 2000, 87, 7589 CrossRef.
- (a) H. X. Wang, X. Q. Yang, S. Zhao, B. T. Zhang, H. T. Huang, J. F. Yang, J. L. Xu and J. L. He, Laser Phys., 2009, 19, 1824 CrossRef CAS; (b) Z. T. Jia, A. Arcangeli, X. T. Tao, J. Zhang, C. M. Dong, M. H. Jiang, L. Bonelli and M. Tonelli, J. Appl. Phys., 2009, 105, 083113 CrossRef.
- (a) L. N. Sun, J. B. Yu, H. J. Zhang, Q. G. Meng, E. Ma, C. Y. Peng and K. Y. Yang, Microporous Mesoporous Mater., 2007, 98, 156 CrossRef CAS; (b) J.-C. G. Bünzli and C. Piguet, Chem. Soc. Rev., 2005, 34, 1048 RSC; (c) C. Y. Fu, J. S. Liao, W. Q. Luo, R. F. Li and X. Y. Chen, Opt. Lett., 2008, 33, 953 Search PubMed; (d) W. Q. Fan, J. Feng, S. Y. Song, Y. Q. Lei, Y. Xing, R. P. Deng, S. Dang and H. J. Zhang, Eur. J. Inorg. Chem., 2008, 5513 CrossRef CAS.
- (a) L. D. Carlos, R. A. S. Ferreira, V. de Zea Bermudez and S. J. L. Ribeiro, Adv. Mater., 2009, 21, 509 CrossRef CAS; (b) S. Comby and J.-C. G. Bünzli, in Handbook on the Physics and Chemistry of Rare Earths, ed. K. A. Gschneidner, J.-C. G. Bünzli and V. K. Pecharsky, Elsevier, Amsterdam, 2007, vol. 37, ch. 235, pp. 217–470 Search PubMed; (c) J. Feng, S. Y. Song, Y. Xing, H. J. Zhang, Z. F. Li, L. N. Sun, X. M. Guo and W. Q. Fan, J. Solid State Chem., 2009, 182, 435 CrossRef CAS.
- (a) K. Binnemans, Chem. Rev., 2009, 109, 4283 CrossRef CAS; (b) H. R. Li, P. Liu, Y. G. Wang, L. Zhang, J. B. Yu, H. J. Zhang, B. Y. Liu and U. Schubert, J. Phys. Chem. C, 2009, 113, 3945 CrossRef CAS; (c) Y. J. Li and B. Yan, Inorg. Chem., 2009, 48, 8276 CrossRef CAS; (d) K. Kuriki, Y. Koike and Y. Okamoto, Chem. Rev., 2002, 102, 2347 CrossRef CAS.
- (a) C. Y. Peng, H. J. Zhang, J. B. Yu, Q. G. Meng, L. S. Fu, H. R. Li, L. N. Sun and X. M. Guo, J. Phys. Chem. B, 2005, 109, 15278 CrossRef CAS; (b) P. Liu, H. R. Li, Y. G. Wang, B. Y. Liu, W. J. Zhang, Y. J. Wang, W. D. Yan, H. J. Zhang and U. Schubert, J. Mater. Chem., 2008, 18, 735 RSC; (c) F. Y. Liu, L. S. Fu, J. Wang, Z. Liu, H. R. Li and H. J. Zhang, Thin Solid Films, 2002, 419, 178 CrossRef CAS; (d) P. Lenaerts, K. Driesen, R. VanDeun and K. Binnemans, Chem. Mater., 2005, 17, 2148 CrossRef CAS; (e) M. Fernandes, V. de Zea Bermudez, R. A. SáFerreira, L. D. Carlos, A. Charas, J. Morgado, M. M. Silva and M. J. Smith, Chem. Mater., 2007, 19, 3892 CrossRef CAS.
- (a) C. Sanchez, G. J. de, A. A. Soler-Illia, F. Ribot, C. R. Mayer, V. Cabuil and T. Lalot, Chem. Mater., 2001, 13, 3061 CrossRef CAS; (b) G. Kickelbick and U. Schubert, Monatsh. Chem., 2001, 132, 13 CrossRef CAS.
- (a) F. Banse, F. Ribot, P. Tolédano, J. Maquet and C. Sanchez, Inorg. Chem., 1995, 34, 6371 CrossRef CAS; (b) C. Eychenne-Baron, F. Ribot, N. Steunou and C. Sanchez, Organometallics, 2000, 19, 1940 CrossRef CAS.
- (a) F. Ribot, F. Banse, F. Diter and C. Sanchez, New J. Chem., 1995, 19, 1145 Search PubMed; (b) F. Ribot, F. Banse, C. Sanchez, M. Lahcini and B. Jousseaume, J. Sol–Gel Sci. Tech., 1997, 8, 529 CrossRef CAS; (c) L. Angiolini, D. Caretti, R. De Vito, F. T. Niesel, E. Salatelli, C. Carlini, F. Ribot and C. Sanchez, J. Inorg. Organomet. Polym., 1997, 7, 151 CrossRef CAS.
- F. Ribot, A. Lafuma, C. Eychenne-Baron and C. Sanchez, Adv. Mater., 2002, 14, 1496 CrossRef CAS.
- W. Q. Fan, J. Feng, S. Y. Song, Y. Q. Lei, G. L. Zheng and H. J. Zhang, Chem.–Eur. J., 2010, 16, 1903, DOI:10.1002/chem.200902111.
- H. Reuter and A. Sebald, Z. Naturforsch., B, 1993, 48, 195 CAS.
- F. Ribot, C. Eychenne-Baron and C. Sanchez, Phophorus, Sulfur and Silicon, 1999, 150-151, 41 Search PubMed.
- (a) S. Dang, L. N. Sun, H. J. Zhang, X. M. Guo, Z. F. Li, J. Feng, H. D. Guo and Z. Y. Guo, J. Phys. Chem. C, 2008, 112, 13240 CrossRef CAS; (b) S. I. Klink, L. Grave, D. N. Reinhoudt, F. van Veggel, M. H. V. Werts, F. A. J. Geurts and J. W. Hofstraat, J. Phys. Chem. A, 2000, 104, 5457 CrossRef CAS.
- L. N. Sun, H. J. Zhang, L. S. Fu, F. Y. Liu, Q. G. Meng, C. Y. Peng and J. B. Yu, Adv. Funct. Mater., 2005, 15, 1041 CrossRef CAS.
- (a) J. A. Capobianco, F. Vetrone, J. C. Boyer, A. Speghini and M. Bettinelli, J. Phys. Chem. B, 2002, 106, 1181 CrossRef CAS; (b) M. Benatsou, B. Capoen, M. Bouazaoui, W. Tchana and J. P. Vilcot, Appl. Phys. Lett., 1997, 71, 428 CrossRef CAS.
- (a) V. Vicinelli, P. Ceroni, M. Maestri, V. Balzani, M. Gorka and F. Vögtle, J. Am. Chem. Soc., 2002, 124, 6461 CrossRef CAS; (b) Y. Hasegawa, Y. Kimura, K. Murakoshi, Y. Wada, J. H. Kim, N. Nakashima, T. Yamanaka and S. Yanagida, J. Phys. Chem., 1996, 100, 10201 CrossRef CAS.
- L. N. Sun, H. J. Zhang, J. B. Yu, S. Y. Yu, C. Y. Peng, S. Dang, X. M. Guo and J. Feng, Langmuir, 2008, 24, 5500 CrossRef CAS.
- (a) J. T. Sun, J. H. Zhang, Y. S. Luo, J. L. Lin and H. W. Song, J. Appl. Phys., 2003, 94, 1325 CrossRef CAS; (b) A. Jha, S. Shen and M. Naftaly, Phys. Rev. B, 2000, 62, 6215 CrossRef CAS.
- (a) O. H. Park, S. Y. Seo, B. S. Bae and J. H. Shin, Appl. Phys. Lett., 2003, 82, 2787 CrossRef CAS; (b) O. H. Park, S. Y. Seo, J. I. Jung, J. Y. Bae and B. S. Bae, J. Mater. Res., 2003, 18, 1039 CrossRef CAS; (c) A. Q. L. Quang, V. G. Truong, A. M. Jurdyc, B. Jacquier, J. Zyss and I. Ledoux, J. Appl. Phys., 2007, 101, 023110 CrossRef.
- (a) J. Feng, J. B. Yu, S. Y. Song, L. N. Sun, W. Q. Fan, X. M. Guo, S. Dang and H. J. Zhang, Dalton Trans., 2009, 2406 RSC; (b) M. P. O. Wolbers, F. C. J. M. van Veggel, B. H. M. Snellink-Ruel, J. W. Hofstraat, F. A. J. Geurts and D. N. Reinhoudt, J. Chem. Soc., Perkin Trans. 2, 1998, 2141 RSC.
- G. Boulon, A. Collombet, A. Brenier, T. Cohen-Adad, M. A. Yoshikawa, K. Lebbou, J. H. Lee and T. Fukuda, Adv. Funct. Mater., 2001, 11, 263 CrossRef CAS.
- (a) L. H. Sloof, A. van Blaaderen, A. Polman, G. A. Hebbink, S. I. Klink, F. C. J. M. van Veggel, D. N. Reinhoudt and J. W. Hofstraat, J. Appl. Phys., 2002, 91, 3955 CrossRef CAS; (b) L. N. Sun, J. B. Yu, G. L. Zheng, H. J. Zhang, Q. G. Meng, C. Y. Peng, L. S. Fu, F. Y. Liu and Y. N. Yu, Eur. J. Inorg. Chem., 2006, 3962 CrossRef CAS; (c) L. H. Slooff, A. Polman, F. Cacilli, R. H. Friend, G. A. Hebbink, F. C. J. M. van Veggel and D. N. Reinhoudt, Appl. Phys. Lett., 2001, 78, 2122 CrossRef CAS.
- S. Gago, J. A. Fernandes, J. P. Rainho, R. A. SáFerreira, M. Pillinger, A. A. Valente, T. M. Santos, L. D. Carlos, P. J. A. Ribeiro-Claro and I. S. Goncüalves, Chem. Mater., 2005, 17, 5077 CrossRef CAS.
- L. R. Melby, N. J. Rose, E. Abramson and J. C. Caris, J. Am. Chem. Soc., 1964, 86, 5117 CrossRef CAS.
- L. Liu, Y. L. Lu, H. Lei, W. Zhang, C. Yang, Y. D. Liu, L. Q. Zhang and R. G. Jin, Adv. Funct. Mater., 2005, 15, 309 CrossRef CAS.
Footnote |
| † Electronic Supplementary Information (ESI) available: Figure S1. See DOI: 10.1039c0nr00233j |
| This journal is © The Royal Society of Chemistry 2010 |