A nanostructured graphene/polyaniline hybrid material for supercapacitors
Hualan
Wang
,
Qingli
Hao
*,
Xujie
Yang
,
Lude
Lu
and
Xin
Wang
*
Key Laboratory of Soft Chemistry and Functional Materials, Ministry of Education, Nanjing University of Science and Technology, Nanjing, 210094, P. R. China. E-mail: haoqingli@yahoo.com; wangx@mail.njust.edu.cn; Fax: +86 25 84315943; Tel: +86 25 84315943
First published on 6th August 2010
Abstract
A flexible graphene/polyaniline hybrid material as a supercapacitor electrode was synthesized by an in situ polymerization-reduction/dedoping-redoping process. This product was first prepared in an ethylene glycol medium, then treated with hot sodium hydroxide solution to obtain the reduced graphene oxide/polyaniline hybrid material. Sodium hydroxide also acted as a dedoping reagent for polyaniline in the composite. After redoping in an acidic solution, the thin, uniform and flexible conducting graphene/polyaniline product was obtained with unchanged morphology. The chemical structure of the materials was characterized by X-ray photoelectron spectroscopy and Raman spectroscopy. The composite material showed better electrochemical performances than the pure individual components. A high specific capacitance of 1126 F g−1 was obtained with a retention life of 84% after 1000 cycles for supercapacitors. The energy density and power density were also better than those of pure component materials.
1. Introduction
Graphene, a single layer of carbon atoms, has attracted a great deal of attention since it was discovered in 2004 by Geim,1 due to its extraordinary electric, thermal and mechanical properties.2 Moreover, graphene nanosheets exhibit large surface-to-volume ratio, which renders it as an attractive substrate material when compounded with polymers and inorganic particles for lithium ion batteries, electrochemical capacitors or in other fields.3–6 An important aspect for such graphene-based composite materials is to control the graphene sheets as thin as possible and to disperse them homogeneously in the matrix, which is necessary for improving its electrochemical properties.Polyaniline (PANI) is a popular conducting polymer investigated due to its ease of synthesis, environmental stability, simple acid-doping/base-dedoping chemistry, and so on.7–10 The excellent properties of graphene and the advantages of PANI have attracted great research interests in preparing graphene/PANI (GEP) composites. Both electrochemical and chemical methods have been used to synthesize the composite in reported literatures.11–13 However, in these researches, graphene was prepared by reducing graphene oxide (GEO) first and then followed by compounding with PANI, which might greatly affect the disperse extent of graphene and the properties of the composite. A GEP composite was made by reducing GEO using hydrazine hydrate in presence of PANI after the compound step for supercapacitor electrode recently.14 However, the specific capacitance reported is only 480 F g−1. So the strategy to fabricate GEP still remains a great challenge.
To overcome these difficulties for the preparation of GEP composite, we present here for the first time a simple three-step synthesis method realized by an in situ polymerization-reduction/dedoping-redoping process. This method greatly improves the specific capacitance, retention time, energy density, and power density of the composite as electrode material for supercapacitors.
2. Experimental
2.1 Preparation of graphite oxide (GO)
GO was prepared using modified Hummers method15 from graphite with the size 500 mesh. 20 g of graphite powder was added to an 80 °C solution of 30 mL concentrated H2SO4, 10 g K2S2O8 and 10 g P2O5, and the mixture was allowed to react for 6 h. The resulting mixture was then slowly diluted with distilled water, and then filtered until the filtrate became neutral. The product was dried in air at ambient temperature until a constant weight. The pre-oxidized graphite was then put into 460 mL of 0 °C concentrated H2SO4, then 60 g KMnO4 was added gradually with stirring in ice bath while the temperature was controlled not to exceed 20 °C. The solution was then stirred at 35 °C for 2 h. 920 mL of distilled water was slowly added to cause an increase in temperature to 95–100 °C, and the solution was kept at that temperature for 30 min. The reaction was terminated by the addition of 2.8 L distilled water and 50 mL of 30% H2O2 solution. The product was filtered and washed with 5 L 1![[thin space (1/6-em)]](https://www.rsc.org/images/entities/char_2009.gif) :
:![[thin space (1/6-em)]](https://www.rsc.org/images/entities/char_2009.gif) 10 HCl solution. The GO product was then subjected to dialysis for a week to completely remove metal ions and acids. The GO dispersion was centrifuged and the precipitate was directly dispersed in the solvent for next experimental step.
10 HCl solution. The GO product was then subjected to dialysis for a week to completely remove metal ions and acids. The GO dispersion was centrifuged and the precipitate was directly dispersed in the solvent for next experimental step.
2.2 Preparation of GEP composite by three-step synthesis method
The composite was synthesized simply through three steps. Firstly, 1 mg mL−1 GO in 180 mL ethylene glycol was ultrasonicated (250 W, 220 V) for 1 h to get an exfoliated yellow-brown GEO suspension. Aniline was slowly added into the suspension and the stable single layer GEO/aniline suspension was obtained after stirring violently. A mixture of concentrated hydrochloric acid, ammonium persulfate (APS) in 20 mL ethylene glycol was then slowly added to the suspension under stirring. The molar ratio of aniline, hydrochloric acid and APS was 1![[thin space (1/6-em)]](https://www.rsc.org/images/entities/char_2009.gif) :
:![[thin space (1/6-em)]](https://www.rsc.org/images/entities/char_2009.gif) 1
1![[thin space (1/6-em)]](https://www.rsc.org/images/entities/char_2009.gif) :
:![[thin space (1/6-em)]](https://www.rsc.org/images/entities/char_2009.gif) 1. The reaction was conducted by the in situ polymerization method in ice bath for 1 h, the yellow-brown suspension gradually changed to deep green color. The prepared composite was filtered, rinsed with distilled water and signed as GEOP-1. Secondly, the GEO in GEOP-1 was reduced16 and PANI was simultaneously dedoped by 14.4 mL 8 M sodium hydroxide at 90 °C for 5 h. In the basic medium, the color changed from deep green to dark purple. The composite was filtered and rinsed with distilled water until the filtrate became neutral. The product was marked as GEP-2. Thirdly, GEP-2 was immersed in 0.2 M HCl and stirred for 24 h for redoping of PANI, then filtered and rinsed with distilled water and the final product was signed as GEP-3.
1. The reaction was conducted by the in situ polymerization method in ice bath for 1 h, the yellow-brown suspension gradually changed to deep green color. The prepared composite was filtered, rinsed with distilled water and signed as GEOP-1. Secondly, the GEO in GEOP-1 was reduced16 and PANI was simultaneously dedoped by 14.4 mL 8 M sodium hydroxide at 90 °C for 5 h. In the basic medium, the color changed from deep green to dark purple. The composite was filtered and rinsed with distilled water until the filtrate became neutral. The product was marked as GEP-2. Thirdly, GEP-2 was immersed in 0.2 M HCl and stirred for 24 h for redoping of PANI, then filtered and rinsed with distilled water and the final product was signed as GEP-3.
2.3 Preparation of electrodes
The test electrodes were prepared by mixing 85 wt% active material with 10 wt% acetylene black as a conductive agent and 5 wt% polytetrafluoroethylene dissolved in distilled water as a binder to form a slurry, coating onto a stainless steel, and then pressing and drying under vacuum at 60 °C for 24 h. All electrochemical experiments were carried out using a three-electrode system, in which the sample was used as the test electrode, platinum as the counter, saturated calomel electrode (SCE) as reference electrode and 1 M H2SO4 was used as electrolyte. Charge-discharge measurements were carried out galvanostatically at 100–400 mA g−1 rate over a voltage range of −0.2 to 0.6 V.2.4 Material characterization
Field emission scanning electron microscopy (FE-SEM) and transmission electron microscopy (TEM) measurements were carried out with JEOL JSM-6380LV FE-SEM and JEM-2100 TEM, respectively. Raman was recorded with a Renishaw inVia Raman Microscope operating at 514 nm with a charge-coupled device detector. X-Ray photoelectron spectroscopy (XPS) studies were conducted with a Thermo ESCALAB 250 instrument. Cyclic Voltammetry (CV) measurements were performed with a CHI660B workstation. Galvanostatic charge-discharge testing was done using a Land Battery workstation.3. Results and discussion
Fig. 1(a)–(c) show the FE-SEM images of GEOP-1, GEP-2 and GEP-3, respectively. The morphology of uniform PANI nanoparticles dispersed on graphene sheets can be clearly observed for all of these composites. Such combining can be well kept in the following reduction/dedoping and redoping steps. Reduction of GEO/dedoping of PANI by sodium hydroxide and redoping process for PANI do not get rid of PANI nanoparticles from the nanosheets. Fig. 1(d)–(f) show the TEM images of PANI, GEP-2 and graphene, respectively. The TEM images indicate that the synthesized GEP-2 composite (Fig. 1e, h) is significantly different from pure fibrous PANI (Fig. 1d) prepared in ethylene glycol and graphene (Fig. 1f) obtained using sodium hydroxide as reduction reagent. Fig. 1(g)–(i) show the TEM images of GEOP-1, GEP-2 and GEP-3, respectively. The size of PANI particles is about 10–20 nm, which compactly covers the carbon nanosheets with the total thickness 30–40 nm. Such ultra-thin composites reveal the exfoliation of graphene sheets and the adequate utilization of the large specific surface area of graphene sheets. This may be favorable for the enhancement of the electrochemical performances as an electrode for supercapacitors. From the bent and flat morphology as shown in Fig. 1(a)–(c), one can observe clearly that the hybrid materials GEOP-1, GEP-2 and GEP-3 exhibit flexible character. This indicates the good mechanical performances of the hybrid materials due to the introduction of graphene sheets.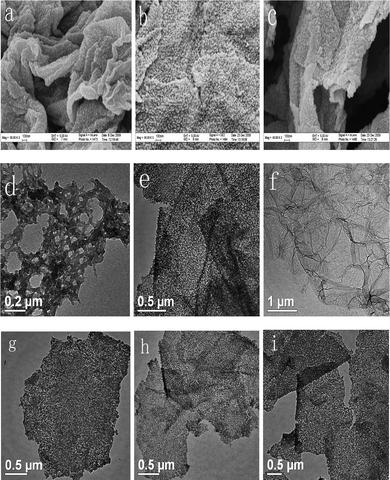 | ||
| Fig. 1 FE-SEM images of (a) GEOP-1, (b) GEP-2 and (c) GEP-3. TEM images of (d) PANI, (f) graphene, (g) GEOP-1, (e, h) GEP-2 and (i) GEP-3. | ||
The formation mechanism of the GEP composite is depicted in Fig. 2. The multilayer GO is extensively exfoliated into GEO nanosheets with abundant oxygen containing groups on both face and edges under ultrasonication in ethylene glycol. Such GEO nanosheets facilitate the uniform adsorption of aniline molecules under stirring. When APS and hydrochloric acid are added into the suspension under ice bath, the aniline molecules absorbed on the sheets are initiated to polymerize just from the absorbed sites on the surface, and then the structure of PANI-covering nanosheet slowly forms. This structure of the hybrid material maintains unchanged when GEO sheets are reduced and PANI are dedoped by sodium hydroxide at the temperature of 90 °C for 5 h, and it keeps steady even when PANI nanoparticles are redoped in hydrochloric acid solution. In addition, the morphology of the prepared hybrid material is quite uniform and no individual graphene or PANI agglomerates can be observed, indicating that graphene sheets are covered by nanostructured PANI granules completely and successfully. It is noteworthy that the hybrid nanosheets can be convoluted freely without being splitting into pieces (Fig. 2, see blue lines in GEOP-1 and GEP-3 in the TEM images), further indicating the flexibility of the composites. The perfect coverage of PANI on graphene makes full use of the large specific area of graphene and could be favorable for the enhancement of electrochemical properties of the composite materials.
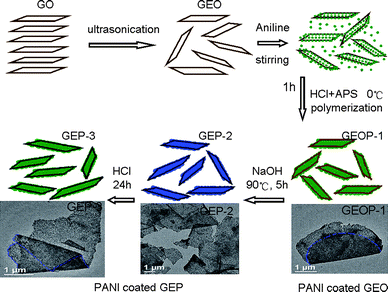 | ||
| Fig. 2 A scheme illustrating the preparation process of GEP hybrid materials. | ||
Fig. 3 shows the Raman spectra of GO, PANI, graphene, GEOP-1, GEP-2 and GEP-3. The Raman spectra show significant structural changes occurring during the chemical processing from GEOP-1 to GEP-2 under reduction/dedoping process, from GEP-2 to GEP-3 upon redoping step. Both GO and graphene have a couple of Raman-active bands in the spectra, with the D band at 1350 cm−1 corresponding to defects or edge areas and G band at 1598 cm−1 related to the vibration of sp2-hybridized carbon. The Raman spectra show an increase in the D/G ratio, from 0.76 for GO to 0.83 for graphene, indicating the increased defects or edge areas by reduction of GO. These defects might be due to the smaller size of graphene sheets as well as the remaining functionalities.17–19 The spectrum of neat PANI show bands at 1162, 1338, 1507 and 1597 cm−1 corresponding to C–H bending of the quinoid ring, C–N+˙ stretching of the bipolaron structure, N–H bending of the bipolaronic structure and C–C stretching of the benzenoid ring, respectively.20–22 The representative peaks of GEOP-1 reflecting the quinone imide situate at 776, 1162, 1216, 1485 and 1587 cm−1, corresponding to imine deformation, in plane C–H bending of quinoid, in plane ring deformation, C![[double bond, length as m-dash]](https://www.rsc.org/images/entities/char_e001.gif) N stretching, C
N stretching, C![[double bond, length as m-dash]](https://www.rsc.org/images/entities/char_e001.gif) C stretching vibration, respectively.19 When deoxidized by sodium hydroxide, the peak at 1338 cm−1 corresponding to C–N+˙ almost disappeared by the dedoping action (GEP-2).23 In addition, the intensities of Raman peaks standing for quinone imide structure increase markedly, indicating a change of imine/amine ratio in PANI. It is necessary to point out that the relative intensities of these peak decrease after redoping by HCl (GEP-3), though not completely returning to the former state of GEOP-1. What is more, the peak of characteristic Raman vibration of C–N+˙ emerges again after redoping process, revealing an increased doping level. These results indicate that the reduction/dedoping–redoping processes affect the PANI chain structure greatly, which may influence the properties of the composite.
C stretching vibration, respectively.19 When deoxidized by sodium hydroxide, the peak at 1338 cm−1 corresponding to C–N+˙ almost disappeared by the dedoping action (GEP-2).23 In addition, the intensities of Raman peaks standing for quinone imide structure increase markedly, indicating a change of imine/amine ratio in PANI. It is necessary to point out that the relative intensities of these peak decrease after redoping by HCl (GEP-3), though not completely returning to the former state of GEOP-1. What is more, the peak of characteristic Raman vibration of C–N+˙ emerges again after redoping process, revealing an increased doping level. These results indicate that the reduction/dedoping–redoping processes affect the PANI chain structure greatly, which may influence the properties of the composite.
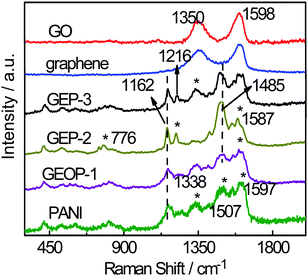 | ||
| Fig. 3 Raman spectra of pristine GO, PANI, graphene, GEOP-1, GEP-2 and GEP-3. | ||
XPS is a widely used tool for the characterization of materials. Fig. 4(a) shows the XPS results of GEOP-1 and GEP-2. The O/C ratio decreases from 0.186 in GEOP-1 to 0.063 in GEP-2 after the treatment by hot basic solution. The decreased oxygen content increases the sp2 carbons on the graphene sheets, leading to an increase of the π–π interaction between graphene and PANI chains, which may facilitate the electron transfer and bring a synergistic effect on electrochemical properties of the hybrid material. In addition, the peak of chloride element disappears in XPS spectra, indicating that PANI in the composite are completely dedoped along with the reduction process. After the redoping step, however, the chloride element appears again (not shown here), indicating the successfully redoping action of PANI by hydrochloric acid. To confirm this, the N 1s core-level XPS spectra of GEOP-1, GEP-2 and GEP-3 are given in Fig. 4(b). The N 1s core-level XPS spectrum of GEOP-1 is decomposed into four Gaussian peaks with their binding energy of 399.4 (![[double bond, length as m-dash]](https://www.rsc.org/images/entities/char_e001.gif) N–), 399.7 (–NH–), 400.1 and 401.3 eV (N+˙). After treatment by sodium hydroxide in GEP-2, the peaks standing for positively charged nitrogen (N+˙) disappear, further indicating the completely dedoping of PANI. When stirred in HCl solution, the N+˙ peaks emerge again in GEP-3, indicating the successful redoping of PANI. These results combining with Raman analysis show that sodium hydroxide in the second step acts as the medium of deoxygenization reaction and dedoping reagent simultaneously.
N–), 399.7 (–NH–), 400.1 and 401.3 eV (N+˙). After treatment by sodium hydroxide in GEP-2, the peaks standing for positively charged nitrogen (N+˙) disappear, further indicating the completely dedoping of PANI. When stirred in HCl solution, the N+˙ peaks emerge again in GEP-3, indicating the successful redoping of PANI. These results combining with Raman analysis show that sodium hydroxide in the second step acts as the medium of deoxygenization reaction and dedoping reagent simultaneously.
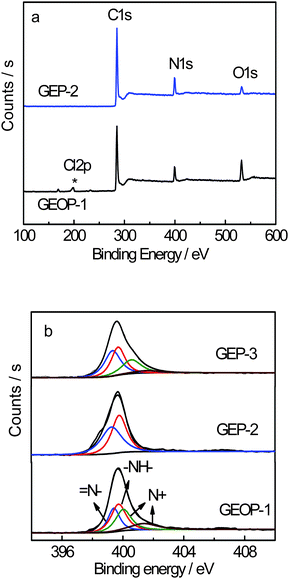 | ||
| Fig. 4 (a) XPS spectra of GEOP-1 and GEP-2. (b) The N 1s core-level XPS spectra of GEOP-1, GEP-2 and GEP-3. | ||
The electrochemical performance of the electrode materials was analyzed using CV and galvanostatic charge-discharge. Fig. 5(a) shows the CV curves of the pristine graphene, PANI, GEOP-1, GEP-2 and GEP-3 at a scan rate of 1 mV s−1 in 1 M H2SO4 electrolyte in the potential range from −0.2 to 0.6 V. Both PANI and the composite electrodes show a pair of redox peaks. In our case, the peak positions of individual components are very close to each other and nearly merge into one peak. The redox peaks of the composite can be ascribed to a comprehensive effect of the changing in PANI structures and the remained oxygenated groups of the graphene-based nanosheets.
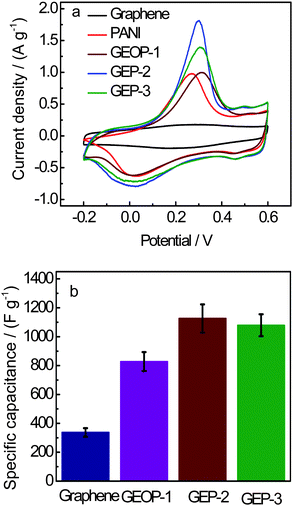 | ||
| Fig. 5 (a) CV curves of graphene, PANI, GEOP-1, GEP-2 and GEP-3 at 1 mV s−1 in 1 M H2SO4 in the potential range from −0.2 to 0.6 V. (b) Specific capacitance changes with different samples. | ||
As shown in Fig. 5(a), for the composites of GEOP and GEP, there are an apparent couple of redox peaks in each CV curve, which mainly results from the redox transition of PANI between a semiconducting state (leucoemeraldine form) and a conducting state (polaronic emeraldine form). Of course, there is also the contribution of the redox reactions existing in the remained oxygeneous of the GEO and reduced GEO. The strong peak at 0.3 V is probably due to some semi-redox processes of these two components with the synergy effect.
The specific capacitance of the electrode can be calculated according to the following equation11 from CV curves
| C= (∫IdV)/(vmV) | (1) |
The pristine graphene electrode exhibits an approximated rectangular shape that is characteristic of an electric double layer capacitance (EDLC) with a specific capacitance of 316 F g−1. This capacitance is higher than those given by Ruoff and Yang,24,25 perhaps due to the different synthesis routes of graphene and cell configurations for the measurement. The PANI electrode shows a pair of redox peak that is characteristic of pseudocapacitance with the specific capacitance 777 F g−1. On the other hand, the CV curves of GEOP-1, GEP-2 and GEP-3 electrodes show a behaviour of a combination of both EDLC and redox capacitance with the specific capacitance of 827, 1126 and 1079 F g−1, respectively. The XPS result shows that the mass ratios of PANI and graphene oxide in GEOP-1 are about 79.2% and 20.8% in GEOP-1, respectively. After reduction/dedoping, the values for PANI and graphene are 91.7% and 8.3% in GEP-2, respectively. When redoped with hydrochloric acid, the mass ratios for PANI and graphene are 92.3% and 7.7%, respectively. The difference of the specific capacitance of these composites may be related to the change of mass ratios of individual components. The current density response of composites is larger than that of graphene and PANI, indicating the electrochemical properties of the composites are advancing. Perhaps the mass ratio of the components of these composites could influence the electrochemical properties. The GEOP-1 electrode exhibits a sharply increased electrochemical capacitance compared to the graphene electrode (Fig. 5b). After treating with sodium hydroxide, the specific capacitance of GEP-2 electrode goes as high as 1126 F g−1. Although the redoping process leads to a little decrease of the capacitance, the specific capacitance of 1079 F g−1 for GEP-3 is still higher than GEOP-1 and much better than each component of the hybrid material. Moreover, the specific capacitance of GEP obtained here is the highest till now for GEP composite as we know.10–13 The theoretical specific capacitance (Ct) of GEP-2 without regard to the synergy effect between graphene and PANI can be calculated according to
| Ct = C(graphene) × R(graphene) + C(PANI) × R(PANI) | (2) |
| ΔC = CE(GEP-2)-Ct | (3) |
The charge-discharge plots of GEP-2 at different current densities for the initial two cycles are given in Fig. 6(a). GEP-2 charge-discharge curves almost maintain the same shape in the potential range from −0.2 to 0.6 V in 1 M H2SO4 at a current density of 100, 200 and 400 mA g−1. This reveals that the hybrid material can experience a broad electric current range. The time duration decreases with the current densities from 100 to 400 mA g−1. It can be seen that the curves in Fig. 6a not only exhibit EDLC but also Faradaic capacitance for the initial cycles. Fig. 6(b) shows CV curves of GEP-2 at different scan rates of 1–100 mV s−1. It can be noted that the peak current density increases as the scan rate increases and the shape of CV curve does not change evidently below 20 mV s−1, indicating a good rate property for GEP-2 composite electrode. Generally, the capacitance decreases as the scan rate increases. The specific capacitances of 1126, 929 and 786 F/g are obtained at scan rates of 1, 5 and 10 mV s−1, respectively.
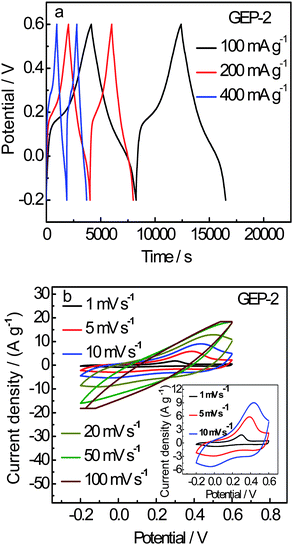 | ||
| Fig. 6 (a) Galvanostatic charge-discharge curves of GEP-2 at the current density of 100, 200 and 400 mA g−1 and (b) CV curves of GEP-2 at different scan rates of 1, 5, 10 mV s−1 in 1 M H2SO4 from −0.2 to 0.6 V. | ||
The cycling performance is an important aspect for supercapacitor electrode materials. Fig. 7(a) gives a non-linear galvanostatic charge-discharge curve of GEP-2 for the first 1–5 cycles, which presents an evident pseudocapacitance character. After 1000 cycles the bending extent of the curve becomes weak and the curve tends to linear, but still non-linear. This indicates the contribution of pseudocapacitance in GEP hybrid materials decreases, and the EDLC effect becomes evident.
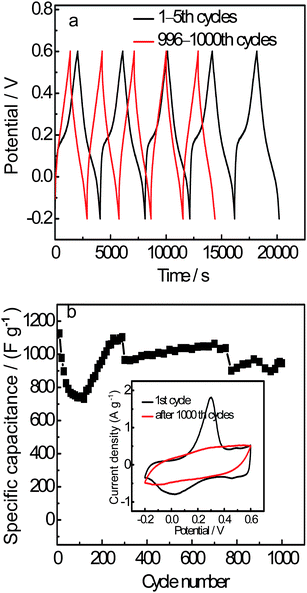 | ||
| Fig. 7 (a) Comparison of galvanostatic charge–discharge curves of GEP-2 between 1–5th and 996–1000th cycles at 200 mA g−1 in 1 M H2SO4 in the potential range from −0.2 to 0.6 V. (b) Specific capacitance as a function of cycle number. (Inset: comparison of the CV curves before charge-discharge test and after 1000 cycles for charge–discharge test). | ||
The CV curves before charge-discharge test and after 1000 cycles are shown in Fig. 7(b) (inset). A large and wide area of the CV curve with a pair of evident redox peaks can be seen before charge–discharge test, indicating both EDLC and pseudocapacitance performance of the electrode. After 1000th cycles, the redox peaks become weak and nearly disappear. This results from the reduced pseudocapacitance of PANI.
The specific capacitance as a function of cycle number is shown in Fig. 7(b). It is interesting that the specific capacitance sharply decreases first for the 1–100 cycles and increases rapidly for 100–200 cycles and then maintain approximately steady after 200 cycles around ∼900 F g−1. The first 200 cycles are probably the material activation process. The vibration of the specific capacitance in the middle part of the curve probably results from the decay of pseudocapacitance, which is due to the changing in the functional groups of carbon sheets or the degradation of the PANI chain during the long-time charge–discharge process.
After reduction–dedoping treatment, the specific capacitance for GEP-2 after 1000 cycles still maintains 946 F g−1, corresponding to 84% of the initial cycle. This result is better than that reported for the composites of graphene and PANI with a capacitance retention of 84% after only 40 cycles.13 While the capacitance retention of GEOP-1 after 1000 cycles is only 59% under the same condition. The enhanced retention life for GEP-2 is mainly due to the change from GEO to graphene in the hybrid material, leading to the improvement of mechanical properties of the composite. That is to say, the swelling and shrinkage of PANI during doping–dedoping processes can be restrained efficiently. The electrode material GEP-3 also shows good capacitance performance with about 72% of the initial specific capacitance after 1000 cycles. The main difference of specific capacitance between GEP-3 and GEP-2 is possibly due to the introducing of the counter ions Cl− in GEP-3. All these hybrid materials show much better capacitance performance than that of individual PANI. This indicates that the synergy effect of two individual components greatly improves the retention life of the composite material.
The image of the electrode including GEP-2, acetylene black and polytetrafluoroethylene before and after charge-discharge was given in Fig. 8(a) and Fig. 8(b), respectively. Interestingly, the morphologies of both images look similar. There are no apparent changes in the well-kept nanostructured GEP hybrid materials, in which the PANI nano particles are still covering on the graphene sheets. Such morphology is well contributing to the EDLC of the electrode.
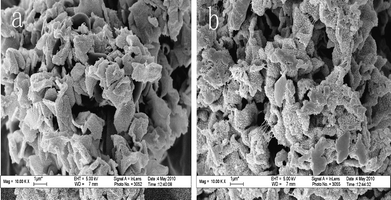 | ||
| Fig. 8 FE-SEM images of prepared electrode (a) before charge-discharge test and (b) after 1000 cycles. | ||
Fig. 9 compares the energy density (E) and power density (P) of pure graphene, GEOP-1 and GEP composites. The specific energy density and power density are evaluated according to the equations as follows26
| E = (I∫Vdt)/m | (4) |
| P = dE/dt | (5) |
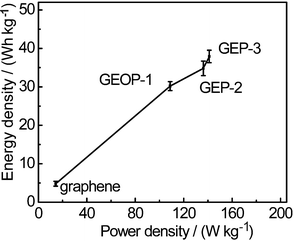 | ||
| Fig. 9 Regone plot of specific power vs. specific energy for graphene electrode and composite electrodes. | ||
4. Conclusions
We successfully developed a flexible GEP hybrid material by three-step synthesis method using graphene sheets as the substrate. In addition to its thin, uniformity and flexible merits, it also shows excellent electrochemical performances than pristine individuals for supercapacitors. Moreover, this strategy facilitates the wide application of new graphene-based composites with other conducting polymers like polypyrrole, polythiophene and so on for supercapacitors. These flexible composites with high specific capacitance would have promising applications in various energy storage devices.Acknowledgments
This work was supported by NSFC and China Academy of Engineering Physics (no.10776014), Science and Technology Supporting item of Jiangsu Province, China (no. BE2009159). SRF for ROCS, State Education Ministry and Ministry of Personnel of the PRC (2006), NUST Research Funding (ZDJH07) and Excellent Plan Foundation of NUST(2008).References
- K. S. Novoselov, A. K. Geim, S. V. Morozov, D. Jiang, Y. Zhang, S. V. Dubonos, I. V. Grigorieva and A. A. Firsov, Science, 2004, 306, 666 CrossRef CAS.
- J. S. Bunch, A. M. Van der Zande, S. S. Verbridge, I. W. Frank, D. M. Tanenbaum, J. M. Parpia, H. G. Craighead and P. L. McEuen, Science, 2007, 315, 490 CrossRef CAS.
- J. Yao, X. Shen, B. Wang, H. Liu and G. Wang, Electrochem. Commun., 2009, 11(10), 1849 CrossRef CAS.
- J. L. Vickery, A. J. Patil and S. Mann, Adv. Mater., 2009, 21(21), 2180 CrossRef CAS.
- Y. Xu, Y. Wang, J. Liang, Y. Huang, Y. Ma, X. Wan and Y. Chen, Nano Res., 2009, 2(4), 343 Search PubMed.
- C. Xu and X. Wang, Small, 2009, 5(19), 2212 CrossRef CAS.
- Q. Hao, W. Lei, X. Xia, Z. Yan, X. Yang, L. Lu and X. Wang, Electrochim. Acta, 2010, 55(3), 632 CrossRef CAS.
- H. Wang, Q. Hao, X. Yang, L. Lu and X. Wang, Electrochem. Commun., 2009, 11(6), 1158 CrossRef CAS.
- H. Wang, Q. Hao, X. Yang, L. Lu and X. Wang, ACS Appl. Mater. Interfaces, 2010, 2(3), 821 Search PubMed.
- H. Mi, X. Zhang, S. An, X. Ye and S. Yang, Electrochem. Commun., 2007, 9(12), 2859 CrossRef CAS.
- D. W. Wang, F. Li, J. P. Zhao, W. C. Ren, Z. G. Chen, J. Tan, Z. S. Wu, L. Gentle, G. Q. Lu and H. M. Chen, ACS Nano, 2009, 3(7), 1745 CrossRef CAS.
- J. Yan, T. Wei, B. Shao, Z. Fan, W. Qian, M. Zhang and F. Wei, Carbon, 2010, 48(2), 487 CrossRef CAS.
- A. V. Murugan, T. Muraliganth and A. Manthiram, Chem. Mater., 2009, 21(21), 5004 CrossRef CAS.
- K. Zhang, L. L. Zhang, X. S. Zhao and J. Wu, Chem. Mater., 2010, 22(4), 1392 CrossRef CAS.
- N. I. Kovtyukhova, P. J. Ollivier, B. R. Martin, T. E. Mallouk, S. A. Chizhik and E. V. Buzaneva, Chem. Mater., 1999, 11(3), 771 CrossRef CAS.
- X. Fan, W. Peng, Y. Li, X. Li, S. Wang, G. Zhang and F. Zhang, Adv. Mater., 2008, 20(23), 4490 CrossRef CAS.
- W. Gao, L. B. Alemany, L. Ci and P. M. Ajayan, Nat. Chem., 2009, 1, 403 Search PubMed.
- S. Stankovich, D. A. Dikin, R. D. Piner, K. A. Kohlhaas, A. Kleinhammes, Y. Jia, Y. Wu, S. T. Nguyen and R. S. Ruoff, Carbon, 2007, 45(7), 1558 CrossRef CAS.
- M. G. Markovic, J. G. Matisons, R. Cervini, G. P. Simon and P. M. Fredericks, Chem. Mater., 2006, 18, 6258 CrossRef CAS.
- M. Cochet, G. Louarn, S. Qillard, J. P. Buisson and S. Lefrant, J. Raman Spectrosc., 2000, 31(12), 1041 CrossRef CAS.
- M. Baibarac, I. Baltog, S. Lefrant, J. Y. Mevellec and O. Chauvet, Chem. Mater., 2003, 15(21), 4149 CrossRef CAS.
- W. K. Maser, A. M. Benito, M. A. Callejas, T. Seeger, M. T. Martınez, J. Schreiber, J. Muszynski, O. Chauvet, Z. Osváth, A. A. Koós and L. P. Biró, Mater. Sci. Eng., C, 2003, 23, 87 CrossRef.
- T. M. Wu and Y. W. Lin, Polymer, 2006, 47(10), 3576 CrossRef CAS.
- M. D. Stoller, S. Park, Y. Zhu, J. An and R. S. Ruoff, Nano Lett., 2008, 8(10), 3498 CrossRef CAS.
- L. Wei, D. M. Tang, Y. B. He, C. H. You, Z. Q. Shi, X. C. Chen, C. M. Chen, P. X. Hou, C. Liu and Q. H. Yang, ACS Nano, 2009, 3(11), 3730 CrossRef CAS.
- Y. Cao and T. E. Mallouk, Chem. Mater., 2008, 20(16), 5260 CrossRef CAS.
| This journal is © The Royal Society of Chemistry 2010 |
