Size exclusion chromatography of quantum dots by utilizing nanoparticle repelling surface of concentrated polymer brush†
Toshihiko
Arita
*a,
Tomoka
Yoshimura
a and
Tadafumi
Adschiri
b
aInstitute of Multidisciplinary Research for Advanced Materials, Tohoku University, 2-1-1 Katahira, Aobaku, Sendai 980-8577, Japan. E-mail: tarita@tagen.tohoku.ac.jp; Fax: (+81) 22-217-5631; Tel: (+81) 22-217-5630
bWPI Research Center: Advanced Institute for Materials Research, Tohoku University, 2-1-1 Katahira, Aobaku, Sendai 980-8577, Japan
First published on 5th June 2010
Abstract
We have found that the concentrated poly(methyl methacrylate) (PMMA) brush showed the very good nanoparticles (NPs) repellency in its good solvent, e.g. tetrahydrofuran (THF). Whereas the oil- and hydro-phobic (fluorinated), hydrophobic and hydrophilic surfaces adsorbed a lot of NPs. The repellency of NPs did not depend on the surface nature of the NPs. Preparing absorption free columns for size exclusion chromatography (SEC) may enable us to separate quantum dots (QDs) and NPs according to their size. By installing the concentrated PMMA brush into silica monolith columns, we tried to achieve SEC of QDs and NPs. The concentrated PMMA brush immobilized silica monolith columns were prepared by surface initiated atom transfer polymerization of MMA. As a result, we have succeeded in separating QDs according to their size. This SEC system may be advantageous because it can be used in good solvents of the brush regardless of the stability of the surface modifier layer on the NPs.
Introduction
The size and the size distribution of quantum dots (QDs) and nanoparticles (NPs) are the most important factors known to influence physical and chemical properties.1,2 For example, the size of metal NPs determines the wavelength of the surface plasmon of metal NPs and the size of QDs determines the wavelength of emitting light. Recently, we found that the size and size distribution of the surface modified CeO2 NPs may seriously affect their dispersion in solvents.3 Preparing QDs and NPs that have a required size with narrow size distribution may drastically enhance nanotechnology. We have been relying on organic ligand assisted syntheses such as solvothermal,4 sol–gel,5 reverse micelle,6 hot soap methods7 and so on, to prepare those kinds of QDs and NPs.2When one thinks about size separation, size exclusion chromatography (SEC) is definitely one of the most powerful methods. SEC is widely used to separate not only artificial polymers but also bio-compatible compounds. In order to apply SEC to the separation of QDs and NPs, the strong adsorption of NPs to the surfaces due to the very high surface energy density of NPs should be inhibited. There are lots of studies done to separate NPs according to their size by using SEC,8–20 however most systems used in these studies seem to be restricted in combination of the NPs and eluents. A technique should be developed which can inhibit adsorption of NPs onto the surface of the columns.
The surface of swollen concentrated polymer brushes (PBs) has attracted great attention because the surface exhibited a number of interesting phenomena, e.g., quite small friction between them,21 size exclusion effect of the solvent and solute molecules22 and inhibition of protein adsorption.23,24 We focused on the size exclusion and inhibition of adsorption effects among the multimodal interesting properties of the swollen concentrated PBs. The surface of a swollen concentrated PB may repel NPs very well, therefore the SEC of QDs and NPs can be achieved by applying concentrated PB on the surface of a SEC column.
In this study, we propose an application of a concentrated PB immobilized silica monolith column for the size separation of the NPs. We confirmed good NP repellence of a swollen concentrated PB surface and succeeded in separating QDs in accordance with their size by applying the swollen concentrated PB surface to silica monolith columns.
Experimantal
Materials
Methyl methacrylate (MMA, 99%, WAKO) was purified by passing through a column filled with basic Al2O3. Copper chloride (CuCl, WAKO), copper dichloride (CuCl2, WAKO), 4,4′-dinonyl-2,2′-dipyridine (dNbipy, Aldrich) and ATRP initiator; ethyl 2-bromoisobutyrate (EBIB, TCI), were used as received. Silane coupling agents, triethoxysilane, hexyl trimethoxy silane, triethoxy-1H,1H,2H,2H-tridecafluoro-n-octylsilane were purchased from Tokyo Chemical Industry Co., Ltd (TCI). and used as received. The ATRP initiator with silane coupling agent, 2-bromo-2-methyl)propionyloxyhexyl triethoxysilane (BHE), was synthesized according to a method reported elsewhere.25 Tetrahydrofuran (THF, HPLC grade, WAKO) was purchased and used as received for an eluent in size-exclusion chromatography. Methanol (dehydrated grade, WAKO), toluene (99%, WAKO), and hydroquinone (98%, WAKO) were used as received. Cerium hydroxide (Ce(OH)4) and cyclohexane (99%) were obtained from Aldrich, while decanoic acid (99%), hexane (96%), 2-propanol (99%), chloroform (99%), ethanol (99%), acetone (99%) from Wako were used as received. Purified water was purchased from Daiwa Yakuhin was used after filtration. The silica monolith columns with 70 nm mesopore used in this study were all purchased from Kyoto Monotech Co. Ltd. The images of the silica monolith column are depicted in the ESI.† The quantum dots (Qdot® 545 and 705) used in this study were purchased and used after exchanging of the solvent. CeO2 nanoparticles without modification was purchased from C.I Kasei. Co., Ltd., (NanoTek®) and used as received. Ceria nanoparticles with surface modification were synthesized and purified according to the method as reported previously.26 The transmission electron micrographs were taken with a Hitachi H-7650 at an accelerating voltage of 100 kV. The particle sizes were calculated from the average of more than 250 particles using an image analysis software program (SigmaScan Pro4, Jandel Scientific).Surface modification of Si wafers
The positive photoresist (OFPR-800, TOK Co., Ltd.) was spin coated on a Si wafer (4 inch diameter) which has approximately 1 nm thickness of SiO2 layer on the surface, in order to prevent pollution and damage before the wafer was used. The Si wafer was cut into pieces that have 8 × 15 mm size. The Si plates were washed by acetone to peal off the photoresist coatings from the surface and immediately washed with 1% of aqueous basic detergent solution, chloroform and 2-propanol several times using a supersonic washer. After washing, the residual 2-propanol on a Si plate was blown out by N2 flow and put into UV-ozone cleaner for 20 min to remove organics from the surface and the active SiO2 surface of the Si plate. During the UV-ozone cleaning, the silane coupling agent—ethanol solution—was prepared by mixing the following two solutions (solution (a) and (b)). The typical concentrations of the solutions were: (a) 11.84 g of ethanol, 0.5 g of water and 2.0 g of 28 wt% NH3aq; and (b) 11.84 g of ethanol and 0.3 g of a silane coupling agent), and just after the exposure to UV-ozone irradiation, the plates were immersed into the mixed solutions. The immobilization of silane coupling agents was carried out for one day. After the immobilization, the Si plate was washed by ethanol and stored in a dark, dry and cool place.The surface initiated ATRP of MMA was carried out by immersing the BHE immobilized Si wafers into the MMA solution of CuCl (16 mM), dNbipy (33 mM) and EBIB (1.6 mM) in an oxygen- and moisture-free glove box. The ATRP was carried out at 70 °C for 3 h. After polymerization, the Si wafers were washed with chloroform. The obtained free polymer was collected and the molecular weight distribution with GPC was analyzed. The dry thickness of the synthesized PMMA brush was measured by a spectral ellipsometer (Ohtsuka electronics, Co. Ltd., FE-5000S).
Attenuated total reflection Fourier transfer infrared (ATR FTIR) spectrometer (Digilab, FTS-7000) was employed to measure ATR FT-IR spectra of the Si wafers. Contact angles with the Si wafers and water were measured by the contact angle meter (Kyowa interface science, CA-D) and the contact angle listed in this study was the average value taken from at least 10 different places on the substrate.
Adsorption of NPs on the surface modified Si wafers
3 mL of 0.1 wt% of NPs solutions was prepared in small vials and the surface modified Si wafers were immersed into them. The adsorption of the NPs was carried out for 1 h at room temperature with shaking vials. After the adsorption the Si wafers were transferred to new vials and 3 mL of the fresh solvents poured, then the vials were shaken for 5 min. Rinsing of the Si wafer was carried out by repeating the operation 5 times. The NPs adsorbed Si wafers were dried in a vacuum oven maintained at 40 °C for overnight. The extent of the adsorption was measured by a field emission scanning electron microscope (FE-SEM, Hitachi High-Technologies, S-4800).Immobilization of concentrated PMMA brush to the silica monolith columns
The silica monolith columns were connected in parallel and the valves were connected to the both ends of columns, then one side of the valve was connected to a HPLC pump (Jasco, PU-986), then fresh ethanol was flowed at a flow rate of 0.5 mL min−1 for 1 day. The set-up was displayed in the ESI.† The BHE solution which has the same concentration as that for BHE immobilization to Si wafers was prepared and purged with argon. The BHE solution was flowed through the columns at a flow rate of 1 mL min−1 for 5 min and the valves were closed immediately, then kept in the column without flow for 1 day at room temperature. The same procedure was repeated by the reversal flow direction (the inlet and outlet of the columns were reversed) in order to immobilize BHE homogeneously on the surface of the silica monolith columns. The columns were washed with Ar-purged ethanol flow (0.5 mL min−1) for 12 h and Ar-purged toluene flow (0.5 mL min−1) for 12 h. The surface initiated ATRP of MMA was carried out by filling the column with the Ar-purged toluene solution of MMA (4.8 M), CuCl (16 mM), CuCl2 (0.8 mM) dNbipy (35.2 mM) and EBIB (1.6 mM). The ATRP solution was flowed through the columns at a flow rate of 1 mL min−1 for 10 min and the valves were closed immediately. The ATRP was carried out at 60 °C for 3 h. After the polymerization, the ATRP solutions in the columns were collected using toluene flow at a flow rate of 2 ml min−1 for 1 min. The column was washed by elution of THF at a flow rate of 0.5 ml min−1 for 3 days to remove free polymers and impurities. The molecular weight distribution of the obtained free polymer was analyzed using GPC.Size exclusion chromatography of NPs
Two of the concentrated PMMA brush immobilized columns were installed in a simple HPLC system consisting of an HPLC pump (Jasco, PU-986), an injector (20 μL of sample loop was equipped), a column oven (Jasco, CO-2065plus) and a differential refractometer (Jasco, RI-2031plus). All the tubing was done with 1/16 inch PEEK™ tubes. The temperature of the column and the flow rate of the THF were maintained at 45 °C and 1 mL min−1, respectively. The RI signal and the injection signal were simultaneously recorded using a personal computer through a data logger (Keyence, NR-1000).Gel permeation chromatographic (GPC) analysis
GPC analysis was carried out at 35 °C on a JASCO GPC-900 high-speed liquid chromatography system equipped with a guard column (Shodex GPC KF-G), two 30-cm mixed columns (Shodex GPC KF-803L, exclusion limit: 7 × 10⁴ D and KF-805L, exclusion limit: 4 × 10⁶ D), and a differential refractometer. THF was used as an eluent at a flow rate of 1 mL min−1. The GPC system was basically calibrated by PS and PMMA standards (Polymer Standard Service, PSS-Kit, (PS): Mp. 682 − 1.67 × 10⁶ D, (PMMA): Mp. 102 − 9.81 × 10⁵ D).Results and discussion
Nanoparticle repelling surface of concentrated polymer brush in its good solvent
Prior to investigation on the SEC of QDs, we had to confirm the NPs repellency of the swollen concentrated PB. We prepared concentrated PMMA PB modified Si wafers (PMMA brush) by surface initiated atom transfer radical polymerization (ATRP). The graft density of the PMMA brush was calculated from the molecular weight of the free polymer simultaneously synthesized in the ATRP solution and the dry thickness of the PMMA brush measured by ellipsometry. The dry thickness of the PMMA brush was 100 nm. The molecular weight of the PMMA was Mn = 160![[thin space (1/6-em)]](https://www.rsc.org/images/entities/char_2009.gif) 000 g mol−1, with Mw/Mn = 1.19 and the graft density of the PMMA brush was calculated to be 0.50 chains nm−2. The graft density of the PMMA was large enough to be regarded as a concentrated PMMA brush.27,28 The monomer conversion of the polymerization was 27.5%. The calculated Mn value (Mn,theo = 165000 g mol−1) from the conversion was almost identical to the actual Mn value. This means the polymerization actually proceeded as a living radical polymerization. This is important because polymerization should be living radical polymerization, otherwise the concentrated PMMA brush could not be synthesized. In addition, this would be a good scale for surface initiated ATRP from silica monolith columns, since the dry thickness of the PMMA brush immobilized on the surface of columns is not accessible. For the purpose of comparison, we prepared three other kinds of surfaces on Si wafers, SiO2, hexyltrimethoxysilane modified (Hex), and triethoxy-1H,1H,2H,2H-tridecafluoro-n-octylsilane modified (F) Si wafers. For all the surface modified Si wafers were measured the attenuated total reflection Fourier transfer infrared (ATR FTIR) spectra (shown in Fig. 1) and contact angles with water (listed in Fig. 2) in order to confirm successful immobilization of the silane coupling agents.
000 g mol−1, with Mw/Mn = 1.19 and the graft density of the PMMA brush was calculated to be 0.50 chains nm−2. The graft density of the PMMA was large enough to be regarded as a concentrated PMMA brush.27,28 The monomer conversion of the polymerization was 27.5%. The calculated Mn value (Mn,theo = 165000 g mol−1) from the conversion was almost identical to the actual Mn value. This means the polymerization actually proceeded as a living radical polymerization. This is important because polymerization should be living radical polymerization, otherwise the concentrated PMMA brush could not be synthesized. In addition, this would be a good scale for surface initiated ATRP from silica monolith columns, since the dry thickness of the PMMA brush immobilized on the surface of columns is not accessible. For the purpose of comparison, we prepared three other kinds of surfaces on Si wafers, SiO2, hexyltrimethoxysilane modified (Hex), and triethoxy-1H,1H,2H,2H-tridecafluoro-n-octylsilane modified (F) Si wafers. For all the surface modified Si wafers were measured the attenuated total reflection Fourier transfer infrared (ATR FTIR) spectra (shown in Fig. 1) and contact angles with water (listed in Fig. 2) in order to confirm successful immobilization of the silane coupling agents.
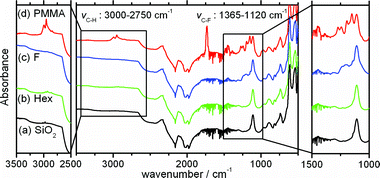 | ||
| Fig. 1 The ATR FTIR spectra of Si wafers, (a) no treatment (SiO2), (b) hexyltrimethoxysilane modified (Hex), (c) triethoxy-1H,1H,2H,2H-tridecafluoro-n-octylsilane modified (F) and (d) concentrated PMMA modified brush. | ||
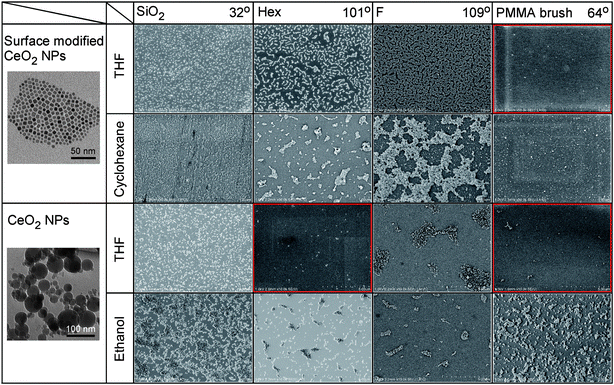 | ||
| Fig. 2 TEM images of the CeO2 NPs used for the adsorption experiment (the first columns) and SEM images of the NPs adsorbed Si wafers. In the top row of the figure, the surface modification added to the Si wafer and the contact angles between the surface and water were shown. The solvent used for the adsorption and rinse of the NPs were also written in the second columns. No or quite small adsorption of NPs was seen in the red framed SEM images. | ||
As we can see in Fig. 1, the spectra of PMMA brush and Hex surfaces have peaks corresponding to C–H stretching mode around 3000–2750 cm−1, the spectrum of the PMMA brush surface also has a peak corresponding to C![[double bond, length as m-dash]](https://www.rsc.org/images/entities/char_e001.gif) O stretching mode at 1700 cm−1 and the spectrum of F surface has a peak corresponding to C–F stretching mode around 1365–1120 cm−1. In addition, the contact angles between water and the surfaces were similar to the values listed in literature.29 The repeatability of the contact angle measurements was very good. The error of the contact angle values for each substrate was smaller than 10%. Consequently, the successful modifications of Si wafers were revealed from the contact angles and the ATR FTIR spectra.
O stretching mode at 1700 cm−1 and the spectrum of F surface has a peak corresponding to C–F stretching mode around 1365–1120 cm−1. In addition, the contact angles between water and the surfaces were similar to the values listed in literature.29 The repeatability of the contact angle measurements was very good. The error of the contact angle values for each substrate was smaller than 10%. Consequently, the successful modifications of Si wafers were revealed from the contact angles and the ATR FTIR spectra.
We investigated the adsorption of the NPs to the surface modified Si wafers by using the surface modified CeO2 NPs28 (HNPs) and unmodified CeO2 NPs (NanoTek®). The solvents used for the adsorption experiment were tetrahydrofuran (THF), ethanol and toluene. A detailed experimental procedure was described in the Experimental section. A scanning electron microscope (SEM) was employed to observe how the NPs were adsorbed on the surfaces. Fig. 2 shows SEM images of the NPs adsorbed substrates.
There was no or little NP that could be found in the SEM images which were in red flames in Fig. 2. In the case of adsorption of the unmodified NPs to the Hex surface in THF, this combination could be a special case to show inhibition of the adsorption of NPs. However, the concentrated PMMA brush in THF, one of the good solvents of PMMA, repelled NPs very well no matter what kind of surface modification was done to the NPs surface. This could be a huge advantage to apply concentrated PBs to the SEC of NPs. Because the SEC system with concentrated PBs only has to take care of eluents, the system can be applied to a lot of combinations of the NPs and solvents systems.
Preparation of the concentrated PMMA brush immobilized columns and SEC system with the columns
After we confirmed swollen concentrated PMMA brush repelled NPs very well, we installed the brush into silica monolith columns. The silica monolith columns used in this study had a length of 130 mm and a diameter of 4.8 mm with 2.18 μm of macropore and 70 nm of mesopore. We immobilized an ATRP initiator on the surface of the silica monolith and grafted PMMA brush by surface initiated ATRP of MMA. The method was explained in the Experimental section. The free polymers synthesized simultaneously in the columns were Mn = 22,000 g mol−1, with Mw/Mn = 1.14. The monomer conversion of the polymerization was 8.7%. The calculated Mn value (Mn,theo = 26100) from the conversion was a little different from the actual Mn value, however the discrepancy was not so large that it could be said the polymerization proceeded as a living radical polymerization. Assuming the graft density of the PMMA brush on the silica monolith was not so different from that on the Si wafers, i.e., the graft density was 0.5 chains nm−2, the dry and swollen thickness of the PMMA brush was calculated as 15 and 22 nm, respectively. This means the mesopore of the concentrated PMMA brush immobilized columns would not be embedded in the good solvent of PMMA.
Two of the concentrated PMMA brush immobilized columns were installed in a simple HPLC system equipped with a refractive index (RI) detector. Before the separation of QDs, the performance of the concentrated PMMA brush immobilized silica monolith column was confirmed by performing the SEC of polystyrene (PS) standards. It is common that a free polymer chain is in random coil form in its good solvents. According to the diameter of the random coil, SECs of polymers are possible. Using the PS coils, we could evaluate the performance of the concentrated PMMA brush immobilized columns. Fig. 3 depicts the elusion time of the PS standards by the concentrated PMMA brush immobilized columns. The best resolution was obtained around the radius of the PS chain from 8.2 to 22 nm (a diameter of 16.4 to 44 nm). We confirmed here the separation of the PS standards was possible using the concentrated PMMA brush immobilized columns.
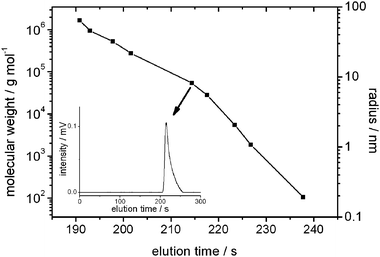 | ||
| Fig. 3 Elution time vs. molecular weight and random coil radius of PS standards in THF. The best separation obtained by the columns was in a radius range from 5.5 to 21.5 nm. The inset depicts an example of the elution curve of the PS standard (Mp = 54000 g mol−1). | ||
The recovering ratio of the QDs and HNPs injected in the SEC system should be measured in advance of the separation. We used the mixture of the HNPs and commercially available QDs (Qdot® 545 and 705) for the SEC. The reason why we mixed the QDs will be explained in the following section. It was to increase the size distribution of the QDs. We prepared a 0.5 wt% solution of the HNPs in THF and injected it into the SEC system. For the QDs, equal portions of the Qdot®s were mixed and the solvent replaced with THF, then 20 μL of the 0.5 wt% of mixed Qdot® solution was injected into the SEC system. Fig. 4(a) depicts chromatogram curves of the HNPs and QDs with and without the columns. The area according to the HNPs and QDs directly reflects the recovering ratio. The recovering ratio of the QDs by the columns was more than 97% and that of the HNPs was more than 95% as shown in Fig. 4(a). This ratio can be a quite high recovering ratio because the system with columns has a longer tube and more connections than that without columns. Only some amounts of HNPs and QDs may be adsorbed to such area. Here, enough inhibition of adsorption of HNPs and QDs by a concentrated PMMA brush on the silica monolith was verified.
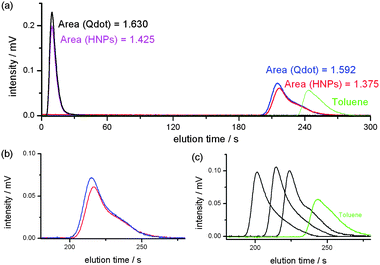 | ||
| Fig. 4 Elution curves of the NPs and PS standards. (a) The mixture of Qdot®s without the columns (black), HNPs without the columns (purple), HNPs with the concentrated PMMA brush immobilized columns (red) and the mixture of Qdot®s with the concentrated PMMA brush immobilized columns (blue). The areas with and without the columns denote that the recovery ratio of the SEC set-up was more than 95%. (b) Enlarged elution curves of the HNPs (red) and the mixture of Qdots (blue). (c) Enlarged elution curves of the PS standards (Mp = 277000 D, 54000 D and 5440 D) and toluene. All elution of NPs and QDs was finished before the elution of toluene. | ||
For comparison, we performed the recovering ratio and separation of the NPs with a commercially available GPC column and a silica monolith column. These columns were installed in the SEC set-up instead of the concentrated PMMA brush immobilized columns and 20 μL of the same NPs solutions (0.5 wt% solution of the HNPs in THF and 0.5 wt% of mixed Qdot® solution) were injected to the SEC system. For all these comparative experiments, we could neither obtain any separation nor sufficient NPs recovery. Because of the strong adsorption of the NPs to the surface of these columns, most NPs were adsorbed on their surfaces. As we expected above, the concentrated PMMA brush immobilized columns were more advantageous than the conventional SEC columns in terms of the NPs repelling surface. The elution curves of NPs with the commercially available columns were shown in the ESI†.
SEC of surface modified CeO2 NPs
The separation of HNPs was examined by transmission electron micrography (TEM). Because separation becomes worse after passing through the optical cell of the RI detector, we prepared the TEM sample by directly receiving an eluted droplet from the columns at the desired elution time by TEM microgrids. The relatively larger volume of the optical cell inhibits the separation by increasing the cross-sectional area of the flow. The elution time for the droplet being picked was previously calculated and determined by comparing the elution curve of the other injection with RI detector (Fig. 4(b)) with the relation between elution time and random coil radii of PS standards in THF shown in Fig. 3. The 1st sampling was determined to be at retention time of 213 s, the 2nd was at retention time of 222 s, and the 3rd was at retention time of 233 s. The TEM images were taken and the average size and size distribution of the NPs found in each image were calculated. As shown in Fig. 5, separation of the HNPs was achieved, however, the separation was not excellent. The size distribution of the HNPs used in this study was very small (avg. d = 6.02 nm with SD = 1.16 nm), in addition, the size of the HNPs was smaller than the area where the concentrated PMMA brush immobilized silica monolith columns showed the best separation so that clear-cut separation might not be obtained for the separation of HNPs.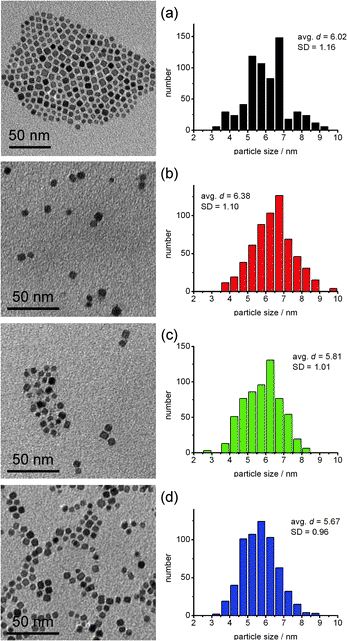 | ||
| Fig. 5 TEM images and a size histogram of HNPs separated by the SEC. (a) NPs before separation, (b) the 1st fraction (retention time: 213 s), (c) the 2nd fraction (retention time: 222 s) and (d) the 3rd fraction (retention time: 233 s). The average sizes and standard deviations of the HNPs were depicted in each histogram. | ||
SEC of QDs
In order to increase the size and size distribution of the NPs, we used a mixture of the commercially available QDs (Qdot® 545 and 705) which was prepared by the above mentioned method. The separation of the QDs by the SEC system was performed and examined using the same method as we applied to the separation of HNPs. The sampling of the elution droplets was carried out at the retention time of 208, 220 and 238 s. The elution times for pickings were calculated by the same method as for HNPs. The average size and size distribution of the NPs in each fraction were counted and calculated from the TEM images.The separation result is shown in Fig. 6. As we can clearly see from Fig. 6, separation of the mixed Qdot®s was successfully done. Here, it can be said that we have succeeded the SEC of QDs that do not have a strongly bound surface modifier on them. The technique introduced in this study might help the size separation and dispersion of NPs, the next target would be the size separation of unmodified NPs (from the powder) and NPs which have broader size distributions, e.g. NPs which includes 10 to 100 nm diameters of NPs (it was difficult to separate because of poor dispersity of the NPs.).
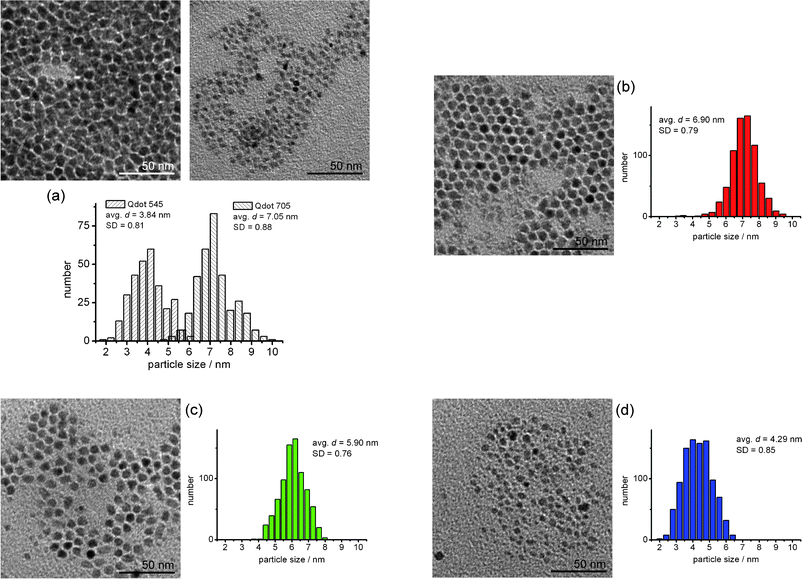 | ||
| Fig. 6 TEM images and size histogram of Qdot®s separated by the SEC, (a) before separation, (b) the 1st fraction (retention time: 208 s), (c) the 2nd fraction (retention time: 220 s) and (d) the 3rd fraction (retention time: 238 s). The average sizes and standard deviations of the Qdot®s were depicted in each histogram. | ||
Conclusion
We found that the swollen concentrated PMMA brush repelled NPs very well. In addition, we developed a SEC system for QDs by applying NPs repelling surface of the concentrated PMMA brush onto a silica monolith column. The method developed in this study can be applied to a wide variety of QDs, NPs and solvent systems because the essential qualification of the system is only usage of a good solvent of the concentrated polymer brush immobilized on the column. In addition, scaling up the size of the column will enable us to separate a large amount of QDs and NPs at once.Acknowledgements
This work was supported by a Scientific Research Grant from the Ministry of Education, Science, Sports, and Culture of Japan. This research was also partly supported by New Energy and Industrial Technology Development Organization Japan (NEDO). The author (T. Arita) thanks Grant-in-Aid for Young Scientists (B) No. 19750094 for their financial support.Notes and references
- V. I. Klimov, Semiconductor and Metal Nanocrystals: Synthesis and Electronic and Optical Properties, Marcel Dekker Inc., 2003 Search PubMed.
- Nanoparticles, ed. G. Schmid, Wiley-VCH, Weinheim, 2004 Search PubMed.
- T. Arita, J. Yoo, Y. Ueda and T. Adschiri, Nanoscale, 2010, 2, 689–693 RSC.
- M. Yoshimura, W. L. Suchanek and K. Byrappa, MRS Bull., 2000, 25, 17–25 CAS.
- V. Kessler, J. Sol-Gel Sci. Technol., 2009, 51, 264–271 CrossRef CAS.
- M. M. Husein and N. N. Nassar, Curr. Nanosci., 2008, 4, 370–380 Search PubMed.
- M. Delalande, P. R. Marcoux, P. Reiss and Y. Samson, J. Mater. Chem., 2007, 17, 1579–1588 RSC.
- A. M. Al-Somali, K. M. Krueger, J. C. Falkner and V. L. Colvin, Anal. Chem., 2004, 76, 5903–5910 CrossRef CAS.
- C.-H. Fischer and T. Siebrands, J. Chromatogr., A, 1995, 707, 189–197 CrossRef CAS.
- Z. Aspanut, T. Yamada, L. Lim and T. Takeuchi, Anal. Bioanal. Chem., 2008, 391, 353–359 CrossRef CAS.
- P. Huve, T. Verrecchia, D. Bazile, C. Vauthier and P. Couvreur, J. Chromatogr., A, 1994, 675, 129–139 CrossRef CAS.
- F.-K. Liu, Chromatographia, 2007, 66, 791–796 CrossRef CAS.
- F.-K. Liu, Chromatographia, 2008, 68, 81–87 CrossRef CAS.
- F.-K. Liu and G.-T. Wei, Chromatographia, 2004, 59, S115–119 CrossRef.
- M. B. F. Martins, A. Supico, S. I. D. Sims, R. Gaspar and M. E. M. Cruz, J. Pharm. Biomed. Anal., 1997, 15, 811–818 CrossRef CAS.
- H. Murayama, T. Narushima, Y. Negishi and T. Tsukuda, J. Phys. Chem. B, 2004, 108, 3496–3503 CrossRef CAS.
- R. A. Sperling, T. Liedl, S. Duhr, S. Kudera, M. Zanella, C. A. J. Lin, W. H. Chang, D. Braun and W. J. Parak, J. Phys. Chem. C, 2007, 111, 11552–11559 CrossRef CAS.
- T. Yamaguchi and K. Okuyama, Part. Part. Syst. Charact., 2007, 24, 424–430 CrossRef CAS.
- M. Wang, T. E. Dykstra, X. Lou, M. R. Salvador, G. D. Scholes and M. A. Winnik, Angew. Chem., Int. Ed., 2006, 45, 2221–2224 CrossRef CAS.
- G.-T. Wei and F.-K. Liu, J. Chromatogr., A, 1999, 836, 253–260 CrossRef CAS.
- Y. Tsujii, A. Nomura, K. Okayasu, W. Gao, K. Ohno and T. Fukuda, J. Phys. Conf. Ser., 2009, 184, 012031 CrossRef.
- C. Yoshikawa, A. Goto, Y. Tsujii, T. Fukuda, T. Kimura, K. Yamamoto and A. Kishida, Macromolecules, 2006, 39, 2284–2290 CrossRef CAS.
- M. Ignatova, S. Voccia, B. Gilbert, N. Markova, D. Cossement, R. Gouttebaron, R. Jerome and C. Jerome, Langmuir, 2006, 22, 255–262 CrossRef CAS.
- C. Yoshikawa, A. Goto, Y. Tsujii, N. Ishizuka, K. Nakanishi and T. Fukuda, J. Polym. Sci., Part A: Polym. Chem., 2007, 45, 4795–4803 CrossRef CAS.
- K. Ohno, T. Morinaga, K. Koh, Y. Tsujii and T. Fukuda, Macromolecules, 2005, 38, 2137–2142 CrossRef CAS.
- T. Arita, J. Yoo and T. Adschiri, J. Nanopart. Res., 2009 DOI:10.1007/s11051-009-9826-4.
- T. Arita, K. Ohno, Y. Tsujii and T. Fukuda, Polym. Preprints, Jpn, 2006, 55, 3489 Search PubMed.
- Y. Tsujii, K. Ohno, S. Yamamoto, A. Goto and T. Fukuda, Adv. Polym. Sci., 2006, 197, 1–45 CAS.
- Contact Angle, Wettability and Adhesion, ed. K. L. Mittal, Brill Academic Publishers, Leiden, 2009 Search PubMed.
Footnote |
| † Electronic supplementary information (ESI) available: Setup for SEC of NPs, images of the columns and separation results using commercially available SEC columns. Those items are available on the WWW or from the author. See DOI: 10.1039/c0nr00157k |
| This journal is © The Royal Society of Chemistry 2010 |