Study of concentration-dependent cobalt ion doping of TiO2 and TiO2−xNx at the nanoscale
James L.
Gole
*a,
Sharka M.
Prokes
*b,
O. J.
Glembocki
c,
Junwei
Wang
d,
Xiaofeng
Qiu
d and
Clemens
Burda
*d
aSchools of Physics and Mechanical Engineering, Georgia Institute of Technology, 837 State Street, NW, Atlanta, GA 30332-0430, USA. E-mail: jim.gole@physics.gatech.edu
bCode 6876, NRL, Washington, DC 20375, USA. E-mail: prokes@estd.nrl.navy.mil
cCode 6880.1, NRL, Washington, DC 20375, USA. E-mail: glembocki@bloch.nrl.navy.mil
dChemistry Department, Case Western Reserve University, Cleveland, OH 44106, USA. E-mail: burda@case.edu
First published on 21st May 2010
Abstract
Experiments with a porous sol–gel generated TiO2 nanocolloid and its corresponding oxynitride TiO2−xNx are carried out to evaluate those transformations which accompany additional doping with transition metals. In this study, doping with cobalt (CoII) ions is evaluated using a combination of core level and VB-photoelectron and optical spectroscopy, complementing data obtained from Raman spectroscopy. Raman spectroscopy suggests that cobalt doping of porous sol–gel generated anatase TiO2 and nitridated TiO2−xNx introduces a spinel-like structure into the TiO2 and TiO2−xNx lattices. TEM and XPS data complemented by valence band-photoelectron spectra demonstrate that metallic cobalt clusters are not formed even at high doping levels. As evidenced by Raman spectroscopy, the creation of a spinel-like structure is commensurate with the room temperature conversion of the oxide and its oxynitride from the anatase to the rutile form. The onset of this kinetically driven process correlates with the formation of spinel sites within the TiO2 and TiO2−xNx particles. Despite their visible light absorption, the photocatalytic activity of these cobalt seeded systems is diminished relative to the oxynitride TiO2−xNx.
1. Introduction
Nanoscale titania and its oxynitride (TiO2−xNx) have attracted considerable attention due to the changes in their molecular electronic structure and the increase in surface/volume ratio at the nanoscale associated with heightened reactivity.1–11 Nanostructured titanium dioxides have been widely used as photovoltaics, electrochromics, sensors, and photocatalysts.12–18 Furthermore, recent studies4,8,13,16,17,19,20 for sol–gel generated TiO2 of average particle size 10 nm8,19,20 suggest the importance of structural porosity as it influences and enhances the rate and efficiency of the doping processes. It has been demonstrated that the introduction of small concentrations (less than 1%) of transition metal ions can be used to enhance the catalytic activity of TiO2.13,17 This effect has been associated with a modification of the TiO2 band gap. However, changes in morphology and redox potentials may also be affected at higher doping concentrations.Here, we expand our studies on porous sol–gel generated TiO2 nanocolloids and their corresponding oxynitrides, TiO2−xNx to evaluate the cumulative effects of higher concentration cobalt (CoII) ion doping. Combinations of core level, valence band photoelectron, and reflectance spectroscopies are correlated with Raman spectroscopy to demonstrate that porous sol–gel generated anatase TiO2 and TiO2−xNx can be simultaneously doped with cobalt (CoII) ions to introduce a spinel-like structure into these lattices that is commensurate with a decrease in metal–oxygen binding energy relative to TiO2 and the oxynitride. Further, the conversion of both the oxide and its oxynitride from the anatase to the rutile phase occurs at room temperature. TEM, Raman, and VB-photoelectron spectra demonstrate that cobalt cluster formation is negligible even at seeding levels exceeding 25 wt% cobalt. The photocatalytic activity of these systems has also been studied and, despite strong visible light absorption, we find weaker visible-light reactivity relative to the TiO2−xNx based systems.
2. Materials and methods
TiO2 and TiO2−xNx nanocolloids were prepared at room temperature using a previously published synthesis.8,19,20 In all cases the preparation of the porous TiO2 nanocolloid was done under nitrogen using the 2-propanol/Ti[OCH(CH3)2]4–acetic acid/doubly deionized water synthesis combination. The average particle size of the present nanocolloids is 10–20 nm. The oxynitride samples were prepared using triethylamine (TEA) as nitrogen source for the nitridation of the TiO2.8,19,20 CoII ions were introduced using the direct seeding of cobalt chloride hexahydrate at room temperature during the nanoparticle synthesis.X-Ray photoelectron spectroscopy (PHI, ESCA-5600, Al Kα X-ray source, step size: 0.4 eV) was used to characterize both the core level and valence band (VB) electronic structures of the nitrogen doped and cobalt doped TiO2 nanoparticles. Spectra were collected under ultrahigh vacuum (5 × 10⁻⁸ Pa) without further cleaning steps since Ar-ion sputtering or high temperature ramping can cause undesirable changes including the reduction or oxidation of the sample as well as changes in the composition of the nanoparticles.21 The reported binding energies were calibrated with respect to the carbon 1s core level energy centered at 284.6 eV.
The XPS data are correlated with recently obtained µ-Raman results obtained using a Mitutoyo Microscope and a SPEX Triplemate Spectrometer equipped with a CCD.22 The minimum Raman shift of this spectrometer is 200 cm−1 (anatase band of TiO2 at 144 cm−1 is not observed). The 514.5 nm line of an Ar ion laser was used as the excitation source. The microscope is equipped with 10×, 50×, and 100× objectives for focusing the laser light, coupled to the spectrometer through a fiber optic bundle. The spot size was kept on the order of 100 µm in order to reduce the power density. The light from the microscope was filtered by a 514.4 nm notch filter. The positions of the Raman lines in a given spectrum were calibrated against the 546.0 nm emission line from a fluorescent light source. Comparisons of this approach to XRD analysis are considered in detail elsewhere.22,23
Transmission electron microscopy (TEM) analysis was performed at 100 kV using a JEOL 100C TEM and 200 kV using a Hitachi HT-2000 TEM.
Reflectance spectra were measured on a Cary 50 UV-visible spectrometer with a reflectance Barrelino attachment. Photocatalytic measurements are carried out in a self-built reactor that was recently published.24 All measurements were carried out at room temperature.
3. Results
3.1 Cobalt seeding of TiO2 and TiO2−xNx nanocolloids
Porous TiO2 and TiO2−xNx nanocolloids were seeded with cobalt (CoII) ions, introduced as the chloride. The prepared sols were subsequently dried in vacuum (≤10−2 Torr). The CoCl2 used in this study forms hexahydrate coordination complexes which are pink in color. However, after vacuum drying on TiO2 (≤3 h), the resulting material is deep blue, corresponding closely to the anhydrous cobalt ions, and remains this color for several months under dry atmosphere. In contrast, the complexes remain deep purple (dihydrate) after vacuum drying for 12–24 hour periods and readily convert back to the hexahydrate in air. The weight percent of CoII (Table 1) introduced to the titanium-based systems exceeds that of previous workers and ranges from 2 to 27% by weight. The wt% of CoII ion in Table 1 is calculated for seeding both with CoCl2·6H2O and Co(NO3)2·6H2O into a prescribed concentration of TiO2 nanocolloid solution. Column 1 in Table 1 provides the mass of hexahydrate disposed to a 5 ml solution of the TiO2 nanocolloid which contains 134 mg of the nanocolloid. This is converted in columns 2 and 3 to a weight percent of cobalt ions.3.2 Outline of Raman spectroscopy for CoII seeded TiO2 and TiO2−xNx nanocolloids
The TiO2 nanocolloids, TiO2−xNx nanocolloids, and CoII doped TiO2 and TiO2−xNx have been examined using Raman spectroscopy. This work is outlined briefly and has been discussed in detail elsewhere.22 The spectra of untreated TiO2 powders consist only of the anatase crystal phase as identified by the three Raman lines at 400 cm−1, 515 cm−1, and 635 cm−1.22,25The Raman spectrum of the triethylamine treated porous TiO2 nanocolloid demonstrates broad peaks also corresponding to the anatase crystal structure. However, an additional feature appears at 550 cm−1 (ref. 8,19,20,22 and 25) that has been attributed to the presence of non-stoichiometric titanium oxynitride.20,21,25,26 The Raman spectra22 obtained on treatment of the porous TiO2 and TiO2−xNx nanocolloids with the CoII ion are outlined, in part, in Fig. 1 and 2. An intense Raman signal is obtained for the CoCl2 treated TiO2 nanocolloid which decreases as a function of increasing CoII concentration, as the 440 cm−1 band red shifts and the seeded nanocolloid transforms to an amorphous structure.22
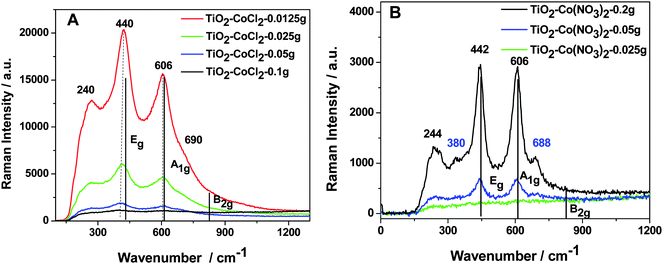 | ||
| Fig. 1 Raman spectra for a TiO2 nanocolloid (<10 nm) prepared with various concentrations of CoII using (A) CoCl2 and (B) Co(NO3)2 at room temperature. The Raman signal was obtained using a 1 µm spot size and a power of 25 mW or less.19,22 The typical phonon modes of rutile TiO2 are indicted by solid vertical lines. | ||
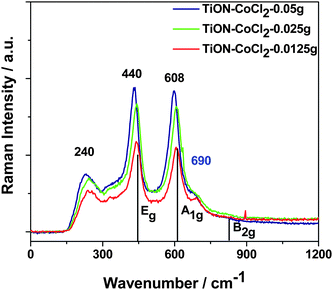 | ||
| Fig. 2 Raman spectra of TiO2−xNx nanocolloid with various CoII concentrations. Laser power is less than 10 mW.22 All three samples exhibit characteristic rutile TiO2 peaks and the intensities of the peaks increase with CoII concentration. | ||
The Raman signal observed for the Co(NO3)2 treated TiO2 nanocolloid is weaker, but increases with increasing CoII concentration. Similar results are also obtained for the CoCl2 doping of the nitrided, TiO2−xNx nanocolloid depicted in Fig. 2. The Raman signal strength again increases with increased CoII concentration, similar to the results obtained for Co(NO3)2 seeding, however, the observed spectra correspond to lower cobalt ion concentrations. Further the increase in the intensity of the Raman spectra does not increase linearly with the Co concentration, damping at higher seeding levels.
An unexpected and significant result is obtained from these Raman studies as we compare the observed features for the anatase TiO2 nanocolloid with those features that characterize the CoII systems in Figs. 1 and 2. Although the initial TiO2 and TiO2−xNx nanocolloids consist exclusively of the anatase crystal structure,8,19,20 the CoII doped systems have transformed almost completely at room temperature, exhibiting the more stable rutile structure21,22,25 with phonon bands at ∼235 cm−1, 440 cm−1, and 605 cm−1.27 This structural transformation is not unique to doping with the CoII ion, as preliminary results suggest a similar, albeit less pronounced, change for NiII (NiCl2) doped TiO2 nanocolloids.22
The lines at approximately 380 and 690 cm−1 do not correspond to a structural phase of TiO2. However, it has been reported previously that the phonon modes of spinel (Co3O4), which are associated with tetrahedral CoII sites result in a 383 cm−1 line,21 while the A1g phonon mode of spinel has been reported at 691 cm−1.28 Thus, these phonon modes result from CoO sites in the TiO2 lattice,22 similar to those sites in Co3O4, formed during the metal ion seeding of the solution phase TiO2 nanocolloids. The red shift of the 440 cm−1 Raman line noted in Fig. 1(A) is consistent with the growth of the spinel phase with increasing Co content and the reduction of the TiO2 rutile fraction. The sensitivity of the Raman technique reveals this spinel formation.
The Raman studies have been assessed to evaluate the potential laser induced transformation of anatase to rutile TiO2. The Raman system was therefore operated at extremely low laser powers.22 The CoCl2/TiO2 spectra (Fig. 1(A)) signal a direct room temperature transformation from anatase to rutile TiO2 and the CoCl2/TiO2−xNx spectra result, at most, in minor part, from a laser induced surface transformation. The apparent facile in situ cobalt induced phase transformation at room temperature certainly is surprising as the stoichiometric conversion of anatase to rutile TiO2 requires up to 12 hours at 850 °C.26,27 This is different from more recently reported doping studies at low Co concentrations.29
3.3 Core level and valence band XPS studies
Core level XPS studies elucidate the chemical environment of the different elements in the doped nanoparticles.30 When the TiO2−xNx is formed via the nitridation of a TiO2 nanocolloid, the N 1s and Ti 2p core levels are the most important energy regions to be investigated for incorporation of nitrogen into the TiO2 lattice and the O 1s core level locations can play an important confirmatory role. Based on a previous study8,19,20 of these core levels for vacuum dried nitrogen doped titania nanoparticles, we have established the formation of NO sites, characterized by an N 1s binding energy peak centered at 401.3 eV (extending from 397.4 to 403.7 eV). While core level XPS studies provide information on changes in the most tightly bound orbitals of a nitrogen doped and Co ion seeded TiO2 matrix, an evaluation of the VB structure tuning that accompanies the CoII seeding of TiO2 and TiO2−xNx in concert with N doping can be obtained from VB XPS spectra.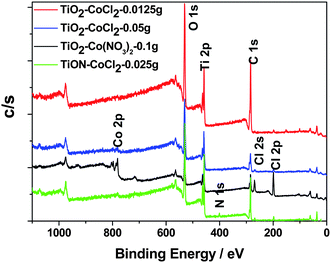 | ||
| Fig. 3 Overall core level XPS spectra for selected samples as indicated in the figure. | ||
We have examined, in more detail, four areas of these core level XPS spectra, the Ti 2p region near 460 eV, the O 1s region near 530 eV, the N 1s region near 400 eV, and the CoII region near 780 eV. There are distinct differences between the binding energies associated with the three CoII seeded systems, corresponding primarily to a lowering of the binding energies in the TiO2 lattice, which the Raman data suggest results from the introduction of the CoII ion. The formation of a spinel-like structure is manifested by the red shift corresponding to the 440 cm−1 Raman line in Fig. 1(A), and the growth of the 383 cm−1 line (Figs. 1 and 2) associated with the cobalt oxide spinel.
The Ti 2p region (Fig. 4) for the CoII–TiO2 system, whose Raman spectra correspond to those in Fig. 1, demonstrates a red shift with increasing cobalt ion concentration. This shift extends from a Ti(+4) binding energy close to that measured for the TiO2 nanocolloid (458.8 eV)8,19,20 at the lowest concentrations, to a value close to 458.3 eV as the CoII concentration is increased by a factor of eight. The shift is consistent with that which should accompany the formation of the cobalt oxides in the TiO2 lattice and parallels the conversion of anatase to rutile TiO2.31 The Raman spectra demonstrate that this conversion is well on its way even at the lowest cobalt concentrations. The observed incorporation of Co and the appearance of spinel-like structure in the Raman spectrum for the seeded TiO2 lattice suggest that the XPS spectrum might also signal the transfer of charge from CoII to TiIV, at increased CoII concentration, and the subsequent partial formation of CoIII and TiIII.
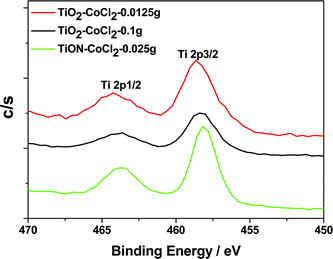 | ||
| Fig. 4 Ti 2p XPS peaks for the CoCl2/TiO2 and CoCl2/TiON systems. | ||
The XPS spectra for the cobalt doped TiO2−xNx nanocolloid show a peak near 458.1 eV for the Ti 2p3/2 binding energy, a weaker BE relative to that of the TiO2 nanocolloid (458.6 eV).8,20 The corresponding N 1s spectra of CoCl2–TiO2−xNx are depicted in Fig. 5. As expected, no N 1s XPS spectra are observed for the CoCl2 seeded TiO2 nanocolloid. The XPS spectrum for the cobalt seeded TiO2−xNx nanocolloid also displays a peak at ∼401.3 eV, due to nitric oxide (NO).8,20 The typical binding energy for TiN is 397.2 eV32,33 and Fig. 5 demonstrates that neither TiN nor CoN has been formed.
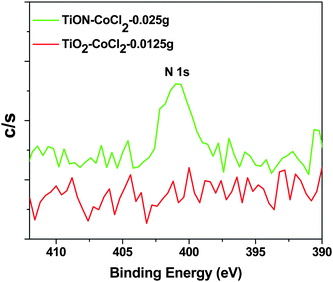 | ||
| Fig. 5 N 1s XPS spectra for CoCl2 seeded TiO2 and TiO2−xNx. | ||
Rodriguez et al.31,34 have carried out an XPS analysis of the interaction of NO2 with several polycrystalline surfaces, observing a peak which they assign to NO2 at 404.5 eV,35,36 and to absorbed NO at 400–401.5 eV.34,35 They also assign the 401 eV feature to NO.8,20 Similar N 1s features are observed when the TiO2 nanocolloid is seeded with Pd(NO3)2 to increase nitrogen uptake.8,19,20
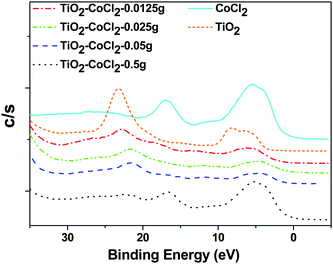 | ||
| Fig. 6 VB-XPS of TiO2 with different CoCl2 loadings. For comparison, the VB-XPS spectra of TiO2 and CoCl2 are also shown. | ||
The data in Fig. 6, in conjunction with the Raman spectra, suggest the formation of CoIII-oxide as well as CoII-oxide bonds commensurate with the formation of the cobalt oxide spinel. It is apparent that the porous nature of the nanocolloids allows the highly efficient diffusion of the metal ion seed to the TiO2 and TiO2−xNx lattice sites. At the highest CoCl2 concentration a peak at ∼17 eV occurs, consistent with a partially substituted cobalt oxide within the TiO2 lattice. This feature, albeit slightly red shifted, is apparent in the spectrum for CoCl2 and may suggest the formation of an oxychloride. These data suggest that it is not surprising that the Raman spectra for the TiO2/CoCl2 system (Fig. 1(A)) quench readily as a function of increased concentration as both the titanium oxide is weakened by substitution and the increased CoII seeding also perturbs the titanium dioxide crystal structure sufficiently to reduce it to a nearly amorphous state (Fig. 1(A)).
Fig. 7 outlines the observed VB XPS spectra for the CoCl2 seeded TiO2−xNx nanocolloid. Here, the peak of the O 2s spectrum again shifts to a lower ∼21 eV (vs. ∼22 eV binding energy associated exclusively with the TiO2 nanocolloid). The O 2p region also demonstrates a lower peak binding energy, close to 5 eV. While we suggest that these decreases in binding energy are likely due to the Co replacement of Ti, they can also be associated with N 2s-O 2s and N 2p-O 2p orbital mixing catalyzed by the introduction of cobalt.
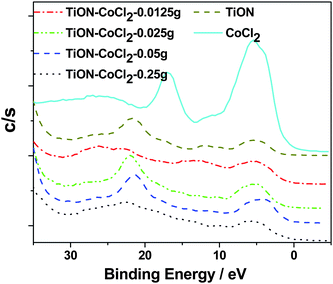 | ||
| Fig. 7 Room temperature VB XPS spectra of the CoCl2/TiO2−xNx system with increased CoII concentration. For comparison, the same spectra of TiO2−xNx and CoCl2 are also included. | ||
At the lowest CoII concentrations for this study (compare with Table 1) we observe a very significant broadening of the O 2s region such that the peak apparent for the oxynitride as well as the peaks observed in the TiO2/CoCl2 system are strongly broadened and reduced. With increased CoII seeding, however, more clearly defined binding energy regions appear that correspond to the cobalt oxide. These regions, while at first slightly blue shifted relative to the oxynitride, subsequently transition to a comparable O 2s BE. Based on the oxynitride VB XPS spectrum, it seems clear that the combination of CoII ions interacting with the oxynitride catalyzes this interaction. While the core level XPS spectra suggest that the oxynitride dominates the observed O 1s feature observed for this system, it seems apparent that the presence of CoII catalyzes the broadening and signals a strong synergistic interaction between CoII and the oxynitride that influences the nature of the observed Raman22 and enhanced infrared spectra.39 At the highest CoII concentrations (0.25 g) there is a considerably increased spectral broadening extending to the region between 15 and 12 eV. This is accompanied by a considerable lowering of the O 2p binding energy (to ∼4 eV) to a level well below that of the oxynitride. For both the native oxynitride and the cobalt seeded systems, these features may result, in part, from the formation of NO sites in this region.40
The TEM images presented in Fig. 8 indicate the cobalt seeded TiO2 and TiO2−xNx systems. The titania and titanium oxynitride particles are of average size 10 nm in these figures and the cobalt chloride molecules are intermingled among these nanoparticles.
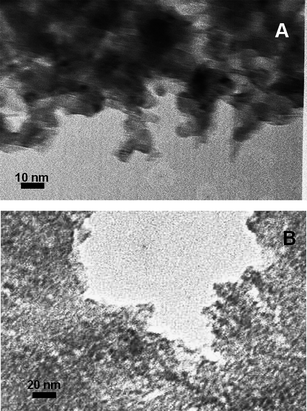 | ||
| Fig. 8 TEM images of (A) CoCl2/TiO2−xNx and (B) CoCl2/TiO2. | ||
The UV-Vis diffuse reflectance spectra of the cobalt doped TiO2 and TiON nanoparticles are shown in Fig. 9. In comparison with P25, the commercially available TiO2, these doped samples absorb significantly in the visible-light region, which should be ascribed mostly to the existence of cobalt. However, the features of these cobalt absorptions are relatively weaker in the TiON matrix than those in TiO2.
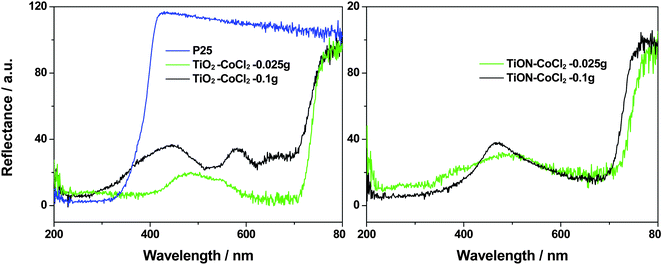 | ||
| Fig. 9 Reflectance spectra of P25, cobalt doped TiO2 and TiON nanoparticles with varying CoII content as indicated in the legend. Comparing to P25, the cobalt doped samples, even with a CoCl2 content as low as 0.025 g, exhibit a sharp difference in the visible-light region. The features associated with Co are more damped in the TiON matrix than those in the TiO2 matrix. The measurements are done relative to MgO, which explains the >100% reflectance of pure P25 TiO2. | ||
Shown in Fig. 10 is the photocatalysis performance of the as-prepared nanoparticles. Although the Co-doped samples exhibit great absorption in the visible-light region, their photocatalytic activity is not as high as that of the TiON sample.
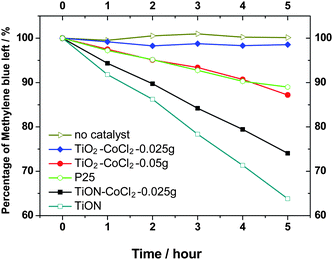 | ||
| Fig. 10 Photodecomposition of methylene blue under visible light (>400 nm) illumination with various photocatalysts. | ||
4. Discussion
The TiO2 and TiO2−xNx nanocolloids used in this study have been characterized previously using X-ray powder diffraction (XRD) techniques which, based on the Debye–Scherrer equation8,19,20 suggest that they have average diameters of 10 nm.8 Broadened but regular XRD patterns are readily obtained for the anatase structured nanocolloids.8,19,20 However, we have recently noted22,23 that it is difficult to obtain a room temperature Raman spectrum for these small nanocolloids without the sophisticated collection optics used in the present study,8,19,20,22 discussing the advantages and disadvantages of Raman and XRD characterization at the nanometer scale.22,23In a system heated to elevated temperatures or a system in which doping is used to obtain the anatase to rutile phase transformation, the introduction of crystalline disordering with even moderate doping levels or increasing temperature can lead to significant broadening associated with disorder in the XRD spectrum. This renders mute the use of the Debye–Scherrer equation to evaluate crystallite size and a clear phase structure. The results which we have outlined previously22,23 point to the difficulty of using XRD to characterize extremely small structures when a phase transformation and dopant seeding, in combination, are involved. However, in the application of Raman scattering, the two phases of TiO2 and its oxynitride have very distinct, widely spaced, fundamental frequencies as is also the case for the cobalt based spinel. This allows for the identification of the specific constituents and phases present in the various samples, and is the driving force for the correlations of the XPS and Raman data that we have made in this study.
While the role of dopants introduced into the TiO2 lattice is controversial,41–44 the present study demonstrates that the cobalt cation, when introduced as a dopant, can induce a significant transformation of anatase to rutile TiO2 at room temperature. The Raman spectra depicted in Figs. 1 and 2 demonstrate a range of completeness for this transformation. The conversion of the 634 cm−1 stretch mode of anatase TiO2 to the 608 cm−1 stretch mode of rutile TiO2 is readily completed and, we find little evidence for the broadening that might be expected to accompany a soft mode transformation.
Although the anatase phase of TiO2 can be readily produced at the 10 nm scale using sol–gel techniques,8,19,20 it is metastable with respect to the rutile phase. Furthermore, the anatase phase reverts to the rutile phase at temperatures above 915 °C,45 although the process is kinetically unfavorable at low temperatures. The transformation process, partially kinetically driven, can onset at temperatures between 700 °C and 800 °C.23 Navrotsky and Kleppa45 determined a negative enthalpy change for the anatase to rutile transformation, reporting that anatase is metastable with respect to rutile under all conditions of temperature and pressure. The JANAF Tables46 demonstrate that the free energy of formation of rutile is always less than anatase making it the more stable structure. These factors, and the need to produce structures for the rutile phase of TiO2 which are comparable to those obtained for the sol–gel generated anatase phase suggest the importance of the cobalt ion dopant for the anatase to rutile conversion. The very small difference in the free energies of anatase and rutile TiO2 is the primary reason for their slow thermodynamic transformation. The introduction of cobalt ions would appear to drive the conversion, possibly by a catalyzed process. The modeling of this process will require considerable further study.
The Raman spectra in Fig. 2 show a virtually complete anatase to rutile transformation. A red shift associated with increasing CoII content for only the 440 cm−1 band, is accompanied by the growth of the spinel phase (modes at 383 cm−1 and 690 cm−1). As more of the spinel phase forms, there is a decrease in the intensity of the 606 cm−1 line, associated with the A1g mode of the TiO2 rutile lattice. The conversion to rutile is consistent with the formation of the spinel structure within the TiO2 matrix, and the clear indication of a lowering of the O 2p and O 2s binding energies. By comparison, the transformation is clear but notably less effective in the NiII system and virtually absent in the CuII system22 but comparable in the higher spin FeII system. Clearly, the exact mechanics of these systems merits further study.
The evidence for an anatase-to-rutile conversion at the lowest Co concentrations may have exciting consequences. Hurum et al.47 suggest that one can create a material of enhanced photocatalytic activity by controlling the degree of anatase to rutile transformation so as to form anatase/rutile interface regions.22,23 The assessment of this exciting possibility for the cobalt ion seeded systems will, however, require further kinetic in situ Raman, XPS, and EPR spectroscopic studies. However, initial studies suggest that the photo-catalytic efficiency of these systems does not approach that of the oxynitride, which may be due to increased charge recombination at the metal centers or the phase transformation from anatase to rutile.
By comparison, the formation of the oxynitride enhances the Raman spectrum. At the lowest concentrations of CoII in the CoCl2/TiO2−xNx system, the spinel seeded rutile spectrum is clearly observable, and the spinel signal increases with decreasing Co content, which leads to a stronger rutile signal.
5. Conclusion
It is apparent that the introduction of CoII into either TiO2 or TiO2−xNx considerably lowers the activation energy for the anatase to rutile phase conversion. Based on simple considerations, the activation energy of the reaction may be lowered by as much as a factor of four. It is also important to note that we are operating at much higher cobalt ion seeding levels than have typically been employed in these experiments. It is not surprising that the cobalt ions have a significant influence on the electronic structure of the titania, leading to visible light absorbance and to the formation of cobalt oxide sites with a concomitant lowering of the binding energy versus the titanium oxides and oxynitrides. The conduction band edges of titania are clearly affected by the presence of cobalt ions. Although the inherent visible light absorbance does not lead to a visible light absorbing photocatalyst comparable to the oxynitride, it is clear that catalysis has occurred, which suggests that the quenching of catalytic effects at low metal doping concentrations may be countered. Based on the Raman, TEM, and VB photoelectron data, it appears that the N-doped TiO2 nanoparticles are more efficient at taking up cobalt ions. We have also found no evidence for the formation of cobalt cluster sites even at the high seeding levels used in these experiments.References
- A. Fujishima and K. Honda, Nature, 1972, 238, 37–38 CAS.
- R. Asahi, T. Morikawa, T. Ohwaki, K. Aoki and Y. Taga, Science, 2001, 293, 269–271 CrossRef CAS.
- J. L. Gole and M. G. White, J. Catal., 2001, 204, 249–252 CrossRef CAS.
- C. Burda, Y. B. Lou, X. B. Chen, A. C. S. Samia, J. Stout and J. L. Gole, Nano Lett., 2003, 3, 1049–1051 CrossRef CAS.
- J. L. Gole, B. D. Shinall, A. V. Iretskii, M. G. White, W. B. Carter and A. S. Erickson, ChemPhysChem, 2003, 4, 1016–1021 CrossRef CAS.
- X. B. Chen and C. Burda, J. Phys. Chem. B, 2004, 108, 15446–15449 CrossRef CAS.
- C. Burda, X. B. Chen, R. Narayanan and M. A. El-Sayed, Chem. Rev., 2005, 105, 1025–1102 CrossRef CAS.
- X. B. Chen, Y. B. Lou, A. C. S. Samia, C. Burda and J. L. Gole, Adv. Funct. Mater., 2005, 15, 41–49 CrossRef CAS.
- Y. Liu, X. Chen, J. Li and C. Burda, Chemosphere, 2005, 61, 11–18 CrossRef CAS.
- X. F. Qiu and C. Burda, Chem. Phys., 2007, 339, 1–10 CrossRef CAS.
- X. B. Chen and C. Burda, J. Am. Chem. Soc., 2008, 130, 5018–5019 CrossRef CAS.
- M. R. Hoffmann, S. T. Martin, W. Y. Choi and D. W. Bahnemann, Chem. Rev., 1995, 95, 69–96 CrossRef CAS.
- M. Anpo, H. Yamashita, Y. Ichihashi, Y. Fujii and M. Honda, J. Phys. Chem. B, 1997, 101, 2632–2636 CrossRef CAS.
- A. Mills and S. LeHunte, J. Photochem. Photobiol., A, 1997, 108, 1–35 CrossRef CAS.
- M. Gratzel, Nature, 2001, 414, 338–344 CrossRef CAS.
- S. Kumar, A. G. Fedorov and J. L. Gole, Appl. Catal., B, 2005, 57, 93–107 CrossRef CAS.
- L. Xiao, J. L. Zhang, Y. Cong, B. Z. Tian, F. Chen and M. Anpo, Catal. Lett., 2006, 111, 207–211 CrossRef CAS.
- T. Gerfin, M. Graezel and L. Walder, in Progress in Inorganic Chemistry, ed. D. K. Kenneth, John Wiley and Sons, Inc., Malden (MA), USA, 2007, pp. 345–393 Search PubMed.
- J. L. Gole, J. D. Stout, C. Burda, Y. B. Lou and X. B. Chen, J. Phys. Chem. B, 2004, 108, 1230–1240 CrossRef CAS.
- S. M. Prokes, J. L. Gole, X. B. Chen, C. Burda and W. E. Carlos, Adv. Funct. Mater., 2005, 15, 161–167 CrossRef CAS.
- C. F. Windisch, G. J. Exarhos and R. R. Owings, J. Appl. Phys., 2004, 95, 5435–5442 CrossRef CAS.
- J. L. Gole, S. M. Prokes and O. J. Glembocki, J. Phys. Chem. C, 2008, 112, 1782–1788 CrossRef CAS.
- A. Ogden, J. A. Corno, J. I. Hong, A. Fedorov and J. L. Gole, J. Phys. Chem. Solids, 2008, 69, 2898–2906 CrossRef CAS.
- X. B. Chen, S. M. Halasz, E. C. Giles, J. V. Mankus, J. C. Johnson and C. Burda, J. Chem. Educ., 2006, 83, 265–267 CrossRef CAS.
- A. Brevet, F. Fabreguette, L. Imhoff, M. C. M. de Lucas, O. Heintz, L. Saviot, M. Sacilotti and S. Bourgeois, Surf. Coat. Technol., 2002, 151, 36–41 CrossRef.
- E. Gyorgy, A. P. del Pino, P. Serra and J. L. Morenza, Appl. Surf. Sci., 2002, 186, 130–134 CrossRef CAS.
- M. E. Straumanis, T. Ejima and W. J. James, Acta Crystallogr., 1961, 14, 493–497 CrossRef CAS.
- M. J. Escudero, T. Rodrigo, L. Mendoza, M. Cassir and L. Daza, J. Power Sources, 2005, 140, 81–87 CrossRef CAS.
- J. Choi, H. Park and M. R. Hoffmann, J. Phys. Chem. C, 2010, 114, 783–792 CrossRef CAS.
- R. Sanjines, H. Tang, H. Berger, F. Gozzo, G. Margaritondo and F. Levy, J. Appl. Phys., 1994, 75, 2945–2951 CrossRef CAS.
- J. A. Rodriguez, T. Jirsak, J. Dvorak, S. Sambasivan and D. Fischer, J. Phys. Chem. B, 2000, 104, 319–328 CrossRef CAS.
- N. C. Saha and H. G. Tompkins, J. Appl. Phys., 1992, 72, 3072–3079 CrossRef CAS.
- E. Gyorgy, A. P. del Pino, P. Serra and J. L. Morenza, Surf. Coat. Technol., 2003, 173, 265–270 CrossRef CAS.
- T. Jirsak, J. Dvorak and J. A. Rodriguez, Surf. Sci., 1999, 436, L683–L690 CrossRef CAS.
- W. M. R. C. D. Wagner, L. E. Davis, J. R. Moulder, G. E. Muilenberg, Handbook of X-Ray Photoelectron Spectroscopy, Perkin-Elmer Corp., EP, MN, USA, 1979 Search PubMed.
- L. A. Delouise and N. Winograd, Surf. Sci., 1985, 159, 199–213 CrossRef CAS.
- M. V. B. V. Crist, Handbook of Monochromatic XPS Spectra (Elements and Native Oxides), XPS International LLC, CA, USA, 2004 Search PubMed.
- G. Peto, G. Molnar, G. Bogdanyi and L. Guczi, Catal. Lett., 1994, 26, 383–392 CrossRef CAS.
- J. L. Gole, S. M. Prokes, M. G. White, T.-H. Wang, R. Crancium and D. A. Dixon, J. Phys. Chem. C, 2007, 111, 1782–1788.
- K. Irokawa, S. Ito, T. Kioka and H. Miki, Surf. Sci., 1999, 435, 297–301 CrossRef.
- C. N. R. Rao, A. Turner and J. M. Honig, J. Phys. Chem. Solids, 1959, 11, 173–175 CrossRef CAS.
- R. D. Shannon and J. A. Pask, J. Am. Ceram. Soc., 1965, 48, 391–398 CAS.
- S. Ram, R. Larry and H. D. Burtron, J. Am. Ceram. Soc., 1990, 73, 3528–3530 CAS.
- P. F. Becher and M. V. Swain, J. Am. Ceram. Soc., 1992, 75, 493–502 CrossRef CAS.
- A. Navrotsky and O. J. Kleppa, J. Am. Ceram. Soc., 1967, 50, 626 CAS.
- J. T. T. D. R. Stull, Joint Army-Navy-Air Force-ARPA-NASA, Thermochemical Working Group, 1996.
- D. C. Hurum, A. G. Agrios, K. A. Gray, T. Rajh and M. C. Thurnauer, J. Phys. Chem. B, 2003, 107, 4545–4549 CrossRef CAS.
| This journal is © The Royal Society of Chemistry 2010 |
