Synthesis and characterization of zirconium-doped mesoporous nano-crystalline TiO2
Kanattukara Vijayan
Bineesh
,
Dong-Kyu
Kim
and
Dae-Won
Park
*
Division of Chemical Engineering, Pusan National University, Busan, 609-735, Republic of Korea. E-mail: dwpark@pusan.ac.kr; Fax: +82 51 512 8563; Tel: +82 51 510 2399
First published on 21st May 2010
Abstract
A series of zirconium-doped nano-titania (Zr/TiO2) with various amounts of Zr were prepared by sol–gel method using titanium(IV) isopropoxide and zirconium nitrate as precursors. Zr/TiO2 samples were characterized using X-ray diffraction (XRD), surface area–pore volume measurements, infrared (FTIR) spectroscopy, UV–vis-diffuse reflectance spectroscopy (UV–vis-DRS), X-ray photoelectron spectroscopy (XPS), Raman spectroscopy, thermogravimetric (TG) analysis, and transmission electron microscopy (TEM) techniques. XRD data and Raman spectra indicated that even after 5 mol% doping of zirconium in the crystal lattice of TiO2, the samples were phase pure with the anatase structure. The crystalline size of the anatase decreased with increasing Zr content. An increase in the BET surface area was also observed after doping of zirconium on nano-titania.
1. Introduction
In recent years, an exponential growth of research activity has been seen in the field of nanoscience and nanotechnology. There have been quite intense works in the methodology of preparation and stabilization of these particles and studying their physical and chemical properties.1,2 Parameters like structure, size and elemental composition are considered to be highly important, beside the quantum size effects in materials of nanometre scale, for their promising applications. Depending on the application, some parameters play a more important role than others. For example, while composition and size- or surface-area-to-volume ratio of the nanoparticles are two vital factors for their applications in catalysis, controlling their shape is vital for fabricating photonic crystals.3Among the metal-oxide nanostructures, TiO2 has been extensively explored for several technological applications such as catalysis, gas sensing, white pigments for paints and cosmetics, dye-sensitized solar cells, photochemical degradation of organic pollutants and electrodes in lithium batteries. The applications of titania are found to depend strongly on the crystalline structure, morphology and particle size.3
Numerous efforts have been made toward the synthesis of high surface area anatase from different precursors (Ti(OnBu)4, (Ti(OiPr)4, TiCl4, TiCl3, Ti(SO4)2 and by different synthesis routes such as hydrothermal, thermohydrolysis, and sol–gel processes.4 Among the proven chemical methods of synthesis, sol–gel process is one of the versatile method for the synthesis of nano-materials with high surface-area-to-volume ratio.5–11 Furthermore, this process offers several advantages including a simple, low-cost technology, low process-temperatures and flexible control of the structure and size of final products using many operating parameters.12,13 In a typical sol–gel process, a colloidal suspension (a sol) is formed as a result of hydrolysis and polymerization reactions of the precursors, which are usually inorganic metal salts or metal organic compounds such as metal alkoxides. A complete polymerization and loss of solvent lead to the transition from the liquid sol into a solid gel phase.11
TiO2 is known to exist in three crystalline modifications, namely rutile (tetragonal), anatase (tetragonal) and brookite (orthorhombic). Anatase and rutile are the common polymorphs of synthetic titania. In fact, crystallization is highly influenced by hydrolysis conditions.14 During the condensation process, the formation of the linked chains of edge-sharing octahedrals corresponding to anatase appears more probable than the formation of straight chains typical of rutile. Therefore, anatase is obtained in processes under kinetic control, whereas processes involving Ostwald ripening lead to the equilibrium phase, i.e., rutile.2 On the other hand, the brookite structure, in which each octahedron shares one edge, occurs rarely compared to the anatase and rutile forms of titanium dioxide.
The chemical and physical properties of titania can be modified by the doping of metallic ions. Since the sol–gel method is a solution process, it has all the advantages of wet chemical process such as control of stoichiometry, doping of the desired amount of transition metal ions and fine dispersion of the dopant and titanium source. The incorporation of an active metal ion to the sol during the gelation stage allows cations to be uniformly incorporated into the host lattice.15
In the present work, we report the synthesis of mesoporous nanocrystalline TiO2 doped with different amounts of Zr by sol–gel method and are well-characterized by various techniques to study the effect of doping of zirconium on the physico-chemical properties of nano TiO2.
2. Experimental
2.1 Material preparation
Titanium(IV) isopropoxide (99.99%, Sigma-Aldrich) and glacial acetic acid (37%, Sigma-Aldrich) were used for the synthesis of titania sol. Water used in the whole experiment was prepared by means of a Milli-Qplus water purification system (Millipore, Bedford, MA, USA). The typical synthesis procedure for nano TiO2 is as follows: Titanium(IV) isopropoxide, glacial acetic acid and water were maintained in a molar ratio 1![[thin space (1/6-em)]](https://www.rsc.org/images/entities/char_2009.gif) :10:350. Titanium(IV) isopropoxide (9.3 ml) was hydrolyzed by the addition of (17.9 ml) glacial acetic acid at 0 °C, with the aid of an ice-salt pack from outside. To this solution 197.5 ml water was added drop wise under vigorous stirring for 5 h until a clear solution of TiO2 nano crystals was formed. The prepared solution was kept in dark for a nucleation process for 24 h. After the period, the solution was placed in an oven at a temperature of 70 °C for a period of 12 h for the gelation process. The obtained gel was then dried at 100 °C and subsequently the sample was crushed into fine powder and calcined at 500 °C for 5 h. The final product is referred to as nano-TiO2.
:10:350. Titanium(IV) isopropoxide (9.3 ml) was hydrolyzed by the addition of (17.9 ml) glacial acetic acid at 0 °C, with the aid of an ice-salt pack from outside. To this solution 197.5 ml water was added drop wise under vigorous stirring for 5 h until a clear solution of TiO2 nano crystals was formed. The prepared solution was kept in dark for a nucleation process for 24 h. After the period, the solution was placed in an oven at a temperature of 70 °C for a period of 12 h for the gelation process. The obtained gel was then dried at 100 °C and subsequently the sample was crushed into fine powder and calcined at 500 °C for 5 h. The final product is referred to as nano-TiO2.
For the preparation of zirconium-doped nano-TiO2, requisite amount of zirconium(IV) oxynitrate hydrate (Fluka Chemicals) solution corresponding to 1, 2, 3 and 5 mol% was dissolved in water and the above procedure was adopted. Finally all the samples were calcined at 500 °C for 5 h. The samples are labeled as x Zr/nano-TiO2, where x refers to the doped mol% of Zr in nano-TiO2.
2.2 Characterization
X-Ray diffraction (XRD) patterns were obtained on a Philips PANalytical X'pert PRO Model powder diffractometer operating at 40 kV and 30 mA using using Ni filtered Cu-Kα radiation (λ = 1.5404 Å). The diffractograms were recorded in the 2θ range 10–80°. The average crystallite size of the samples was determined using Scherrer equation. The texture of the samples was studied by N2 adsorption at 77 K using a Micromeritics ASAP 2010 instrument. The samples were outgassed in vacuum for 12 h at 180 °C prior to nitrogen adsorption. The specific surface areas were calculated using the Brunauer–Emmett–Teller (BET) equation. The total pore volumes were evaluated from the nitrogen uptake at a relative N2 pressure of P/P0 = 0.99. The pore size distribution was determined from the desorption branch of the N2 adsorption isotherm using the Barrett–Joyner–Halenda (BJH) method. The FTIR spectra of the samples (as KBr pellets) were recorded on a Perkin–Elmer infrared spectrophotometer in the range 400–4000 cm−1. XPS analyses were performed using a X-ray photoelectron spectrometer (VG, ESCALAB 250) with monochromatic Al-Kα radiation (hυ = 1486.6 eV). Samples calcined at 500 °C for 5 h were pressed into self-supporting wafers without a binder, followed by a pretreatment in an ultrahigh vacuum. The binding energies (BE) were calculated using the C 1s band as the reference (284.6 eV). UV–vis-diffuse reflectance spectra (UV–vis-DRS) were recorded on a Cary 5 spectrophotometer in the range 200–800 nm. Raman spectra were recorded with LabRAM HR Raman spectrometer (Horiba-Jobin-Yivon, France) in the range of 200–2000 cm−1, using Ar+ laser dehydrated conditions. The incident laser was tuned to 514.5 nm and delivered 50–100 mW of power during the course of the measurement. Thermogravimetric (TG) analyses were performed on 10 mg of sample with a Perkin Elmer TGA 7 apparatus under a nitrogen flow of 50 ml min−1 using a heating rate of 20 °C min−1 from room temperature to 850 °C. Transmission electron microscopy (TEM) was performed using a JEOL 2011 electron microscope fitted with LaB6 filament and operated at 200 kV.3. Results and discussion
3.1 X-Ray diffraction
Fig. 1 shows the XRD patterns of nano-TiO2 and Zr/nano-TiO2 samples calcined at 500 °C. The XRD pattern corresponding to nano-TiO2 is found to match that of the anatase phase (JCPDS: 21–1272) with the major peak manifested by its (101) peak at 2θ = 25.5°. The (110) peak of rutile at 2θ = 27.5° is not present in the XRD pattern of nano-TiO2 confirming the absence of any rutile phase.16 During the sol–gel synthesis of nano-TiO2, a high water ratio was kept to enhance the nucleophilic attack of water on titanium(IV) isopropoxide and to suppress fast condensation of titanium(IV) isopropoxide species to yield TiO2 nanocrystals. In addition, the presence of residual alkoxy groups can significantly reduce the rate of crystallization of TiO2 which favored the formation of less dense anatase phase exclusively.15,17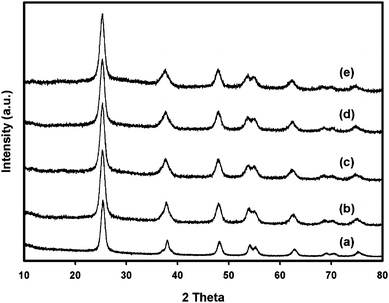 | ||
| Fig. 1 X-Ray diffraction patterns of the samples: (a) nano-TiO2, (b) 1 mol% Zr/nano-TiO2, (c) 2 mol% Zr/nano-TiO2, (d) 3 mol% Zr/nano-TiO2 and (e) 5 mol% Zr/nano-TiO2. | ||
The XRD patterns of nano-TiO2 after doping with zirconium were similar to that of nano-TiO2, and no peaks assigned to oxides of zirconium were observed. Therefore, nano-TiO2 and the Zr/nano-TiO2 samples calcined at 500 °C for 5 h were found to retain titania with no phase separation leading to a rutile titania or zirconia phase. Based on this, it can be inferred that either the zirconium species has been substituted into the crystal lattice sites of titania or it exists as zirconium oxide in a highly dispersed form over the titanium surface.5,11,18 Since Zr4+ is more electropositive than Ti4+, the electron cloud in each TiO2 nanoparticle might be loosely held, thus favoring formation of less dense anatase phase. In other words, the tight packing arrangements required for rutile phase formation is fully suppressed by the addition of zirconium nitrate in water which enhances the polarity of water, thus facilitating the formation of anatase phase only.15 It was already reported that the entry of zirconium in the lattice of TiO2 prevented the interconversion of anatase to rutile during calcination.15 It can also be seen that there is no discernible shift in the position of XRD peaks with increasing extent of zirconium doping. But compared to nano-TiO2, that the XRD peaks of Zr/nano-TiO2 exhibit significant peak broadening indicates that particle size of nano-TiO2 decreased with increasing zirconium content.11 The average particle size of the samples is shown in Table 1, estimated from the (101) peak of the anatase using the Scherrer equation:
| D = Kλ/β cos θ |
| Samples | BET surface area/m2 g−1 | Particle sizea/nm | Band gap energyb/eV | Total weight lossc (%) |
|---|---|---|---|---|
| a The average particle size obtained from XRD analysis data. b Band gap energy calculated using the λmax value. c Total weight loss (%) estimated from (TG) analysis data. | ||||
| Nano-TiO2 | 135 | 12.3 | 3.66 | 15.8 |
| 1 mol% Zr/nano-TiO2 | 143 | 9.0 | 3.72 | 19.9 |
| 2 mol% Zr/nano-TiO2 | 153 | 8.5 | 3.75 | 23.3 |
| 3 mol% Zr/nano-TiO2 | 157 | 7.1 | 3.77 | 26.8 |
| 5 mol% Zr/nano-TiO2 | 172 | 7.0 | 3.78 | 28.5 |
3.2 Textural properties of the samples
Table 1 presents the textural properties of nano-TiO2 and Zr/nano-TiO2 samples. The BET surface area of nano-TiO2 was 135 m2 g−1. The surface area of nano-TiO2 increased with increasing zirconium content. This increase in surface area may be due to the decrease in particle size of nano-TiO2 by zirconium doping, which inhibits densification and crystalline growth of TiO2 nanoparticles by providing dissimilar boundaries.15,19Fig. 2 shows the BJH pore-size distribution plot and nitrogen adsorption/desorption isotherm of calcined 2 mol% Zr/nano-TiO2. The isotherm shown by the sample is of classical type IV, which is a representative of mesoporous solids and the hysteresis loop indicates the presence of ink-bottle shaped or cage-type pores.15,20,21 The BJH analyses showed that the 2 mol% Zr/nano-TiO2 exhibited an average pore-size of about 45 Å calculated from the desorption branch of the nitrogen adsorption isotherm.
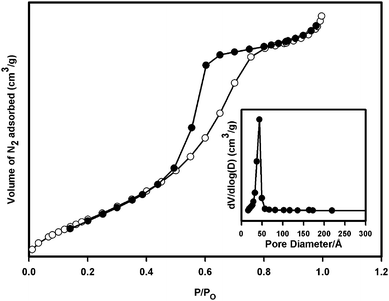 | ||
| Fig. 2 Nitrogen adsorption–desorption isotherms and the corresponding pore size distribution curve obtained from the desorption branch of the nitrogen isotherm (inset) of 2 mol% Zr/nano-TiO2. | ||
3.3 FTIR analysis
The FTIR spectra of the samples in the frequency range of 400–4000 cm−1 are shown in Fig. 3. All the samples show peaks corresponding to the stretching vibration of O–H and bending vibrations of adsorbed water molecules around 3200–3400 cm−1 and 1600 cm−1, respectively.15,18,22 The broad intense band in the range of 450–700 cm−1 is due to the bending vibration of Ti–O bonds.15,18,20,23 No additional peaks are present upon Zr doping, supporting the efficient dispersion of zirconium, and it indicates the absence of clusters of zirconia, which is in good agreement with the XRD analysis result.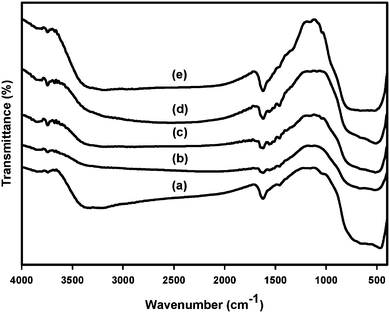 | ||
| Fig. 3 FTIR spectra of (a) nano-TiO2, (b) 1 mol% Zr/nano-TiO2, (c) 2 mol% Zr/nano-TiO2, (d) 3 mol% Zr/nano-TiO2 and (e) 5 mol% Zr/nano-TiO2. | ||
3.4 X-Ray photoelectron spectroscopy (XPS)
The surface oxidation states and binding energy (BE) of titanium and zirconium were analyzed by XPS. Fig. 4 shows the XPS peaks associated with titanium and zirconium in 5 mol% Zr/nano-TiO2. The binding energies of Ti 2p photoelectron peaks at 459.1 and 464.9 eV corresponds to Ti 2p3/2 and Ti 2p1/2 lines, respectively.24–29 These values indicate that titanium is present in the +4 oxidation state. The Zr 3d photoelectron peaks were observed at 182.4 and 184.7 eV corresponding to Zr 3d5/2 and Zr 3d3/2, respectively, which are assigned to the +4 oxidation state of zirconium.30 These results indicate that in Zr/nano-TiO2 both titanium and zirconium metal ions are present in their highest oxidation state after calcination at 500 °C.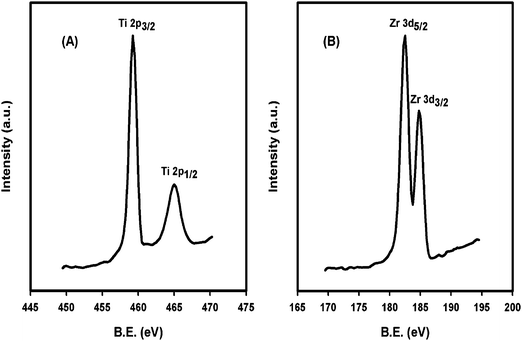 | ||
| Fig. 4 XPS spectra of (A) Ti and (B) Zr in 5 mol% Zr/nano-TiO2 calcined at 500 °C. | ||
3.5 UV–vis-diffuse reflectance spectroscopy (UV–vis-DRS)
UV–vis-diffuse reflectance spectroscopy (UV–vis-DRS) is a very useful technique to study the surface coordination and different oxidation states of the metal ions in metal oxides.31 The UV-vis absorption band edge is a strong function of nanosize titania clusters.32,33Fig. 5 shows the UV-vis absorption spectrum of nano-TiO2 and Zr/nano-TiO2. The absorbance spectrum of nano-TiO2 consists of two bands, one at 240 nm and other band around 300–400 nm. The band around 240 nm is assigned to tetrahedral isolated Ti species present in the sample and the band around 300–400 nm arises due to charge-transfer from the valence band (mainly formed by 2p orbitals of the oxide anion) to the conduction band (mainly formed by 3d t2g orbitals of the Ti4+ cations).15,34,35 This band confirms the existence of the anatase crystal form of TiO2.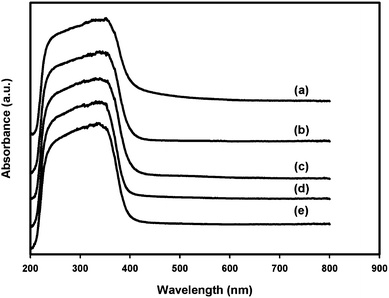 | ||
| Fig. 5 UV–vis-DRS spectra of (a) nano-TiO2, (b) 1 mol% Zr/nano-TiO2, (c) 2 mol% Zr/nano-TiO2, (d) 3 mol% Zr/nano-TiO2 and (e) 5 mol% Zr/nano-TiO2. | ||
In the case of zirconium doped samples, the UV absorption shifts to the lower wavelength region of the absorption spectrum. Hence, there is sufficient decrease in the particle size (the well-established blue-shift of semiconductor particles, a function of size effects) and increase in band gap value (Table 1) due to zirconium doping.15 This observation is in good agreement with our XRD analysis data, which shows a decrease in particle size with zirconium doping. It was already reported that since Zr4+ is more electropositive than Ti4+, the O (2p) band present in the valence band of TiO2 is stabilized more on Zr4+ doping. Hence there is an increase in the band gap value of TiO2 due to zirconium doping.36 Moreover, the formation of Ti–O–Zr inhibits the transition of TiO2 phase and prevents the agglomeration of TiO2 nanoparticles and the growth of rutile phase.37 The lack of absorption bands above 600 nm in all samples indicates the absence of Ti3+ ions in the TiO2 lattice.38
3.6 FT-Raman spectroscopy
As we know, XRD usually reveals the long-range order of materials and gives average structural information within several unit cells whereas Raman spectroscopy is a highly specific analytical method which is sensitive to crystallinity and microstructures of the materials.39Fig. 6 shows the Raman spectra of nano-TiO2 and Zr/nano-TiO2 samples. The Raman bands at 147, 407, 528 and 646 cm −1 can be assigned as the Eg, B1g, A1g + B1g, and Eg modes of the anatase phase, respectively.39 The strongest Eg mode at 151 cm −1 arising from the external vibration of the anatase structure is well resolved, which indicates that an anatase phase was formed in the prepared nanocrystals and long-range order was somewhat formed.39 The absence of Raman bands at 450 cm −1 and 610 cm −1 in all samples corresponding to Eg and A1g modes of rutile phase, again confirms the phase purity of the samples.11,39,40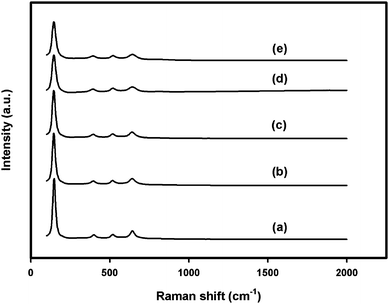 | ||
| Fig. 6 Raman spectra of (a) nano-TiO2, (b) 1 mol% Zr/nano-TiO2, (c) 2 mol% Zr/nano-TiO2, (d) 3 mol% Zr/nano-TiO2 and (e) 5 mol% Zr/nano-TiO2. | ||
After zirconium doping, a significant decrease in the intensity of Raman bands was observed. This may be due to the lattice imperfections caused by the incorporation of zirconium in the lattice of TiO2.11,39 It can also be seen that compared to nano-TiO2, zirconium doped samples show a significant peak broadening in the Raman spectrum. This peak broadening arises due to the decrease in particle size of the samples with zirconium doping.1 This observation is consistent with our XRD and UV–vis-DRS analysis results. There was no additional peak detected after doping with zirconium, indicating the absence of a discrete ZrO2 phase.
3.7 Thermogravimetric (TG) analyses
In order to investigate the thermal behavior of the samples, thermogravimetric (TG) analyses were carried out in the temperature range of 25–850 °C. TG patterns of nano-TiO2 and Zr/nano-TiO2 are shown in Fig. 7. The first weight loss observed in the range 25–200 °C is due to the removal of physically adsorbed water molecules. The second weight loss observed between 200–550 °C can be attributed to the removal of chemisorbed water molecules and also to the release of organic residues that are trapped inside the pores.41 No significant weight loss was observed for all samples in the range of 550–850 °C, which indicates no crystallization or phase transition in this temperature region.42Table 1 shows the total weight losses for all samples in the temperature range of 25–850 °C. The total weight loss observed in nano-TiO2 was 15.8%. But in the case of zirconium-doped samples, the observed weight loss is more than that of nano-TiO2 in all temperature regions and it increases with increasing zirconium content in nano-TiO2.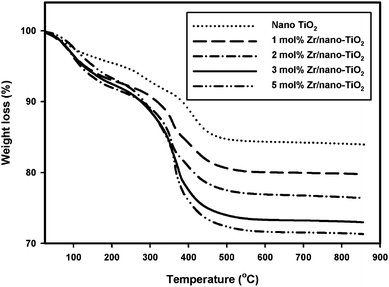 | ||
| Fig. 7 TGA curves of (a) nano-TiO2, (b) 1 mol% Zr/nano-TiO2, (c) 2 mol% Zr/nano-TiO2, (d) 3 mol% Zr/nano-TiO2 and (e) 5 mol% Zr/nano-TiO2. | ||
3.8 TEM analysis
TEM analyses were carried out to obtain informations about the particle size, shape and dispersion of Zr particles in nano-TiO2. Fig. 8 shows the TEM micrographs of the samples calcined at 500 °C. It is evident that both nano-TiO2 and Zr/TiO2 particles are spherical in shape with an average particle size ranging from 6–13 nm. This result is consistent with the particle size calculated from XRD analysis data. The preparation of nano-TiO2 and Zr/nano-TiO2 samples were carried out in the presence of acetic acid. The importance of acetic acid in the preparation of nano-titania was reported in many works.4,15,22,35 Since the pKa of acetic acid is close to three, there is every chance for protonation of TiO2 nanoparticles which could suppress further crystallization.15,22,35 Therefore, the use of acetic acid as a modifier allows the control of both the degree of condensation and oligomerization and leads to the preferential crystallization of TiO2 in the anatase phase. Without the control of the condensation reactions, an amorphous mass of agglomerated particles is immediately obtained after the addition of water.4 This means that, with acetic acid as a bidentate ligand and under mild acidic conditions, condensation reactions advance until a point in which the nanocrystalline nuclei do not grow further because of unfavorable conditions for the remaining ligands to condense via alkoxolation or oxolation.4 This explains how crystallization reaction proceeds and leads to the formation of nanocrystalline anatase particles. The addition of acetic acid does not cause residual impurities on the surface of TiO2 after calcination.15,22,35 Furthermore, there are no obvious characteristic nanoparticles of zirconium in the TEM images, indicating the high dispersion of zirconium in nano-TiO2.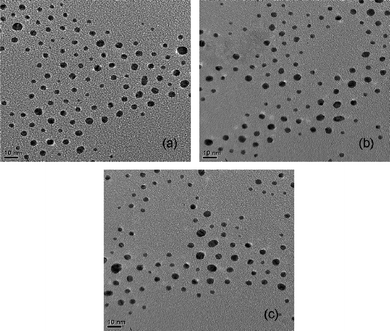 | ||
| Fig. 8 TEM micrographs of the samples calcined at 500 °C (a) nano-TiO2, (b) 1 mol% Zr/nano-TiO2 and (c) 3 mol% Zr/nano-TiO2. | ||
Conclusions
An aqueous sol–gel method was used for the preparation of zirconium doped nano-TiO2. The prepared materials were analyzed using various physico-chemical characterization techniques. XRD and Raman analyses revealed the presence of the anatase phase of titania without any evidence for the rutile phase. Doping of zirconium in nano-TiO2 lead to a decrease in particle size, an increase in surface area and high band gap values. The average particle size of the prepared samples ranged from 6–13 nm. XPS study revealed that zirconium and titanium were present in the +4 oxidation state in Zr/nano-TiO2. TEM analyses revealed the spherical morphology of the particles without any aggregation of metal species.Acknowledgements
This study was supported by the National Research Foundation of Korea (2009-0070580) and Brain Korea 21 program. The authors wish to express their appreciation to the Korea Basic Science Institute.References
- X. Chen and S. S. Mao, Chem. Rev., 2007, 107, 2891–2959 CrossRef CAS.
- K. R. Sunajadevi and S. Sugunan, Mater. Lett., 2004, 58, 3290–3296 CrossRef CAS.
- M. Pal, J. Garcia Serrano, P. Santiago and U. Pal, J. Phys. Chem. C, 2007, 111, 96–102 CrossRef CAS.
- R. Parra, M. S. Goes, M. S. Castro, E. Longo, P. R. Bueno and J. A. Varela, Chem. Mater., 2008, 20, 143–150 CrossRef CAS.
- J. C. S. Wu and C. H. Chen, J. Photochem. Photobiol., A, 2004, 163, 509–515 CrossRef CAS.
- A. C. Pierre and G. M. Pajonk, Chem. Rev., 2002, 102, 4243–4266 CrossRef CAS.
- L. Li, C. Liu and Y. Liu, Mater. Chem. Phys., 2009, 113, 551–557 CrossRef CAS.
- P. K. Ting, Z. Hussain and K. Y. Cheong, J. Alloys Compd., 2008, 466, 304–307 CrossRef CAS.
- J. A. Schwarz, C. Contescu and A. Contescu, Chem. Rev., 1995, 95, 477–510 CrossRef CAS.
- L. Fan, J. Dougnei and M. Xueing, J. Alloys Compd., 2009, 470, 375–378 CrossRef CAS.
- K. Battacharyya, A. K. Patra, P. U. Sastry and A. K. Tyagi, J. Alloys Compd., 2009, 482, 256–260 CrossRef.
- A. Soloviev, H. Jensen, E. G. Sogaard and A. V. Kanaev, J. Mater. Sci., 2003, 38, 3315–3318 CrossRef CAS.
- H. Jensen, A. Soloviev, Z. Li and E. G. Sogaard, Appl. Surf. Sci., 2005, 246, 239–249 CrossRef CAS.
- K. Terabe, K. Kato, H. Miyazaki, S. Yamaguchi, A. Imai and Y. Iguchi, J. Mater. Sci., 1994, 29, 1617–1622 CrossRef CAS.
- N. Venkatachalam, M. Palanichamy, B. Arabindoo and V. Murugesan, J. Mol. Catal. A: Chem., 2007, 266, 158–165 CrossRef CAS.
- N. N. Binitha, M. R. Reshmi, S. Sugunan, V. K. Ambili and A. A. Zetty, Catal. Today, 2009, 147, S76–S80 CrossRef CAS.
- N. Venkatachalam, M. Palanichamy, B. Arabindoo and V. Murugesan, Catal. Commun., 2007, 8, 1088–1093 CrossRef CAS.
- X. Chen, X. Wang and X. Fu, Energy Environ. Sci., 2009, 2, 872–877 RSC.
- J. Lukac, M. Klementova, P. Bezdicka, S. Bakardejieva, J. Subrt, L. Szatmary and A. Gruskova, J. Mater. Sci., 2007, 42, 9421–9428 CrossRef CAS.
- J. Tao, Y. Shen, F. Gu, J. Zhu and J. Zhang, J. Mater. Sci. Technol., 2007, 23, 513–516 CAS.
- K. V. Baiju, P. Shajesh, W. Wunderlich, P. Mukundan, S. Rajesh Kumar and K. G. K. Warrier, J. Mol. Catal. A: Chem., 2007, 276, 41–46 CrossRef CAS.
- N. Venkatachalam, M. Palanichamy and V. Murugesan, J. Mol. Catal. A: Chem., 2007, 273, 177–185 CrossRef CAS.
- T. C. Jagadale, S. P. Takale, R. S. Sonawane, H. M. Joshi, S. I. Patil, B. B. Kale and S. B. Ogale, J. Phys. Chem. C, 2008, 112, 14595–14602 CrossRef CAS.
- K. V. Bineesh, S. Y. Kim, B. R. Jermy and D. W. Park, J. Ind. Eng. Chem., 2009, 15, 207–211 Search PubMed.
- Y. Kim, J. Lee, H. Jeong, Y. Lee, M. H. Um, K. M. Jeong, M. K. Yeo and M. Kang, J. Ind. Eng. Chem., 2008, 14, 396–400 Search PubMed.
- S. H. Song and M. Kang, J. Ind. Eng. Chem., 2008, 14, 785–791 Search PubMed.
- M. E. Borges, M. C. Alvarez-Galvan, P. Esparza, E. Medina, P. Martin-Zarza and J. L. G. Fierro, Energy Environ. Sci., 2008, 1, 364–369 RSC.
- Z. Liu, B. Guo, L. Hong and H. Jiang, J. Phys. Chem. Solids, 2005, 66, 161–167 CrossRef CAS.
- F. M. Liu and T. M. Wang, Appl. Surf. Sci., 2002, 195, 284–290 CrossRef CAS.
- S. Tsunekawa, K. Asami, S. Ito, M. Yashima and T. Sugimoto, Appl. Surf. Sci., 2005, 252, 1651–1656 CrossRef CAS.
- B. M. Reddy, P. Bharali, P. Saikia, G. Thrimurthulu, Y. Yamada and T. Kobayashi, Ind. Eng. Chem. Res., 2009, 48, 453–462 CrossRef CAS.
- Y. Li, T. J. White and S. H. Kim, J. Solid State Chem., 2004, 177, 1372–1381 CrossRef CAS.
- M. Anpo, T. Shima, S. Kodama and Y. Kobokawa, J. Phys. Chem., 1987, 91, 4305–4310 CrossRef CAS.
- S. Sakthivel, M. V. Shankar, M. Palanichamy, B. Arabindoo, D. W. Bahnemann and V. Murugesan, Water Res., 2004, 38, 3001–3008 CrossRef CAS.
- N. Venkatachalam, M. Palanichamy and V. Murugesan, Mater. Chem. Phys., 2007, 104, 454–459 CrossRef CAS.
- K. Nagaveni, M. S. Hedge and G. Madras, J. Phys. Chem. B, 2004, 108, 20204–20212 CrossRef CAS.
- J. Nair, P. Nair, F. Mizukami, Y. Oosawa and T. Okubo, Mater. Res. Bull., 1999, 34, 1275–1290 CrossRef CAS.
- Y. Sakatani, H. Ando, K. Okusako, H. Koike, J. Nunoshige, T. Takata, J. N. Kondo, M. Hara and K. Domen, J. Mater. Res., 2004, 19, 2100–2108 CrossRef CAS.
- W. F. Zhang, Y. L. He, M. S. Zhang, Z. Yin and Q. Chen, J. Phys. D: Appl. Phys., 2000, 33, 912–916 CrossRef CAS.
- S. S. Chan, I. E. Wachs, L. L. Murrell, L. Wang and W. K. Hall, J. Phys. Chem., 1984, 88, 5831–5835 CrossRef CAS.
- F. Sayilkan, M. Asilturk, H. Sayilkan, Y. Onal, M. Akarsu and E. Arpac, Turk. J. Chem., 2005, 29, 697–706 Search PubMed.
- W. Guo, Z. Lin, X. Wang and G. Song, Microelectron. Eng., 2003, 66, 95–101 CrossRef CAS.
| This journal is © The Royal Society of Chemistry 2010 |