DOI:
10.1039/C0NR00103A
(Paper)
Nanoscale, 2010,
2, 2203-2208
Controllable reflection properties of nanocomposite photonic crystals constructed by semiconductor nanocrystallites and natural periodic bio-matrices
Received
9th February 2010
, Accepted 22nd June 2010
First published on
16th August 2010
Abstract
In this contribution, the subtle periodic nanostructures in butterfly wings and peacock feathers are applied as natural PhC matrices to in situ embed CdS nanocrystallites (nano-CdS) on the structure surface via a convenient solution process. The resulting nano-CdS/natural PhCs nanocomposites show typical 1D, quasi 1D and 2D PhC structures at the nanoscale, which is inherited from the corresponding natural periodic bio-matrices. Moreover, their reflection properties are investigated and show dependence on PhC type, structure parameter, loading amount, as well as collecting angle. This work suggests that natural periodic bio-structures could be perfect matrices to construct novel nanocomposite PhCs, whose photonic band structures are tunable and thus achieve controllable optical properties. Related ideas could inspire the design and synthesis of future nanocomposite PhCs.
Introduction
Photonic crystals (PhCs) are famous for their ability to control light propagation, which is essential in new generation nanoscaled optoelectronic devices.1 By infiltrating semiconductor nanoparticles inside PhCs, the electronic resonances of semiconductor nanoparticles and the optical resonances of PhCs can be combined within a single structure.2 Such nanocomposite PhCs could even realize highly controllable spontaneous emission for novel nanoscaled light sources.3,4 Many artificial PhCs have been investigated to load semiconductor nanoparticles, such as self-assembled colloidal PhCs with opal structures,3–6 silicon-on-insulator based 2D PhCs7 and photopolymer based 3D woodpile structures.8 The colloidal based opals could easily display nanoscaled lattices,2,9 while most non-opal PhCs rely on high-cost equipment and usually display microscaled lattices.8,10 Considering that PhCs applied in the visible range require nanoscaled lattices, several methods have recently been developed to create non-opal PhCs with lattice constants around hundreds of nanometres, including holographic lithography,11 focused-ion-beam etching,12 block copolymer assembly and two-photon lithography.13 However, it still remains a considerable challenge to obtain various patterns of PhCs for visible light control through flexible low-cost methods.14
Surprisingly, nature has already solved the problem through millions of years of evolution. In biological systems, nanoscaled periodic structures could be formed under ambient condition, as well as produce striking optical effects.15 The structure patterns of natural PhCs include typical 1D multilayers, 2D arrays and 3D opals.16 And more interestingly, some natural PhCs display more complex patterns that result in multieffects.17–19 Considering their low-cost, abundant patterns and unobtainable smart structures, natural PhCs are suggested to be another choice of structure matrices for creating nanocomposite PhCs. Herein, the typical 1D PhCs in the wings of butterfly Papilio paris,20 the quasi 1D PhCs in the wings of butterfly Euploea mulciber16 and the 2D PhCs in peacock feathers21,22 are explored as model structures to load semiconductor nanoparticles.
CdS has a direct bandgap near 2.4 eV for bulk material, which makes it display visible photoluminescence. By reducing its diameter to around 6 nm, CdS nanoparticles/nanocrystallites (nano-CdS) would display size- and surface-dependant optical properties.23 Besides, it also has a high refractive index (ranging from 2.3 to 2.5 for wavelengths between 800 and 400 nm).24 All these factors make nano-CdS attractive in constructing nanocomposite PhCs.5,25 Thus, nano-CdS are chosen as the example material to hybridize with natural PhCs.
Recently, we have actualized the successful homogeneous loading of nano-CdS on the structure surface of butterfly wings26 and peacock feathers27via a convenient solution process. It is also worthwhile to investigate the optical interactions between nano-CdS and natural periodic structures in the nanocomposite PhCs. In this contribution, the reflection properties of as-prepared nano-CdS/natural PhCs are investigated with respect to PhC type, structure parameter, loading amount, as well as collecting angle.
Experimental
Materials
Butterflies Papilio paris (subfamily Papilioninae of the family Papilionidae), butterflies Euploea mulciber (subfamily Danainae of the family Danaidae) and peacock feathers (Pavo cristatus, family Phasianidae) were purchased from a butterfly garden and peacock garden in Shanghai, respectively. Butterflies P. paris belongs to the Urania type, which comprises continuous multi-layering within the body of the iridescent scales.20 In particular, the specimen reported here doesn’t have a distinct concavity structure (Fig. 1a), but contains a similar structure to artificial multi-layers that could be considered as typical 1D PhC. Butterflies Euploea mulciber belongs to the Morpho type, which comprises parallel lamellars within discrete ridged structures on the surface of wing scales. This structure combines the regularity (lamellars within ridges) and irregularity (different heights of ridges) smartly16 and should be considered as quasi 1D PhC. Peacock feathers contain the 2D PhC structure composed of keratin-coated melanin rods beneath the surface keratin layer. The variation of lattice constant and period number results in different iridescent colors,21,22 which is ideal for research work.
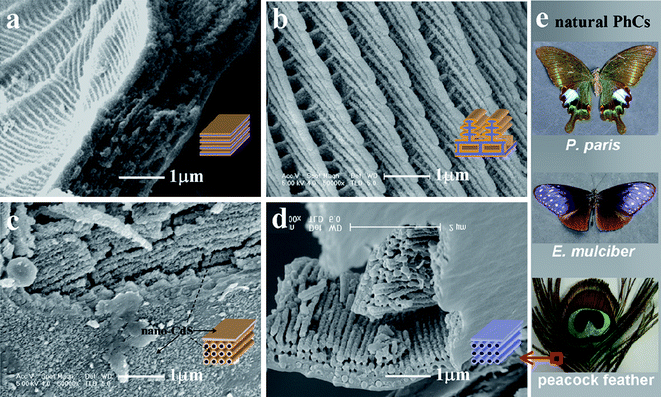 |
| | Fig. 1 FESEM images and corresponding structure illustrations of (a–c) nano-CdS/natural PhCs and (d) original natural PhC in peacock feathers, as well as (e) photographs of original natural PhCs. (a) nano-CdS/wing (P. paris) with typical 1D PhC structure, (b) nano-CdS/wing (E. mulciber) with quasi 1D PhC structure, (c) nano-CdS/feather (red) with 2D PhC structure, (d) original feather (red) with 2D PhC structure. | |
Nanocomposite fabrication
A facile solution route was established as published before.26,27 Briefly, the original butterfly wings or peacock feathers were activated by EDTA/DMF suspension at 110 °C for several hours, then immersed in Cd2+ (0.4 g CdCl2·2.5H2O, 5 ml ethanol and 4 ml ammonia) and S2− (0.18 g Na2S·9H2O and 60 ml ethanol) impregnants for 30 min in turn to form CdS seeds in situ. After that, the CdS seeds/wings or CdS seeds/feathers were put into the Cd2+ impregnant again, followed by the addition of thiourea (0.115 − 0.2 g). Then the system was kept at 100 °C for 30–40 min in an autoclave and the nano-CdS/wings or nano-CdS/feathers nanocomposite PhCs were harvested.
Measurements
FESEM was performed using a FEI Sirion 200 field emission gun scanning electron microscope at an acceleration voltage of 5.0 kV. Samples were presputtered with Au on their surface to prevent charging. HRTEM measurements including bright field imaging and selected area electron diffraction (SAED) were taken using a JEM-2100F instrument under an acceleration voltage of 200 kV. Samples were dispersed in ethanol via ultrasonic agitation. Reflection spectra were measured using a CRAIC QDI 2010 superior microspectrophotometer. The detecting area was fixed to be 10 μm × 10 μm.
Results and discussion
Characterization of CdS-loaded natural PhCs
The distribution of nanoparticles in nanocomposite PhCs should be investigated carefully in order to obtain reliable optical properties for potential applications. With homogeneous loading, nanocomposites could still be considered PhCs by exhibiting periodic distributed dielectric constants. Fig. 1 shows the photographs of the original natural PhCs and the FESEM images of as-prepared CdS-loaded natural PhCs, and Fig. 2 characterizes the in situ synthesized nano-CdS by HRTEM observation. The fragments in Fig. 2a with parallel lamellar structure correspond to a single ridge of nano-CdS/wing(E. mulciber) (Fig. 1b). A careful look at the lamellar reveals the homogeneously distributed and tightly adhered nano-CdS on the structure (Fig. 2b), even if a long time (∼300 min) ultrasonic agitation was used during HRTEM sample preparation. Higher magnification measurements were taken from shaken nano-CdS. It is clear that the in situ synthesized nano-CdS are mainly cubic phase nanocrystallites (Fig. 2c) with diameters below 10 nm (Fig. 2d). The small size makes them possible to form relatively smooth layers on the structure surface of natural PhCs both outside (Fig. 1b) and inside (Fig. 1a, 1c), although the nanocomposites' structure surface appears slightly rougher than the original one (Fig. 1c, 1d). Thus, the obtained nano-CdS/natural PhCs have structural features similar to their original counterparts, and should be considered as novel nanocomposite PhCs as illustrated in Fig. 1.
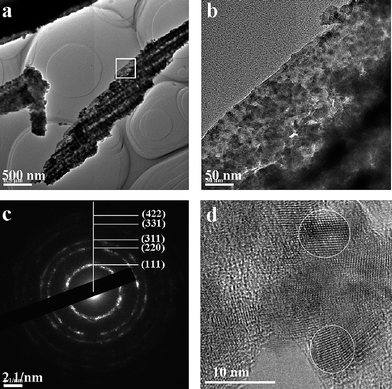 |
| | Fig. 2 HRTEM results of nano-CdS/wing (E. mulciber) dispersed in ethanol by ultrasonic agitation. (a) The fragment corresponding to a single ridge in Fig. 1b, (b) magnified lamellar as indicated by a white frame in (a), (c) SAED patterns indexed according to JCPDS cards 89-0440, (d) shaken nano-CdS. | |
Different PhC types
The structural details and chemical components of novel nanocomposites are shown in the bottom half of Fig. 3. Based on the chosen natural PhCs, three types of novel nanocomposite PhCs are created in this investigation. Since their lattice constants are all 100–200 nm (Fig. 1), their photonic band structures should occur in the visible range. It is suggested that they should have the ability of influencing visible light propagation, and exhibit interesting reflection spectra. At present, as shown in the top half of Fig. 3, the reflection spectra of nanocomposite PhCs (solid line) are different from that of natural PhCs (dashed line). In the case of typical 1D PhCs (Fig. 3a) and quasi 1D PhCs (Fig. 3b), both the natural PhCs and the nanocomposite PhCs display one main reflection band. However, the band position shifts to longer wavelength due to nano-CdS incorporation. This phenomenon could be partly explained by eqn (1):11,16where λ represents the wavelength of peak reflectivity for a perfect multilayer PhC, n1 and n2 are the refractive indices of the first and second layer, d1 and d2 are the corresponding layer thicknesses. As nano-CdS (n = 2.4) partly occupy the air (n = 1) spaces in the original PhC structures, λ would encounter an increase that causes the red shift. Besides, 2D nanocomposite PhC has a more complex reflection spectrum (three bands) than the original one (two bands) as displayed in Fig. 3c. In summary, nanocomposite PhCs with different PhC types display distinct reflection spectra, and the changes of reflection spectra due to nano-CdS incorporation also vary with PhC types.
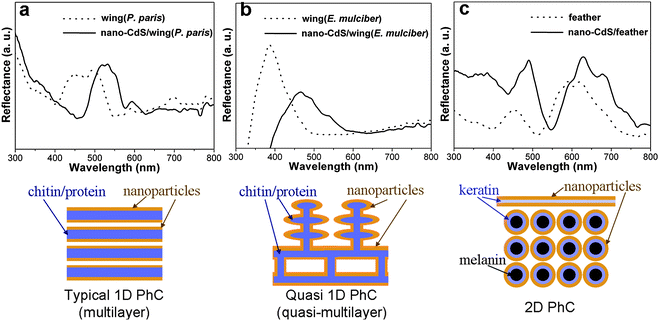 |
| | Fig. 3 The reflection spectra of nano-CdS/natural PhCs (solid line) and original natural PhCs (dashed line) at normal incidence and normal reflection. Illustrations below the spectra describe the corresponding nano-CdS/natural PhCs. (a) Nano-CdS/wing (P. paris) with typical 1D PhC structure, (b) nano-CdS/wing (E. mulciber) with quasi 1D PhC structure, (c) nano-CdS/feather (red) with 2D PhC structure. | |
Influence of structure parameter
As revealed by Zi et al.,22 the structural parameters of 2D PhCs inside peacock feathers differ from place to place, which causes the different iridescent colors of the tail feather's eye region. In this case, the whole eye region is involved in the nano-CdS incorporation, and Fig. 4 shows the reflection spectra of different parts. In the blue and green parts, the original feathers display one reflection band, while the nanocomposite PhCs show two reflection bands in Fig. 4a (400–500 nm and 500–650 nm, with a shoulder peak around 560 nm) and Fig. 4b (400–500 nm and 500–700 nm), respectively. Similar to the red part (Fig. 3c), the original feathers have two reflection bands in brown and yellow parts, while corresponding nanocomposite PhCs display three reflection bands in Fig. 4c (300–500 nm, 500–600 nm and 600–800 nm) and Fig. 4d (400–490 nm, 490–550 nm and 550–800 nm). Therefore, the higher complexity of the 2D nanocomposite PhCs than the original one could also be observed in the eye region of tail feathers, and different structural parameters of nanocomposite PhCs result in different reflection spectra: double bands for blue and green parts, and three bands for brown and yellow parts.
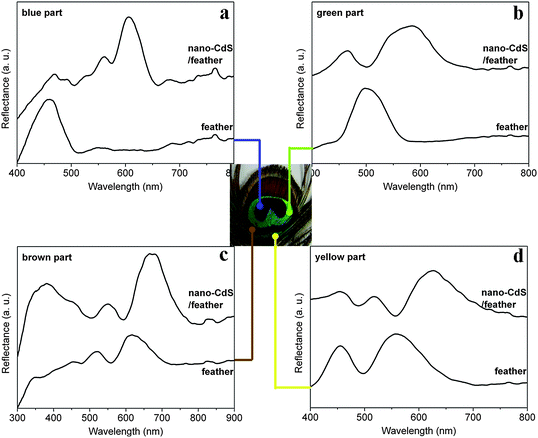 |
| | Fig. 4 The reflection spectra of nano-CdS/feathers and original feathers at normal incidence and normal reflection. The 2D PhC structural parameters vary in different parts: (a) blue, (b) green, (c) brown and (d) yellow parts in the eye region of the tail feathers. (The colors correspond to original feathers as indicated in the photograph). | |
Influence of loading amount
The loading amount of nanoparticles could highly influence the reflection spectra of nanocomposite PhCs, and modify the PhC band structures.24,28,29 According to a previous investigation, EDTA/DMF activation could bring additional active sites (COO−) to the structure surface of peacock feathers.27 Thus, the as-prepared sample involving 2.5 h EDTA/DMF activation (Fig. 5b) contains more nano-CdS than the sample without EDTA/DMF activation (Fig. 5a), as observed by FESEM images (insets). Moreover, the increase of thiourea amount (0.115 g → 0.18 g) during the solvothermal process would further enhance nano-CdS loading (Fig. 5c). In the reflection spectrum of the sample with more nano-CdS, the relative intensity of the band around 550–800 nm is lower, while that of the band around 300–450 nm is higher. Fig. 6 presents the reflection spectra of the sample with EDTA/DMF activation (typical sample) and DMF activation (heavily loaded sample), whose photographs and FESEM images are displayed on the right side. In the reflection spectra of heavily loaded sample (grey line), the band around 500–700 nm is absent for the green part, while the band around 600–800 nm is absent for the brown part. Although the changes of reflection spectra appear quite different in Fig. 5 and Fig. 6, it is common that the reflectance at longer wavelength decreases as nano-CdS loading amounts within 2D nanocomposite PhCs increase.
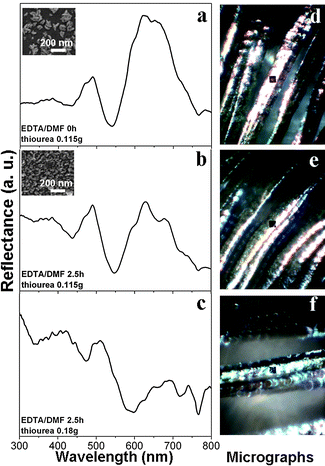 |
| | Fig. 5 The reflection spectra (a–c) of nano-CdS/feathers (red) at normal incidence and normal reflection with different nano-CdS loading amounts (a < b < c). The detection area of each spectrum is monitored in real time and is shown by a black square (20∼30μm) in the micrograph displayed on the right side (d–f). Experimental conditions are indicated in the bottom-left in (a–c). Insets in (a) and (b) present corresponding FESEM images. | |
 |
| | Fig. 6 The reflection spectra of nano-CdS/feathers at normal incidence and normal reflection with different nano-CdS loading amounts. (a) Nano-CdS/feathers (green), (b) nano-CdS/feathers (brown). Corresponding FESEM images and photographs are displayed on the right side. | |
Influence of collecting angle
Like other PhCs, as-prepared nanocomposite PhCs show angle-dependent optical properties that can be observed by both the naked eye and reflection spectra. Fig. 7 shows the photographs of nano-CdS/wing (E. mulciber) obtained from different angles. It should be mentioned that the structural color of the nanocomposite PhCs appears most brilliant when observed at a certain angle (Fig. 7a), while it becomes faded when observed from the other side (Fig. 7c). This phenomenon could be explained by the specific quasi 1D PhC structures in the nano-CdS/wing (E. mulciber) as revealed by FESEM (Fig. 1) and illustrated at the top half of Fig. 7. Since the parallel lamellars lean against the substrate, the most brilliant color that occurs perpendicular to the lamellars would be observed at a certain angle by the naked eye (Fig. 7a). Moreover, angle-dependent optical properties also exist in nano-CdS/feathers. In order to measure the reflection spectra at different angles, tweezers were used to disorder the natural alignment of barbules (Fig. 5d-5f). Thus, there was an angle between the fixed detecting direction (normal incidence and normal reflection to the sample support) and the inclined barbules as shown in Fig. 8b and 8c. Fig. 8a displays corresponding angle-dependent reflection spectra. Due to the highly angle-dependent optical properties, even the naturally aligned barbules show differences in brightness along the sample surface under micrograph observation (Fig. 5d-5f), considering that the bright parts are not parallel to the dark parts. Therefore, both 1D and 2D nanocomposite PhCs show angle-dependent optical properties, which would attract great interest in applications.
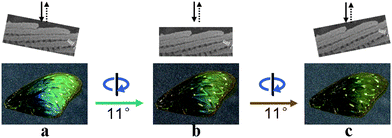 |
| | Fig. 7 The photographs of nano-CdS/wing (E. mulciber) with quasi 1D PhC structure at different angles. The diagram above each photograph illustrates the observation angle at the microscale. (b) was taken at the normal direction. | |
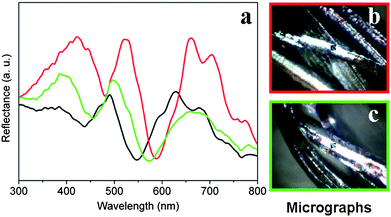 |
| | Fig. 8 (a) The reflection spectra of nano-CdS/feathers (red) at different directions. Black line represents the reflection spectra at normal incidence and normal reflection. (b) and (c) are real-time micrographs corresponding to the red line and green line, respectively. The detection areas are shown by the black squares (20∼30μm) in the micrographs. | |
Conclusion
Several representative natural periodic structures in the wings of butterflies Papilio paris and Euploea mulciber and peacock feathers have been demonstrated to be convenient PhC bio-matrices to incorporate nano-CdS to finally achieve novel nanocomposite PhCs with typical 1D, quasi 1D and 2D PhC structures. 1D nanocomposite PhCs show one main red-shifted reflection band, while 2D nanocomposite PhCs display more complex reflection spectra than the original one. With different structural parameters, 2D nanocomposite PhCs show double reflection bands in the blue and green parts, and three reflection bands in the brown and yellow parts. The increase of nano-CdS loading in 2D nanocomposite PhCs results in a decrease of reflectivity at longer wavelength. Besides, both 1D and 2D nanocomposite PhCs show angle-dependent optical properties. These results suggest the possibility of tuning photonic band structures in several ways in this novel system, and could inspire the design of future nanocomposite PhCs.
Acknowledgements
Financial support from National Natural Science Foundation of China (No. 50671065), the National 973 Project (No. SQ2010CB081817), Shanghai Science and Technology Committee (Nos. 10JC1407600, 09ZR1414700, 09520703400) and Sino-French Project of China (No. 2009DFA52410) are gratefully acknowledged. The authors thank Leyan Zhuang, Zhirong Wang and Chundong Wang (Shanghai Anti-counterfeiting Technical Products Testing & Evaluation Center) for the measurements of the reflection spectra and the acquirement of the micrographs, and SJTU Instrument Analysis Center for FESEM measurements.
Notes and references
- E. Yablonovitch, Phys. Rev. Lett., 1987, 58, 2059 CrossRef CAS; S. John, Phys. Rev. Lett., 1987, 58, 2486 CrossRef CAS.
- C. Paquet, F. Yoshino, L. Levina, I. Gourevich, E. H. Sargent and E. Kumacheva, Adv. Funct. Mater., 2006, 16, 1892 CrossRef CAS.
- F. Fleischhaker and R. Zentel, Chem. Mater., 2005, 17, 1346 CrossRef CAS.
- S. G. Romanov, D. N. Chigrin, C. M. S. Torres, N. Gaponik, A. Eychmüller and A. L. Rogach, Phys. Rev. E: Stat., Nonlinear, Soft Matter Phys., 2004, 69, 046606 CrossRef CAS.
- A. Blanco, C. Lopez, R. Mayoral, H. Miguez, F. Meseguer, A. Mifsud and J. Herrero, Appl. Phys. Lett., 1998, 73, 1781 CrossRef CAS.
- Y. Lin, J. Zhang, E. H. Sargent and E. Kumacheva, Appl. Phys. Lett., 2002, 81, 3134 CrossRef CAS.
- C. Wang, J. Roither, R. Kirschschlager, M. V. Kovalenko, M. Brehm, T. Fromherz, Q. Kan, P. Tan, J. Liu, H. Chen and W. Heiss, Appl. Phys. Lett., 2009, 95, 053107 CrossRef.
- J. Li, B. Jia, G. Zhou, C. Bullen, J. Serbin and M. Gu, Adv. Mater., 2007, 19, 3276 CrossRef CAS; Z. B. Sun, X. Z. Dong, S. Nakanishi, W. Q. Chen, X. M. Duan and S. Kawata, Appl. Phys. A: Mater. Sci. Process., 2007, 86, 427 CrossRef CAS.
- H. Yan, C. F. Blanford, B. T. Holland, W. H. Smyrl and A. Stein, Chem. Mater., 2000, 12, 1134 CrossRef CAS.
- C. Lopez, Adv. Mater., 2003, 15, 1679 CrossRef CAS.
- V. K. S. Hsiao, K. T. Yong, A. N. Cartwright, M. T. Swihart, P. N. Prasad, P. F. Lloyd and T. J. Bunning, J. Mater. Chem., 2009, 19, 3998 RSC.
- X. Wu, A. Yamilov, X. Liu, S. Li, V. P. Dravid, R. P. H. Chang and H. Cao, Appl. Phys. Lett., 2004, 85, 3657 CrossRef CAS.
- J. H. Moon and S. Yang, Chem. Rev., 2010, 110, 547 CrossRef CAS.
- M. Campbell, D. N. Sharp, M. T. Harrison, R. G. Denning and A. J. Turberfield, Nature, 2000, 404, 53 CrossRef CAS.
- P. Vukusic and J. R. Sambles, Nature, 2003, 424, 852 CrossRef CAS.
- S. Kinoshita and S. Yoshioka, ChemPhysChem, 2005, 6, 1442 CrossRef CAS.
- P. Vukusic, J. R. Sambles and C. R. Lawrence, Nature, 2000, 404, 457 CrossRef CAS; P. Vukusic and I. Hooper, Science, 2005, 310, 1151 CrossRef CAS.
- S. Yoshioka and S. Kinoshita, Opt. Express, 2007, 15, 2691 CrossRef.
- S. Berthier, J. Boulenguez and Z. B'alint, Appl. Phys. A: Mater. Sci. Process., 2006, 86, 123 CrossRef.
- P. Vukusic, R. Sambles, C. Lawrence and G. Wakely, Appl. Opt., 2001, 40, 1116 CrossRef CAS.
- S. Yoshioka and S. Kinoshita, Forma, 2002, 17, 169 Search PubMed.
- J. Zi, X. Yu, Y. Li, X. Hu, C. Xu, X. Wang, X. Liu and R. Fu, Proc. Natl. Acad. Sci. U. S. A., 2003, 100, 12576 CrossRef CAS.
- A. Henglein, Chem. Rev., 1989, 89, 1861 CrossRef CAS.
- A. Blanco, H. Miguez, F. Meseguer, C. Lopez, F. Lopez-Tejeira and J. Sanchez-Dehesa, Appl. Phys. Lett., 2001, 78, 3181 CrossRef CAS.
- J. Zhang, N. Coombs and E. Kumacheva, J. Am. Chem. Soc., 2002, 124, 14512 CrossRef CAS.
- J. Han, H. Su, D. Zhang, J. Chen and Zhixin Chen, J. Mater. Chem., 2009, 19, 8741 RSC.
- J. Han, H. Su, F. Song, J. Gu, D. Zhang and L. Jiang, Langmuir, 2009, 25, 3207 CrossRef CAS.
- D. Buso, E. Nicoletti, J. Li and M. Gu, Opt. Express, 2010, 18, 1033 CrossRef CAS.
- S. A. Grudinkin, S. F. Kaplan, N. F. Kartenko, D. A. Kurdyukov and V. G. Golubev, J. Phys. Chem. C, 2008, 112, 17855 CrossRef CAS; Z. A. Sechrist, B. T. Schwartz, J. H. Lee, J. A. McCormick, R. Piestun, W. Park and S. M. George, Chem. Mater., 2006, 18, 3562 CrossRef CAS.
|
| This journal is © The Royal Society of Chemistry 2010 |
Click here to see how this site uses Cookies. View our privacy policy here. 


