Nanoscale heterogeneities in CeO2–ZrO2 nanocrystals highlighted by UV-resonant Raman spectroscopy†
Takaaki
Taniguchi
a,
Tomoaki
Watanebe
b,
Satoshi
Ichinohe
b,
Masahiro
Yoshimura
a,
Ken-ichi
Katsumata
a,
Kiyoshi
Okada
a and
Nobuhiro
Matsushita
*a
aMaterials and Structures Laboratory, Tokyo Institute of Technology, 4259 Nagatsuta, Midori-ku, Yokohama, 226-8503, Japan
bDepartment of Applied Chemistry, School of Science and Technology, Meiji University, 1-1-1 Higashimita, Tama-ku, Kawasaki, 214-8571, Japan
First published on 20th May 2010
Abstract
Selection of the excitation wavelength at nonresonant and resonant Raman conditions provided detection selectivity in the tetragonal and cubic phases in CeO2–ZrO2 nanocrystals, respectively. It was suggested that cubic-phase domains containing Ce3+ deficiencies were involved in the tetragonal-phase matrix.
Recently, much effort has been expended to decrease the emission of pollutant gases such as CO, NOx, and hydrocarbons for the protection of the global environment. CeO2-based materials offer properties suitable for a three-way catalyst for treating exhaust gasses from automobiles, owing to their oxygen storage capacities (OSC) and redox properties from the reversible oxidation/reduction of Ce4+ ↔ Ce3+.1 In particular, researchers have intensively investigated CeO2–ZrO2 mixed oxides due to their efficient catalytic properties.2
Several contributions of Zr4+ substitution have been suggested for the enhancement of catalytic properties. For example, such substitutions can strongly suppress the sintering of the catalyst and loss of performance over time at elevated temperatures, so maintaining the surface area (or number of active surface sites) of the initial materials.2 These substitutions also impact the crystalline phase; the materials crystallize into monoclinic and cubic as well as tetragonal phases involving metastable t′ and t″ phases,3 depending on the chemical composition and the preparative method. These diverse structural alternatives also relate to the enhancement of the catalytic properties.
In addition to these traditional mechanisms, Mamontv et al. recently suggested that Ce0.5Zr0.5O2 nanocrystals exhibit two crystalline and/or compositional phases in an identical grain, and such nanoscale heterogeneities play a key role in the enhancement of the performance on the basis of a pair-distribution function (PDF) analysis using neutron-diffraction data and a temperature programmed reduction (TPR) analysis.4 Montini et al. further supported this structural model by using site-selective Eu3+ luminescence.5 However, the heterogeneities were so complex that neither Mamontv's nor Montini's work yielded any identification of a secondary phase, whereas the primary t″ phase must have been contained. Furthermore, neither suggested a formation mechanism.
In this communication, we investigated the debatable aspects of these materials by using UV-Raman spectroscopy with a 363.8 nm laser line. Raman spectroscopy is an available, nondestructive, and rapid analytical technique for investigating the electronic and phonon structures of materials. These excellent characteristics have motivated intensive Raman studies for CeO2-based materials.6 Moreover, we recently demonstrated that when the band-gap energy of pure and Re3+ doped CeO2 materials matched the UV-excitation energy (363.8 nm in wavelength), the second order Raman bands were dramatically enhanced.7 Owing to the resonant Raman effect, we succeeded in the identification of the local-defect structure in the materials. Herein, we employed this effective analytical method for the investigation of the structural properties of CeO2–ZrO2 nanocrystals and discussed the nanoscale heterogeneities involved.
We prepared Ce1−xZrxO2 nanocrystals in which x = 0, 0.5, or 0.8, using a hydrothermal method at 200 °C for 6 h and subsequent annealing at 800 °C for 5 h. (The experimental details are provided in the ESI†.) According to the phase diagram, CeO2 in a cubic phase was thermodynamically stable at room temperature, while Ce0.5Zr0.5O2 and Ce0.2Zr0.8O2 were metastable. Among these compounds, Ce0.5Zr0.5O2 is most important for catalysis as it is expected to offer the most useful properties in a binary system.
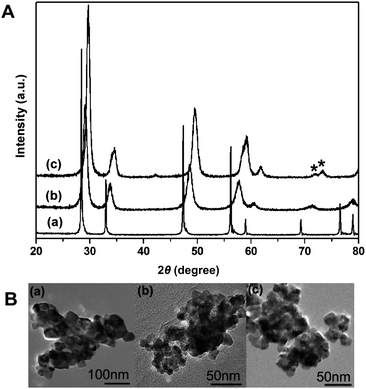
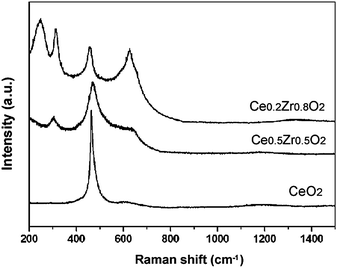
First, we employed conventional analytical methods (X-Ray Diffraction (XRD) and visible-Raman spectroscopy) to evaluate the overall structural properties; this approach was first developed by our group3 and has become very common for the phase analysis of CeO2–ZrO2 materials. Fig. 1A shows XRD patterns of the CeO2–ZrO2 nanocrystals. The crystallite sizes were 59.8, 10.3, and 13.2 nm for the CeO2, Ce0.5Zr0.5O2, and Ce0.2Zr0.8O2 samples, respectively, using the Debye–Scherrer formula. These sizes generally correspond well to those observed by transmission electron microscopy (see Fig. 1B). The patterns of Ce1−xZrxO2 (x = 0 or 0.5) and Ce0.2Zr0.8O2 corresponded to the cubic and tetragonal (t′) phases, respectively, while visible-Raman spectra (Fig. 2) indicated that cubic and tetragonal phases are formed for pure CeO2 and the other samples, respectively.3 A summary of these results indicated that CeO2, Ce0.5Zr0.5O2, and Ce0.2Zr0.8O2 exhibit cubic, t″, and t′ phases, respectively. These results were in good agreement with the previous studies,8 and the nanoscale heterogeneities were not detectable by the conventional analytical methods.
 | ||
| Fig. 1 (A) XRD patterns and (B) TEM images of (a) CeO2, (b) Ce0.5Zr0.5O2 and (c) Ce0.2Zr0.8O2nanocrystals. Asterisks present (004)/(400) tetragonal (t′) distortion. | ||
 | ||
| Fig. 2 Vis Raman spectra of CeO2–ZrO2 nanocrystals. | ||
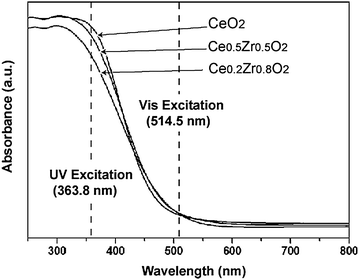
We investigated the optical absorption properties by UV-Vis diffuse reflection spectroscopy. As shown in Fig. 3, the Zr4+ substitution yielded no significant alterations in the optical absorption properties so that the excitation energy was comparable with the band-gap energy, ensuring that the UV-excitation energy was well matched to the resonant Raman conditions of all the samples.
 | ||
| Fig. 3 UV-Vis diffuse reflection spectra of CeO2–ZrO2 nanocrystals. | ||
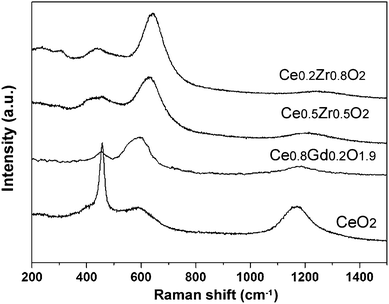
Fig. 4 displays the UV-Raman spectra. Owing to the resonant Raman effects, the features shown in these spectra were different from those seen in the visible spectra. The first notable point was that we observed the low frequency bands (approximately 250 and 302 cm−1) from the tetragonal phase only in the Ce0.2Zr0.8O2 sample, while the peaks at approximately 600 cm−1 and 1200 nm−1 appeared for all samples. The bands at 600 cm−1 and 1200 nm−1 corresponded to the defect-induced (D) band and second overtone band of the longitudinal optic (2LO) mode in the cubic phase, respectively, which would be strongly enhanced in the resonant Raman condition.7 In fact, the Ce0.5Zr0.5O2 nanocrystals show similar spectra to UV spectra of Ce0.8Gd0.2O1.9 nanocrystals with the cubic phase studied in our earlier work.7 Therefore, the presence of these bands indicated that the Ce0.5Zr0.5O2 nanocrystals, previously assigned as the t″ phase, involve a secondary phase identified as a cubic phase. We highlight this heterogeneity for the first time in the present study. Furthermore, the strong detection of bands from the cubic phase, even in Zr-rich t′ phase samples (Ce0.2Zr0.8O2), demonstrated that UV-Raman spectroscopy can selectively detect a cubic phase, while visible spectroscopy is sensitive to the tetragonal phase.
 | ||
| Fig. 4 UV Raman spectra of CeO2–ZrO2 nanocrystals. Note that UV Raman spectra of 3.2 nm Ce0.8Gd0.2O1.9 nanocrystals are shown for comparison. | ||
Careful investigation of the spectra revealed a detailed structure of the cubic phase. As shown in the UV-Raman spectra, the Raman active F2g band at 470 cm−1 from the cubic phase broadened and weakened, while the defect-related bands at 400 cm−1 and 600 cm−1 grew more pronounced with increasing Zr4+ concentration. These trends indicated that Zr4+ doping induced defects in the cubic structure. Particularly, the band at 600 cm−1 was due to the Ce3+ deficiency,6,7 indicating a Zr4+ substitution induced Ce3+ deficiency in the cubic domain. Note that the pure ceria nanoparticles also show the band in the resonant Raman spectra because of the presence of Ce3+ spices due to the size effect.7 However, the relative band intensity of the band to the F2g band observed in the Ce0.5Z0.5O2 sample is much higher than smaller undoped-ceria nanoparticles (ca. 5 nm size),7 which indicates that the size effect or high surface area is not the predominant reason for the strong detection of the Ce3+-related band in the resonant Raman spectra of CeO2–ZrO2 solid solution nanocrystals. Based on the X-ray absorption fine structure (XAFS) analysis, Zhang et al. have also observed the increase in the Ce3+ concentration with Zr4+ doping.9 They have suggested that Ce3+ (1.039 Å) with a larger ionic radius than both Ce4+ (0.97 Å) and Zr4+ (0.84 Å) was formed to decrease the total lattice-strain energy that accumulated due to the large interval between the ionic radii of Ce4+ and Zr4+.
Along with the band intensity at 600 cm−1, the band position showed a strong dependency on the chemical composition. The bands clearly shifted toward a higher energy level with an increase in the Zr4+ concentration. For the CeO2–ZrO2 binary system, the lattice shrinkage occurred due to the substitution of the larger Ce4+ ion by the smaller Zr4+ ion as clearly shown in the higher-angle shift of the diffraction peak with an increasing Zr4+ concentration (Fig. 1). This substitution would result in the reduced average length of the M–O bond (M = Ce or Zr). Consequently, the force constants corresponding to the vibrations of the M–O bond would increase, leading to the detectable high-energy shift in the Raman band. Note that we observed the same tendency in the band position for the 2LO band (1200 cm−1), which also indicated an increase of the phonon energy in the cubic phase with Zr4+ substitution. On this basis, the high-energy shift in the Raman band positions with Zr4+ substitution, accompanying the lattice shrinkage, supported the possibility that the phase heterogeneities were involved in an identical grain rather than being present in separate grains. Summarizing the current and previous studies available so far, we suggest that the cubic-phase nanodomains involving Ce3+ cations formed within the tetragonal-phase matrix, and as a result, the lattice strain in the mixed oxides was relaxed. This mechanism has a possibility for the formation of heterogeneities in CeO2–ZrO2 nanocrystals, presumably contributing to their efficient redox properties.
In conclusion, we employed UV-resonance Raman spectroscopy to come to an in-depth understanding of the local structure of the Ce1−xZrxO2 nanocrystalline catalysis. For the first time, this novel, simple, and effective method clarified the presence of a secondary phase identified as the cubic phase in mixed oxide nanocrystals even in cases where they are characterized as the t′ or t″ phase by XRD and visible-Raman spectroscopy. Furthermore, we revealed that the cubic phase contained Ce3+ cations, which likely relaxed the lattice strain accumulated due to the large interval between the Ce4+ and the Zr4+ ions in ionic radii. The high-energy shift in the Raman band positions with Zr4+ substitution indicated that the cubic and tetragonal phases coexisted in an identical grain. Owing to the availability and excellent detection sensitivity of the local structure, combination analysis using visible- and UV-Raman spectroscopy was very useful in studying the structural properties of Ce1−xZrxO2 catalysis at the nanoscale.
Notes and references
- (a) J. Kaspar, P. Fornasiero and M. Graziani, Catal. Today, 1999, 50, 285 CrossRef CAS; (b) A. Trovarelli, C. de Leitenburg, M. Boaro and G. Dolcetti, Catal. Today, 1999, 50, 353 CrossRef CAS.
- R. Di Mont and J. Kaspar, J. Mater. Chem., 2005, 15, 633 RSC.
- M. Yashima, H. Arashi, M. Kakihana and M. Yoshimura, J. Am. Ceram. Soc., 1994, 77, 1067 CrossRef CAS.
- E. Mamontov, R. Brezny, M. Koranne and T. Egami, J. Phys. Chem. B, 2003, 107, 13007 CrossRef CAS.
- T. Montini, A. Speghini, L. De Rogatis, B. Lorenzut, M. Bettinelli, M. Graziani and P. Fornasiero, J. Am. Chem. Soc., 2009, 131, 13155 CrossRef CAS.
- (a) J. E. Spanier, R. D. Robinson, F. Zheng, S. W. Chan and I. P. Herman, Phys. Rev. B: Condens. Matter, 2001, 64, 245407 CrossRef; (b) A. Nakajima, A. Yoshihara and M. Ishigame, Phys. Rev. B: Condens. Matter, 1994, 50, 13297 CrossRef CAS; (c) W. H. Weber, K. C. Hass and J. R. McBride, Phys. Rev. B: Condens. Matter, 1993, 48, 178 CrossRef CAS.
- T. Taniguchi, T. Watanabe, N. Sugiyama, A. K. Subramani, H. Wagata, N. Matsushita and M. Yoshimura, J. Phys. Chem. C, 2009, 113, 19789 CrossRef CAS.
- (a) A. Ahniyaz, T. Watanabe and M. Yoshimura, J. Phys. Chem. B, 2005, 109, 6136 CrossRef CAS; (b) F. Zhang, C. H. Chen, J. C. Hanson, R. D. Robinson, I. P. Herman and S. W. Chan, J. Am. Ceram. Soc., 2006, 89, 1028 CrossRef CAS.
- F. Zhang, C. H. Chen, J. M. Raitano, J. C. Hanson, W. A. Caliebe, S. Khalid and S. W. Chan, J. Appl. Phys., 2006, 99, 084313 CrossRef.
Footnote |
| † Electronic supplementary information (ESI) available: Preparation procedures and measurement conditions. See DOI: 10.1039/c0nr00040j |
| This journal is © The Royal Society of Chemistry 2010 |
