A density functional study of strong local magnetism creation on MoS2 nanoribbon by sulfur vacancy
Reza
Shidpour
a and
Merhrdad
Manteghian
*b
aInstitute for Nanoscience and Nanotechnology, Sharif University of Technology, Tehran, Iran
bDepartment of Material Science, Tarbiat Modares University, Tehran, Iran. E-mail: manteghi@modares.ac.ir; Fax: +98 21 88003128; Tel: +98 21 82883128
First published on 18th May 2010
Abstract
In this study a low-width MoS2 ribbon has been used for probing the electronic structure and local magnetic moment near vacancies. A theoretical study with the full-potential Density Functional Theory (DFT) approach (Wien2K code) have shown that when the dimension of MoS2 is reduced from 2-D to 1-D the nonmagnetic semi-conductor MoS2 becomes a magnetic conductor. Our study has shown that a vacancy on the S-edge with 50% coverage intensifies the magnetization of the edge of the MoS2 nanoribbon but such a vacancy on S-edge with 100% coverage causes this magnetic property to disappear. It is concluded that in both of them, there are positive or negative strong gradients of local magnetic moment near the vacancy. This may explain why lattice defects are essential for catalysis processes.
1. Introduction
Molybdenum-based catalysts are ranked first for hydrodesulfurization. In order to continue to improve these catalysts, a detailed understanding of the morphology, edge structure, active sites, and interactions between molecules and active sites is necessary. MoS2 nanostructures such as nanoclusters1–3 and nanoribbons4 have been studied as potential hydrodesulfurization catalysts.Bulk MoS2 has a layered structure with molybdenum atoms in a plane situated between two sulfur planes for each S–Mo–S slab. Recent scanning tunneling microscopy studies revealed the occurrence of surface reconstruction, metallic edge and vacancies as catalytic active sites in nanosized molybdenum sulfide clusters with two major shapes, triangular and hexagonal.5 It is observed that the edge-terminated conformation plays an important role in hydrodesulfurization catalysis whereas fullerene-like MoS2 with a basal-planes conformation has no catalytic activity.6
Another form of an MoS2 nanostructure is the nanoribbon. It consists of S–Mo–S layers with a ribbon shape formed by cutting the MoS2 sheet along the longitudinal direction.7,8
The clusters and ribbons are terminated to either the Mo-edge or S-edge. The edge atoms do not always obey the proportions of the bulk material due to changes in the stoichiometry and coordination number.9 The Mo-edge is sometimes fully or partially covered by S atoms as S dimers. It is shown that the vacancies formed by removing S atoms from the edge yielding coordinatively unsaturated (cus) Mo sites, play a key role in the catalytic activity of MoS2.10
Theoretical investigations have often been focused on the study of the structure and morphology of MoS2 clusters,11 location of active sites,12 effects of size on the cluster properties,13 vacancy formation,14 MoS2 edge structures,15 and adsorption of molecules on the surface and edge of molybdenum disulfide.16,17
Since vacancies on the edges of nanoclusters or nanoribbons are important for catalytic activity, the electronic structure of edges in the presence of vacancies should be investigated. In addition to the electronic structure, the magnetic properties are of importance because a size reduction of the particle affects the magnetic moments.
Some theoretical works have reported on the electronic structure in the presence of vacancies, such as the work done by Spirko et al. who investigated the bonding and activation of hydrogen near a surface vacancy.18 Magnetic properties of MoS2 nanostructures have rarely been investigated. The role of vacancies in creating a local magnetization near the edge of MoS2 nanoclusters and nanoribbons has not been investigated.
Murgan et al. showed that MonS2n clusters have a magnetic moment.19 In another work Zhang et al. grew magnetic molybdenum disulfide nanosheet films and calculated the magnetic moment in triangular-shaped MoS2 nanosheets of various sizes.20 In our previous work, it has been shown that the reduction of the dimension of MoS2 from 2-D to 1-D (such as nanoribbon MoS2) results in a magnetization of the material.21 The magnetization can be related to changing the coordination number of unsaturated S or Mo atoms on the edges.
In the present work, we use a nanoribbon MoS2 as a catalytic model and investigate how a vacancy can create or intensify a strong local magnetization near the edge of a nanoribbon.
2. Computational method
The calculations reported in this work have been done according to the Wien2K program developed by Blaha and co-workers.22 The program uses the full-potential linearized augmented plane wave plus local orbital23 approach (APW + lo) based on the density functional theory.24 For the exchange and correlation potentials, we used the Perdew and Wang 91 implementation of the GGA.The separation energy between core and the valance electrons is −6.0 Ry. The Muffin Tin radii used are 1.83 a.u. for Mo, 1.62 a.u. for SRmin × Kmax = 7 and Gmax = 10, k = 2645 which corresponds to 164 k-points in the irreducible Brillouin zone (BZ), and the tests showed that the properties had converged at this level of BZ integration.
3. Structure models
Our original goal was to find the consequences of creating a vacancy near the edge of MoS2 nanoclusters/nanoribbons. The inner surface atoms of nanoclusters correspond to an infinitely extended 2-D sheet of a single-layer MoS2. Initially, an infinitely extended two- dimensional sheet of a single-layer MoS2 was constructed. This structure is representative of the two-dimensional MoS2.The structure representing a MoS2 nanoribbon in the computation consists of the single-layer MoS2 with a three unit cell width in the y-direction but infinitely extended in the x-direction. The scheme of this supercell is shown in Fig. 1, left.
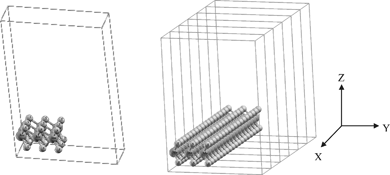 | ||
| Fig. 1 Left: 3 × 3 super cell of a one dimensional MoS2 with vacuum in the x and z direction. there is 27 atoms in the supercell (S atoms). Right: the 1-D single-layer MoS2 resulted in extending of 3 × 3 super cell of a one dimensional MoS2 single. (bright circle) Mo atoms (dark circle). | ||
We first optimized the lattice parameters of the bulk MoS2 with 23 × 23 × 5 k-mesh. Then the optimized lattice parameters were used to produce the supercell for infinitely extended two-dimensional sheet of a single-layer MoS2. Then the optimization of the supercell related to the nanoribbon structure was done. Two structures of nanoribbons were constructed with regard to two types of edges. One corresponds to 100% S coverage with slight shape alterations and the second to 50% S coverage. These configurations of atoms are called S-edge with 100% coverage of S atoms (Fig. 2, left) with abbreviation S-edge-100 and S-edge with 50% coverage of S atoms with abbreviation S-edge-50 (Fig. 2, right).
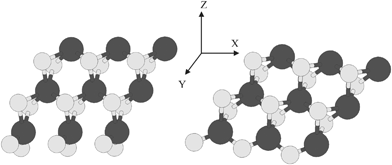 | ||
| Fig. 2 Left: ribbon-like structure with various edges structure of S edge with 100% coverage of S atoms. Right: Ribbon-like structure with two types of edge. The ribbon has S edge with 50% S coverage. S and Mo atoms are shown by bright and dark circles, respectively. | ||
The vacancies that are mainly responsible for the catalytic behavior of MoS2 catalysts are created by removing one or two sulfur atoms from the S-edge nanoribbon or cluster.
The last group of structures that were theoretically studied were constructed by removing one S atom from the nanoribbon structure aiming to study changes in the physical properties due to the vacancy. They are labelled vacancy-bearing structures.
The structure of the S edge with 100% S coverage containing S vacancy with abbreviation S-edge-100-vacancy is shown in Fig. 3, left. Also the structure of the S edge with 50% S coverage containing S vacancy with abbreviation S-edge-50-vacancy is shown in Fig. 3, right.
 | ||
| Fig. 3 Two types of vacancies: (left) S edge with a 100% S coverage containing an S vacancy; (right) S edge with 50% S coverage containing an S vacancy. S and Mo atoms are shown by bright and dark circles respectively. | ||
After construction and optimization of the computational structures, the electronic and magnetic properties of each structure were calculated.
The density of states (DOS) and the magnetic properties of 2-D MoS2 and 1-D MoS2 were determined in a previous work.21 Here the electronic properties of three types of vacancy structures described above are explained. The values of the magnetic moments on edge and near the vacancy are calculated. It is concluded that the local magnetization around vacancies varies strongly.
4. Results and discussion
4.1. Structural properties
In bulk MoS2 (with the space group P63/mmc), the unit cell of MoS2 has a hexagonal symmetry. The lattice parameters a, b and c were optimized by minimizing the total energy. The optimized lattice parameters are c = 23.075 a.u, a = b = 5.990 a.u. The experimental values are c = 23.788 a.u (12.584 Å) and a = 5.974 a.u (3.160 Å).25We used a 3 × 3 supercell in the x and y directions in order to determine the properties of the one-dimensional MoS2. Then we put a 20-bohr vacuum in the y and z direction leading to an infinite expansion in the x direction. This structure can be considered as a quantum wire of MoS2 with almost 10 Å (9.522 Å) width that consists of a three-layer S–Mo–S slab. The positions of all the atoms in the supercell were fully relaxed during the geometry optimizations. On the basis of the equilibrium structures, 32 k points were then used to compute the electronic band structures. The scheme of this supercell is shown in Fig. 1, left.
In one-dimensional MoS2, the total energies are calculated after determine the equilibrium lattice constants. The optimized lattice parameters are c = 42.588 a.u., b = 18.045 a.u. and a = 38.195 a.u.
In previous investigations, it has been shown that there are various types of edges in a MoS2 nanocluster.20 There are two major configurations of S and Mo atoms that are important in catalysis. They include the S-edge with 100% coverage of S atoms (with the abbreviation S-edge-100) (Fig. 2, left) and the S-edge with 50% coverage of S atoms (with the abbreviation S-edge-50) (Fig. 2, right).
The catalytic active sites are S vacancies created by elimination of S atoms. The structures containing a vacancy are ribbon structures in which one S atom is omitted from the edge. There are two structures containing S vacancies. They are called by the name of edge structure related to them. The structure of the S edge with 100% S coverage containing an S vacancy (S-edge-100-vacancy) is shown in Fig. 3, left. The other vacancy-containing MoS2 nanoribbon is the structure of the S edge with 50% S coverage containing S vacancy (S-edge-50-vacancy), shown in Fig. 3, right.
4.2. Electronic properties
After optimization of the structures, the density of states (DOS) of bulk and 1-D MoS2 have been calculated. The aim is to find out what happens when the spacious dimension in molybdenum disulfide is reduced.For a better comparison, it should be kept in mind that the bulk MoS2 is a semi-conductor with an experimental band gap of 1.29 eV.26 The difference of the DOS between bulk MoS2 and 1-D MoS2 is shown in Fig. 4, left and right, respectively.
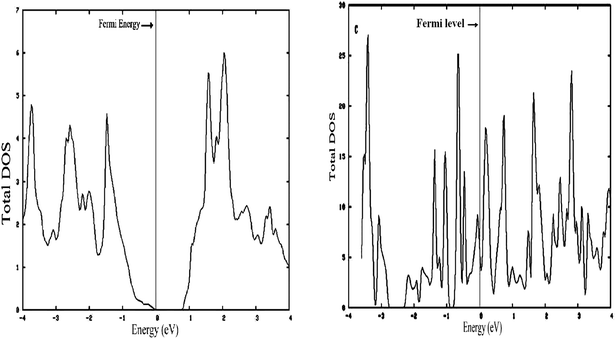 | ||
| Fig. 4 (Left) Density of states (DOS) 3-D MoS2. (Right) Density of states (DOS) S edge with 50% coverage as 1-D MoS2. | ||
As shown in Fig. 5, left and 6, left, the one dimensional MoS2 is a metal. In contrast to the bulk (Fig. 4, left) this DOS is completely different leading to the conclusion that the one-dimensional MoS2 has quite different electronic properties than the bulk MoS2. The electronic structure of 1-D MoS2 can be altered by creating an S vacancy on the edge of the ribbon. The DOS changes with the presence of vacancy. Fig. 5, right and 6, right show the DOS for the structure of the mentioned edge with a vacancy.
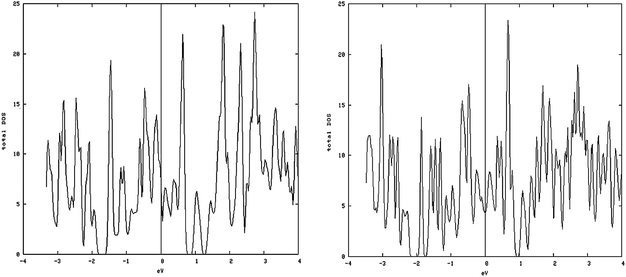 | ||
| Fig. 5 Metal-like DOS of one-dimensional structure: (left) density of states (DOS) of the S edge 10 coverage; (right) S edge 100% containing a vacancy. | ||
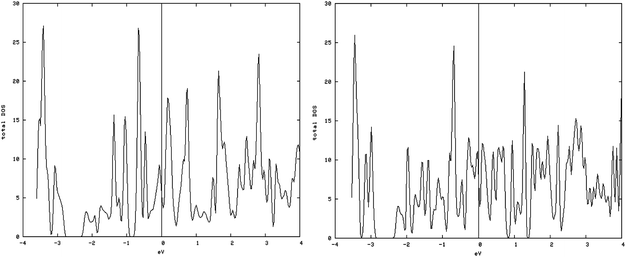 | ||
| Fig. 6 Density of states (DOS) of the containing vacancy structures: (left) DOS of the S edge with 50% coverage; (right) S edge 50% containing a vacancy. | ||
It is readily concluded that, although the band structure of the edge is changed in the presence of a vacancy, these structures retain their metallic characteristics. The ribbon-like structures show a similar behavior. The metallic character of MoS2 nanoclusters has been shown in the experimental investigations.3 The metallic character of the nanoribbon is conserved with the creation of an S vacancy on the edge of the ribbon.
4.3. Magnetic properties
For a distinction between a nonmagnetic and magnetic material, we can use spin-up and spin-down DOS. In a magnetic material the number of spin-up electrons differs from that of the spin-down electrons.It is generally believed that bulk MoS2 is not magnetic. The total magnetic moment in the cell calculated by taking the difference between the number of the spin-up and spin-down electrons, which is only about −0.00091 μB/cell (μB is abbreviation symbol for bohr).
| Type of one-dimensional MoS2 | Total magnetic moment per cell/10−3 μB |
|---|---|
| 100% S coverage S-edge | 962 |
| 50% S coverage S-edge | 425 |
| 100% S coverage S-edge with vacancy | 1 |
| 50% S coverage S-edge with vacancy | 2755 |
4.3.1.1. MoS2 nanoribbon structures (1-D). In our previous work, the magnetic moment of the ribbon-like MoS2 has been determined. The results show that in the MoS2 nanoribbon, the nature of the molybdenum disulfide is different from that of bulk MoS2.
Both types of 1-D structures indicate that both the S-edge-100 and the S-edge-50 are magnetic.21
The results are in agreement with other works such as that of Zhang et al.20 who concluded that in the S-edge terminated triangular clusters, the spontaneous magnetism is due to unsaturated S atoms where the S edge and also the Mo-edge terminated cluster without S coverage have a significant magnetic moment.
4.3.1.2. S vacancy on the S edge with 50% S coverage. The results of calculating the DOS have shown that with creation of vacancy on this type of edge, spin-up DOS and spin-down DOS significantly become different, so this structure is magnetic (Fig. 7, left and right).
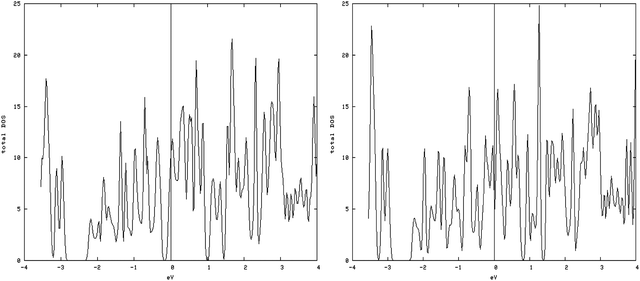 | ||
| Fig. 7 Spin-down (left) and spin-up (right) DOS related to an S edge with 50% coverage containing vacancies. Total magnetic moment is 2.76 μB/cell. | ||
The amount of the total magnetic moment in S-edge-50-vacancy is 2.755μB/cell, beyond that of the total magnetic moment of the S-edge-50 (0.425 μB/cell).
In addition to a change in the value of the total magnetic moment, the values of the local magnetic moments vary. We think that changes in the local magnetic moment due to a vacancy are important and may explain the source of the catalytic activity.
In Fig. 8 the values of the local magnetic moment related to S-edge-50 with and without the vacancy are shown. The creation of an S vacancy on the local magnetic moment can be observed in by comparing (left) and (right) Fig. 8. It is important that both structures are similar despite one missing S atom in the S-edge-50-vacancy.
 | ||
| Fig. 8 Change of local magnetic moments with creation of a vacancy. The local magnetic moment of (left) the S edge with 50% coverage, (right) the S edge with 50% coverage containing a vacancy. The values of local magnetic moments are recorded on S (bright circle) and Mo (dark circle) atoms. | ||
As shown in Fig. 8, left and right, the main portion of total magnetic moment comes from the S edge of the ribbon-like structure. The local magnetic moment of the Mo atom on this edge is 0.048 μB/atom while the local magnetic moment of the Mo atom on Mo edge 0% S coverage is 0.006 (μB/atom). With a creation of the S vacancy on the S-edge-50 and creation of the S-edge-50-vacancy the local magnetic moments increase dramatically. For instance, the value of the local magnetic moment of Mo changes from 0.048 in S-edge-50 (Fig. 8.Left) to 0.266 μB/atom in the S-edge-50-vacancy (Fig. 8.Right). To explain this, it should be noted that the local magnetic moment strongly depends on the coordination number of the Mo atoms, which varies from four in the S-edge-50 to three in the corresponding vacancy system.
When the S vacancy is created along the edge of the ribbon, it breaks the symmetries governing the edge system. The variation of the magnetic moment among the edge of the ribbon is shown in Fig. 9.
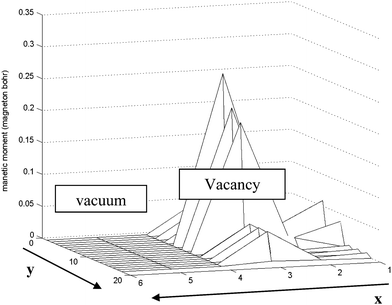 | ||
| Fig. 9 Schematic of variation of magnetic moment along the S edge with 50% coverage of S atoms nanoribbon in the x–y plane. Near the vacancy the local magnetic moments increase rapidly. The length unit is 1 Å in the y direction and 2.5 Å in the x direction. | ||
We have applied periodic boundary conditions. This assumption is valid along the edge near the vacancy in the ribbon. As shown in Fig. 9 the magnetic moment increases dramatically near the vacancy (approximately 7 fold) and it returns to the initial value far away from the vacancy.
4.3.1.3. S vacancy on S edge 100% S coverage. As shown in the spin-up and spin-down DOS plot (Fig. 10, left and right), the S-edge-100 containing an S vacancy (S-edge-100-vacancy) is not magnetic. The total magnetic moment is reduced from 0.962 μB/cell in S-edge-100 to almost zero, 0.001 μB/cell in the S-edge-100-vacancy system. Actually creating an S vacancy ruins the magnetic properties of the S-edge-100 ribbon.
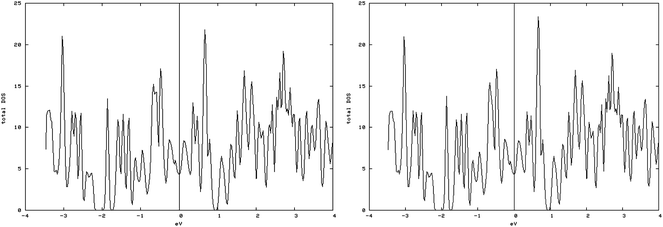 | ||
| Fig. 10 Spin-down (left) and spin-up (right) DOS related to the S edge with 100% coverage containing a vacancy. The similarity of spin-down DOS and spin-up DOS shows that they are non magnetic. | ||
In Fig. (11, right) the value of local magnetic moments related to S-edge-100 containing vacancy has been shown. For instance the magnetic moment of the S atom that has its main portion in the S-edge-100 is 0.016 μB/atom (Fig. 11, left) while this value became 0.00001 (μB/atom) with creation of an S vacancy in S-edge-100 (S-edge-100-vacancy structure). It means that removing one S atom from the edge annihilates the difference between the population of spin-up and spin-down electrons, in contrast with the results obtained when the S-edge-50 (in S-edge-50-vacancy structure) was studied.
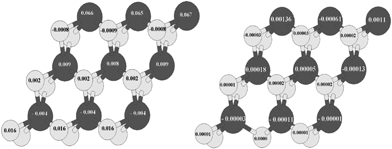 | ||
| Fig. 11 (Left) Local magnetic moment of S edge with 100% coverage and (right) S edge with 50% coverage containing a vacancy. Total magnetic moment is 0.001 μB/cell. The values of the local magnetic moment are recorded on S (bright circle) and Mo (dark circle) atoms. | ||
In order to create a vacancy on S-edge-100, severe variation of the total magnetic moment along the edge is necessary. Actually, the value of magnetic moment approaches zero near the vacancy and returns to the initial value far from the vacancy. The local magnetic moment decreases by 1000 times, and far from the vacancy it suddenly increases by 1000 times. This has been shown in Fig. 12.
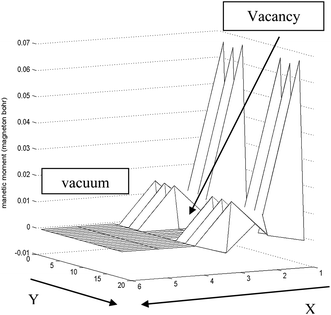 | ||
| Fig. 12 Approximated schematic of variation of magnetic moment along the S edge with 100% coverage of S atoms nanoribbons in the x–y plane. Near the vacancy the local magnetic moment decreases rapidly. The length unit is 1 Å in the y direction and 2.5 Å in the x direction. | ||
5. Conclusions
The MoS2 catalyst is used in catalytic hydrodesulfurization. The electronic structure of MoS2 is mainly responsible for its electronic properties and catalytic behavior. It was found that the 1-D MoS2 with a width of 10 Å is both a conductor and magnetic, whereas bulk MoS2 (3-D) and MoS2 forming an infinite surface (2-D) are semi-conducting and non-magnetic. It is concluded that for the transition from 3-D to 2-D, the electronic structure and the magnetic properties don't change strongly, whereas from 2-D to 1-D the physical properties change substantially.It is generally known that the vacancies are active sites in MoS2 nanoribbons and MoS2 nanoclusters which are utilized as hydrodesulfurization catalysts. Vacancies located on the edge of a MoS2 nanocluster or nanoribbon change the electronic structure and the magnetic properties. In order to find out the general effects of the presence of a vacancy on the electronic structure and its effect on the magnetic properties in particular, the electronic structure of the nanoribbon is studied with and without the vacancy.
It was found that creating an S vacancy can intensify the values of magnetic moment (in the S-edge with 50% S coverage) or annihilate the magnetism (in the S-edge with 100% S coverage).
In previous experimental works such as that by Zhang et al., it has been shown that a MoS2 nanosheet is magnetic.20 However, the origin of magnetization was not made clear. They attributed it to the edge of the nanosheet. In this work we have made it clear that the presence of vacancies plays a much more substantial role in this respect.
It is found in both the S-edge with 50% S coverage and the S-edge with 100% S coverage that the local magnetic moment changes drastically near the vacancy. The increase in the magnetic moment by creating an S vacancy on the S-edge with 50% S coverage is typically 7 fold (from 0.048 to 0.266 μB/atom on the Mo atoms and from 0.425 to 2.748 μB/cell).
Removal of an S atom from the edge of a MoS2 nanoribbon creates a vacancy that can be classified as a F-center. Induction of magnetism by vacancies is also shown in graphene.27 These materials (graphene and MoS2) both have hexagonal closed packed structures.
The decrease in the magnetic moment by creating an S vacancy on the S-edge with 100% S coverage is 1000 fold (from 0.016 to 0.00001 μB/atom in S atoms and from 0.96215 μB/cell to 0.001 μB/cell). We must consider that the presence of the vacancy in this type of edge not only fails to induce more magnetism, but also annihilates the original local magnetic moments.
With regard to changes of the local magnetic moments around an active site, we suggest that it can be used to measure the value of catalytic activity.
It is proposed that the magnetic force microscopy (MFM) tool should be used in order to observe the gradient of total magnetic moment. Advanced magnetic force microscopy (MFM) can be utilized to analyze the local magnetic domains as large as 0.2 μB on the edge with 10 Å size (the size of a supercell). With regard to this point, that the dramatic change of local magnetic field occurs near a vacancy, MFM may be used to identify the location and the properties of such potential catalytic active sites.
Acknowledgements
We thank M. Amin Sabzevari and Mehdi Nasirian of the Sharif University of Technology, for their comments and discussion. We also acknowledge financial supports for this research work from the Iran Nanotechnology Initiative Council.References
- I. Mochida, K. Sakanishi, X. Ma, S. Nagao and T. Isoda, Catal. Today, 1996, 29, 185–189 CrossRef CAS.
- T. Kabe; A. Ishihara; W. Qian; Hydrodesulfurization and Hydrogenation – Chemistry and Engineering, Wiley–VCH, Kodansha, 1999, pp 87–90 Search PubMed.
- J. V. Lauritsen, M. V. Bollinger, E. Lægsgaard, K. W. Jacobsen, J. K. Norskov, B. S. Clausen, H. Topsoe and F. Besenbacher, J. Catal., 2004, 221, 510–522 CrossRef CAS.
- C. M. Zelenski and P. K. Dorhout, J. Am. Chem. Soc., 1998, 120, 734–742 CrossRef CAS.
- J. V. Lauritsen, S. Helveg, E. Lægsgaard, I. Stensgaard, B. S. Clausen, H. Topsøe and F. Besenbacher, J. Catal., 2001, 197, 1–5 CrossRef CAS.
- M. Salmeron, G. A. Somorjai, A. Wold, R. Chianelli and K. Liang, Chem. Phys. Lett., 1982, 90, 105–107 CrossRef CAS.
- G. A. Camacho-Bragado, J. L. Elechiguerra, A. Olivas, S. Fuentes, D. Galvan and M. J. Jose Yacaman, J. Catal., 2005, 234, 182–190 CrossRef CAS.
- G. A. Camacho-Bragado, J. L. Elechiguerra and M. J. Yacaman, Mater. Charact., 2008, 59, 204–212 CrossRef CAS.
- P. Raybaud, J. Hafner, G. Kresse and H. Toulhoat, Surf. Sci., 1998, 407, 237–250 CrossRef CAS.
- H. Topsøe, B. S. Clausen and F. E. Massoth, Hydrotreating catalysis, in Science and Technology, ed. J. R. Anderson, M. Boudartvol. 11, Springer-Verlag, Berlin, New York, 1996, pp 135–147 Search PubMed.
- P. Raybaud, M. Digne, R. Iftimie, W. Wellens, P. Euzen and H. Toulhoat, J. Catal., 2001, 201, 236–246 CrossRef CAS.
- M. Sun, J. Adjaye and A. E. Nelson, Appl. Catal., A, 2004, 263, 131–143 CrossRef CAS.
- T. Zeng, X. Wen;, Y. W. Li; and H. Jiao, J. Phys. Chem. B, 2005, 109, 13704–13710 CrossRef CAS.
- J. Paul and E. Payen, J. Phys. Chem. B, 2003, 107, 4057–4064 CrossRef CAS.
- Y. Aray and J. Rodriguez, J. Mol. Catal. A: Chem., 2007, 265(1–2), 32–41 CrossRef CAS.
- S. Cristol, J F. Paul, C. Schovsbo, E. Veilly and E. Payen, J. Catal., 2006, 239(1), 145–153 CrossRef CAS.
- X. D. Wen, Y. W. Li, J. G. Wang and H. J. Jiao, J. Phys. Chem. B, 2006, 110(42), 21060–21068 CrossRef CAS.
- J. A. Spirko, M. L. Neiman, A. M. Oelker and K. Klier, Surf. Sci., 2003, 542, 192–204 CrossRef CAS.
- P. Murugan, V. Kumar, Y. Kawazoe and N. Ota, Phys. Rev. A: At., Mol., Opt. Phys., 2005, 71, 063203 CrossRef.
- J. Zhang, J. M. Soon, K. P. Loh, J. Yin, J. Ding, M. B. Sullivian and P. Wu, Nano Lett., 2007, 7, 2370–2376 CrossRef CAS.
- R. Shidpour and M. Manteghian, Chem. Phys., 2009, 360, 97–105 CrossRef CAS.
- P. Blaha, K. Schwarz, G. K. H. Madsen, D. Kvasnicka and J. Luitz, wien2k, Karlheinz Schwarz, Techn. Universitt, Wien, Austria, 2001, ISBN 3-9501031-1–2 Search PubMed.
- G. K. H. Madsen, P. Blaha, K. Schwarz, E. Sjöstedt and L. Nordström, Phys. Rev. B: Condens. Matter Mater. Phys., 2001, 64, 195134 CrossRef.
- P. Hohenberg and W. Kohn, Phys. Rev., 1964, 136, B864 CrossRef.
- T. Weber; R. Prins; R. A. van Santen; Transition Metal Sulfides, Chemistry and Catalysis; Vol. 60 of NATO Advanced Study Institute, Series 3: High Technology, Kluwer Academic Publishers, Boston, 1998, pp 52–67 Search PubMed.
- Th. Böker, R. Severin, A. Müller, C. Janowitz, R. Manzke, D. Voß, P. Krüger, A. Mazur and J. Pollmann, Phys. Rev. B: Condens. Matter Mater. Phys., 2001, 64, 235305 CrossRef.
- H. Kumazaki and D. Hirashima, Phys. E., 2008, 40, 1703–1705 CrossRef CAS.
| This journal is © The Royal Society of Chemistry 2010 |
