Metal-free and electrocatalytically active nitrogen-doped carbon nanotubes synthesized by coating with polyaniline
Chen
Jin
a,
Tharamani Chikka
Nagaiah
b,
Wei
Xia
a,
Bernd
Spliethoff
c,
Shanshan
Wang
c,
Michael
Bron
b,
Wolfgang
Schuhmann
b and
Martin
Muhler
*a
aLaboratory of Industrial Chemistry, Ruhr-University Bochum, 44780, Bochum, Germany. E-mail: muhler@techem.rub.de; Fax: +49 234 32 14115
bElektroanalytik & Sensorik, Ruhr-Universität Bochum, 44780, Bochum, Germany
cMax-Planck-Institut für Kohlenforschung, Kaiser-Wilheim-Platz 1, D-45470, Mülheim an der Ruhr, Germany
First published on 16th April 2010
Abstract
Nitrogen doping of multi-walled carbon nanotubes (CNTs) was achieved by the carbonization of a polyaniline (PANI) coating. First, the CNTs were partially oxidized with KMnO4 to obtain oxygen-containing functional groups. Depending on the KMnO4 loading, thin layers of birnessite-type MnO2 (10 wt% and 30 wt%) were obtained by subsequent thermal decomposition. CNT-supported MnO2 was then used for the oxidative polymerization of aniline in acidic solution, and the resulting PANI-coated CNTs were finally heated at 550 °C and 850 °C in inert gas. The samples were characterized by transmission electron microscopy and X-ray photoelectron spectroscopy. A thin layer of carbonized PANI was observed on the CNT surface, and the surface nitrogen concentration of samples prepared from 30% MnO2 was found to amount to 7.6 at% and 3.8 at% after carbonization at 550 °C and 850 °C, respectively. These CNTs with nitrogen-containing shell were further studied by electrochemical impedance spectroscopy and used as catalysts for the oxygen reduction reaction. The sample synthesized from 30 wt% MnO2 followed by carbonization at 850 °C showed the best electrochemical performance indicating efficient nitrogen doping.
1. Introduction
The oxygen reduction reaction (ORR) has attracted much attention in electrochemistry due to its relevance in water electrolysis, fuel cells and electrolysis of brine or aqueous HCl for chlorine production. In the chlorine industry, where HCl is often formed as a by-product, the electrolysis of aqueous HCl is widely used for the recovery of chlorine.1 The energy efficiency related to chlorine production can be remarkably enhanced when the standard cathodic reduction of protons to hydrogen is replaced by the oxygen reduction reaction (ORR) process using so-called oxygen-depolarized cathodes (ODCs). In recent years, Rh-based catalysts, especially RhSx, have been generally recognized as the most promising catalysts for the ORR in hydrochloric acid electrolysis.2,3 Although RhSx catalysts show a higher operational stability, the preparation of this type of catalyst remains a challenge.4 Because Rh is an expensive platinum metal,5 the search for stable low-cost electrocatalysts for the ORR has attracted much attention recently.Tremendous efforts have been made to develop noble metal-free catalysts. Transition metal macrocycles and related derivatives have shown good activities in the ORR, especially Fe–N and Co–N modified carbons.5–7 Different opinions exist on the role of the metals in these systems. Maldonado et al.8 suggested that the metal can facilitate the formation of carbon nanostructures with increased edge plane exposure. Also Matter et al.9 proposed that iron is important for the formation of the active site, but it is assumed not to be a part of it. It was found recently that nitrogen-doped carbon nanotubes possess promising activity for the ORR either in acidic or basic media.10,11
The nitrogen doping methods for CNTs can be divided into two categories: direct synthesis of nitrogen-doped CNTs by arc-discharge, laser ablation, or catalytic chemical vapor deposition (CVD), and post-treatment of regular CNTs by NH3 or N2.12 Recently, conducting polymer/CNT composites employing polyaniline (PANI), polypyrrole, or polythiophene, were intensively studied because of their enhanced electronic and mechanical properties.13 Various methods have been developed to prepare PANI/CNT composites based on chemical oxidative polymerization. Particularly (NH4)2S2O8 and FeCl3 were studied as oxidants for catalyzing the polymerization.14,15 Recently, the carbonization of polyaniline was studied in detail, and the resulting nitrogen-containing carbon materials were applied in supercapacitors and for field emission.16–18
MnO2 can also be used for the polymerization of aniline in the presence of acid.19,20 Pan et al.21 reported the synthesis of PANI nanotubes using a templating method with different phases of MnO2. Here, we applied this method to prepare highly stable composite structures with a CNT core and a nitrogen-doped carbon shell for electrocatalytic applications using PANI as the nitrogen source. The polymerization was found to be localized around the CNTs, which likely results from the electrostatic attraction between the in situ formed positively charged polyaniline and the negatively charged oxygen-functionalized CNTs. The PANI coating was synthesized from a CNT-supported birnessite-type-MnO2 template. After carbonization, a homogeneous N-doped carbon coating was obtained on the CNTs. The electrocatalytic activity of the obtained shell–core samples was tested in the ORR using rotating disk electrode measurements.
2. Experimental
2.1 Preparation of MnO2-coated CNTs by wet impregnation
Multi-walled CNTs with inner diameters of 20–50 nm and outer diameters of 70–200 nm were obtained from Applied Sciences Inc. (Ohio, USA). The as-received CNTs were first treated in inert gas at 800 °C to remove polyaromatic hydrocarbons. In order to prepare MnO2-loaded CNTs (10 wt% and 30 wt% of Mn), two batches of purified CNTs (400 mg) were dispersed in 15.6 ml of 0.05 M KMnO4 and 0.2 M KMnO4, respectively. The suspensions were ultrasonicated for 3 min and then stirred for 30 min at room temperature for a short oxidation to obtain oxygen-functionalized CNTs. The solvent was subsequently evaporated with a rotary evaporator (BÜCHI Rotavapor R-114 equipped with a BÜCHI Waterbath B-480) at 100 mbar and 60 °C for 1 h, followed by drying for another hour at 50 mbar, 60 °C. Both samples were heat treated at 270 °C for 2 h in a constant He flow (150 sccm, 99.99999%) in order to obtain MnO2-coated CNTs.2.2 Preparation of PANI@CNTs
Polyaniline coating on CNTs was achieved via aniline polymerization catalyzed by MnO2 on CNTs. First, suspension (a) was prepared by dispersing 100 mg of MnO2-coated CNTs in 15 ml H2O by sonicating. The suspension was then stored in an ice bath. Solution (b) was then prepared by mixing 100 μL of aniline with 2.8 ml H2SO4 (98%) and 7.2 ml H2O. Subsequently, solution (b) was added to suspension (a) drop by drop under vigorous stirring. After reaction for 4 h, the resulting suspensions were filtered and washed with water several times and dried in an oven at 60 °C overnight. CNT samples with two different Mn loadings were applied. The obtained samples were carbonized at 550 °C or 850 °C under flowing helium (150 sccm) for 2 h to obtain the nitrogen-doped CNTs. A reference sample of polyaniline-coated CNTs was prepared by conventional in situ chemical oxidation with FeCl3. The preparation route of the conducting polymer oxidized by FeCl3 was described in ref. 22. Briefly, a suspension was prepared by dispersing acid treated CNTs (70 mg, nitric acid vapor,23 200 °C, 40 h) into 15 ml of water containing FeCl3 (146 mg, Aldrich 99%). The same solution (b) was then introduced slowly into the suspension. The resulting material was carbonized at 850 °C under flowing helium for 2 h.2.3 Characterization
The elemental analysis was performed with an ICP-OES instrument (type PU701) from Philips-Unicam. X-Ray photoelectron spectroscopy (XPS) measurements were carried out in an ultra-high vacuum (UHV) set-up equipped with a Gammadata-Scienta SES 2002 analyser. The base pressure in the measurement chamber was 2 × 10⁻¹⁰ mbar. Monochromatic Al Kα (1486.6 eV; 14 kV; 55 mA) was used as incident radiation, and a pass energy of 200 eV was chosen resulting in an energy resolution better than 0.5 eV. Charging effects were compensated by a flood gun. Samples were transferred in air. Binding energies were calibrated using the main C 1s peak at 284.5 eV. Thermogravimetry was performed with a Cahn TG-2131 thermobalance in pure O2 with a heating rate of 2 K min−1. Elemental analysis was carried out using an Elementaranalysator varioEL (Elementar Analysensysteme Gmbh, Hanau, Germany) system. The morphology of the samples was studied by scanning electron microscopy (LEO Gemini 1530). High resolution transmission electron microscopy (HRTEM) was performed with a Hitachi HF2000 instrument. XRD was carried out with a Philips X-Pert MPD system with Cu-Kα radiation.Electrochemical impedance spectroscopic (EIS) measurements were carried out using single compartment—a three electrode cell (as mentioned above) connected to a Solartron, 1286 Electrochemical interface, 1250 Frequency response analyser. All EIS measurements were performed at a the formal potential of the Fe2+/Fe3+ redox couple (+200 mV vs. Ag/AgCl) of the potassium hexacyanoferrate (5 mM) in the frequency range of 5 Hz (final) to 40 kHz (initial) with an AC amplitude of 5 mV. The measured EIS spectra were analyzed with the help of equivalent circuits using Zview 2 (EChem software). In this work, the data are presented in a Nyquist plot (imaginary part versus real part). The electrochemical characterization of the catalysts was carried out performing rotating disc electrode (RDE) measurements in 0.4 M HCl using an Autolab PGSTAT12 potentiostat/galvanostat (Eco Chemie, Utrecht, The Netherlands) controlled by the GPES4.9 software in combination with a speed control unit (CTV101) and a rotating disc electrode (EDI101; Radiometer, Villeurbanne, France). The electrodes for the RDE measurements consisted of glassy carbon rods (Ø 3 mm) embedded in a Teflon holder. To prepare the electrode, 1.25 mg of nitrogen-doped CNTs were suspended in 1 mL H2O in an ultrasonic bath for 20 min. 2 μL of the suspension were then dropped onto the glassy carbon electrode with a surface area of 7.065 mm2. A one-compartment glass cell and a Pt wire counter electrode as well as a Ag/AgCl/3 M KCl reference electrode were used for the measurement.
3. Results and discussion
Purified CNTs were first wet impregnated with two different loadings of KMnO4. The CNTs were therefore partially oxidized by KMnO4 to create oxygen-containing functional groups on the surface.24,25 One of the main reactions leads to the formation of carboxyl groups (eqn (1)), which are negatively charged in aqueous solution. The oxidation also leads to the formation of MnO2.26 The excess of KMnO4 impregnated on the CNTs was thermally decomposed at 270 °C yielding MnO2-coated CNTs (labeled as 10%MnO2@CNTs and 30%MnO2@CNTs for two different loadings; the loading refers to the theoretical amount of metallic Mn on CNTs). The formation of MnO2 was confirmed by X-ray photoelectron spectroscopy (XPS) and X-ray diffraction (XRD). The polyaniline coating on CNTs was achieved by chemical oxidative polymerization (eqn (2)) using MnO2 as chemical oxidative initiator (eqn (3)).21,27 It is believed that the polymerization mainly occurred at the interface between the CNTs and the solution. Polyaniline is known to be positively charged in acidic medium. Thus, it can interact electrostatically with the negatively charged oxygen functional groups leading to the coating of polyaniline on CNTs rather than the formation of the bulk polymer. The polyaniline-coated CNTs obtained from the two different templates were designated as PANI-L@CNTs and PANI-H@CNTs (L refers to the starting material with low MnO2 content, H refers to high MnO2 content in the template, see above). During the reaction, MnO2 first reacted with acid to form Mn cations, which catalyzed the aniline polymerization immediately. During the reaction, MnO2 was completely dissolved as confirmed by elemental analysis. Subsequently, PANI-L@CNTs and PANI-H@CNTs were carbonized at 550 °C and 850 °C to obtain the final catalysts, which are designated as NCNTs-550C-L, NCNTs-850C-L, initially prepared from 10%MnO2@CNTs as the template, and NCNTs-550C-H, NCNTs-850C-H prepared from 30%MnO2@CNTs as the template. In addition, a reference catalyst was prepared via an in situ chemical oxidation of aniline by 30% FeCl3 in the presence of CNTs followed by pyrolysis at 850 °C (labeled as NCNTs-850C-REF).| R–Csurf + MnO4− → MnO2 + R–Csurf OO− | (1) |
 | (2) |
| MnO2 + 4 H+ + 2e− → Mn2+ + 2 H2O (1.23 V) | (3) |
Fig. 1a and 1b show scanning electron microscopy (SEM) images of 10%MnO2@CNTs and 30%MnO2@CNTs. Fig. 1c and 1d display the polyaniline-coated CNTs PANI-L@CNTs and PANI-H@CNTs. The surface texture of 30%MnO2@CNTs results from the thicker MnO2 coating compared to 10%MnO2@CNTs. The amount of polyaniline and the resulting thickness of the coating in PANI-H@CNTs is higher than that in PANI-L@CNTs, as expected from the higher amount of catalyst.
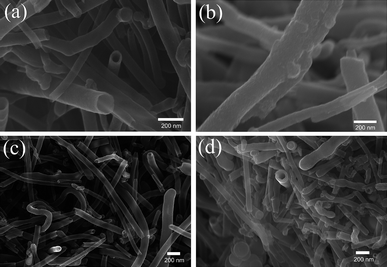 | ||
| Fig. 1 SEM images of Mn10%@CNTs (a), Mn30%@CNTs (b), PANI-L@CNTs (c), and PANI-H@CNTs (d). | ||
The XP Mn 2p spectra of MnO2 supported on CNTs are shown in Fig. 2a (trace 1, 10%MnO2@CNTs; trace 2, 30%MnO2@CNTs). In both traces, the two contributions at binding energies of 642.3 eV and 653.7 eV can be assigned to the 2p3/2 and 2p1/2 peaks of MnO2.28The O 1s region scans of the MnO2-coated CNTs and of the PANI-coated CNTs pyrolysed at 550 °C and 850 °C are shown in Fig. 2b and 2c, respectively. In both figures, the peaks at 529.8 eV in trace (1) (10%MnO2@CNTs in Fig. 2b, 30%MnO2@CNTs in Fig. 2c) can be attributed to oxygen in a metal oxide,16 which was identified as MnO2 based on the Mn 2p spectra. The peaks at 531.3 eV and 533 eV (NCNTs-550C-L in trace (2) and NCNTs-850C-L in trace (3) of Fig. 2b, NCNTs-550C-H in trace (2) and NCNTs-850C-H in trace (3) of Fig. 2c) are due to the presence of oxygen-containing functional groups on the CNT surfaces.29 The peaks at 529.8 eV disappeared after polymerization, indicating full reductive dissolution of MnO2. The stronger peaks at binding energies of 531.3 eV and 533 eV in Fig. 2c compared to Fig. 2b point out that the higher loading of KMnO4 created more oxygen groups on the CNTs as expected. The peaks at 533 eV are not visible in the MnO2-coated CNTs as shown in trace (1) in Fig. 2b and 2c, implying that the MnO2 layers are thick enough to mask the oxygen groups on the CNTs surfaces.
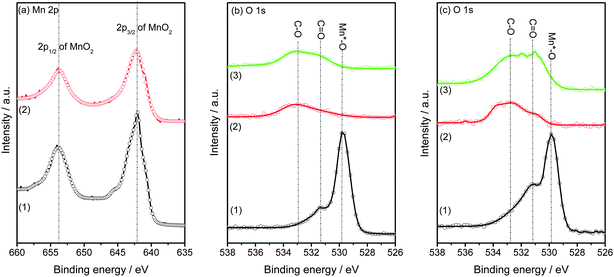 | ||
| Fig. 2 XP spectra of different samples. (a) Mn 2p of samples 10%MnO2@CNTs (1) and 30%MnO2@CNTs (2); (b) O 1s of sample 10%MnO2@CNTs (1), NCNTs-550C-L (2), and NCNTs-850C-L (3); (c) O 1s of sample 30%MnO2@CNTs (1), NCNTs-550C-H (2), and NCNTs-850C-H (3). | ||
The X-ray diffraction patterns of the MnO2-coated CNTs (10%MnO2@CNTs and 30%MnO2@CNTs) and the pyrolysed samples (NCNTs-550C-L and NCNTs-850C-L, NCNTs-550C-H and NCNTs-850C-H) are shown in Fig. 3. The strong peaks at 26.2° in all diffractograms in Fig. 3 originate from the (002) planes of hexagonal graphite.30 The presence of birnessite-type MnO2 in the MnO2-coated CNTs in trace (1) is indicated by the reflections at 11°, 37°, and 66°, which is in agreement with literature results.31 The vanishing of all reflections from the birnessite-type MnO2 in traces (2) and (3) in Fig. 3 demonstrates again that the template dissolves during polymerization, as confirmed already by the ICP and XPS results. The typical reflections of the CNTs remained almost unchanged in the pyrolysed samples.
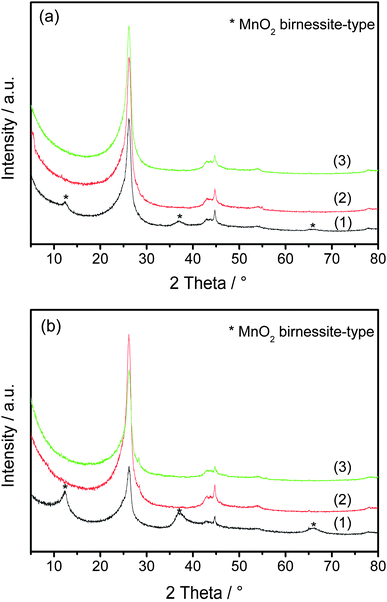 | ||
| Fig. 3 XRD patterns. (a) 10%MnO2@CNTs (1), NCNTs-550C-L (2), and NCNTs-850C-L (3); (b) 30%MnO2@CNTs (1), NCNTs-550C-H (2), and NCNTs-850C-H (3). | ||
From the SEM images (not shown here), it can be concluded that the CNTs remained separated and that interconnection did not occur for the carbonized samples of NCNT-550C-L and NCNT-850C-L prepared from the template 10%MnO2@CNTs. SEM and TEM images of the pyrolysed samples from the starting template 30%MnO2@CNTs are shown in Fig. 4. The rough surface of NCNT-550C-H can be clearly observed in Fig. 4a representing the carbonized polyaniline. After carbonizations at a higher temperature of 850 °C (NCNT-850C-H), a much smoother surface likely due to a more complete carbonization is observed (Fig. 4b). High resolution TEM images of NCNT-550C-H and NCNT-850C-H shown in Fig. 4c–f confirm the formation of the core–shell structure with a CNT core and carbonized polyaniline shell. The thickness of the carbonized polyaniline layer in NCNT-550C-H can be estimated to amount to about 6.6 ± 2 nm, and in NCNT-850C-H to about 3.5 ± 1 nm. The decreasing thickness and smoother surface indicate a more complete carbonization at higher temperatures.
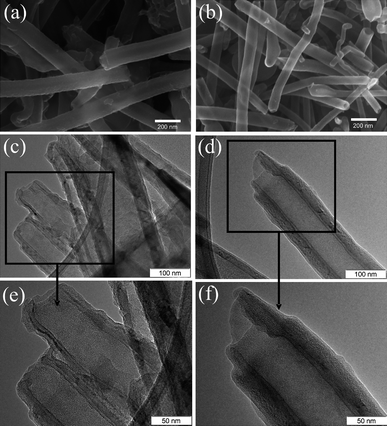 | ||
| Fig. 4 SEM images of NCNTs-550C-H (a) and NCNTs-850C-H (b), and TEM images of NCNTs-550C-H (c, e), and NCNTs-850C-H (d, f). | ||
Thermogravimetry (TG) was carried out in pure O2 to determine the amount of PANI on CNTs. The results of PANI-L@CNTs and PANI-H@CNTs are shown in Fig. 5a and 5b, respectively. The TG and DTG profiles of PANI-L@CNTs at temperatures higher than 410 °C in Fig. 5a are similar to the unmodified CNTs purified in He at 800 °C (i.e., CNTs without MnO2 deposited) (not shown here). The peak between 200 °C and 410 °C for PANI-H@CNTs in Fig. 5b is due to the total oxidation of most of the polyaniline. The weight loss between 410 and 600 °C is caused by the combustion of graphitic carbon from the CNTs and the carbonized polyaniline formed during the burning in O2. The weight losses derived from the TG data are summarized in Table 1. The amount of polymer coating (before carbonization) on the two samples can be estimated from the weight loss obtained by TG, and was found to be 8.5 wt% for PANI-L@CNTs and 26.3 wt% for PANI-H@CNTs. Fig. 6 shows the MS results of PANI-H@CNTs (Fig. 6a), as compared to the reference sample NCNTs-850C-REF (Fig. 6b). The m/z = 44 trace originates from the formation of CO2, which can be formed by the total oxidation of polyaniline and CNTs. Note that the MS profile of the NCNTs-850C-REF in Fig. 6b is broader than that in Fig. 6a, pointing to a worse distribution of polyaniline in the reference sample.
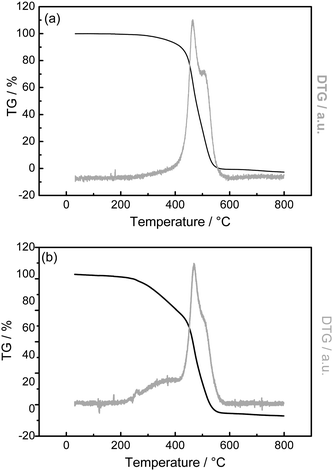 | ||
| Fig. 5 TG and DTG of PANI-L@CNTs (a), and PANI-H@CNTs (b). | ||
| Samples | BET/m2 g−1 | Weight loss, 200–410 °C (%) |
|---|---|---|
| He800 CNTs | 33.0 | N/A |
| MnO210%@CNTs | 33.6 | N/A |
| MnO230%@CNTs | 49.4 | N/A |
| PANI-L@CNTs | 38.1 | 8.5 |
| PANI-H@CNTs | 51.5 | 26.3 |
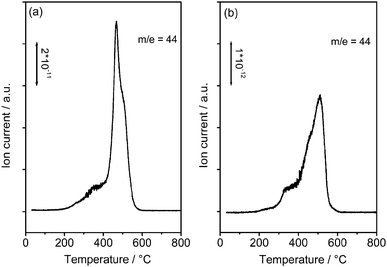 | ||
| Fig. 6 Mass spectra recorded in TG-MS studies. (a) PANI-H@CNTs; (b) The reference sample prepared from in situ chemical oxidation using FeCl3. | ||
The specific surface area of the templates, i.e., the MnO2-coated CNTs, is found to be dependent on the amount of MnO2 (Table 1). The specific surface area of the unmodified, purified CNTs is 33.0 m2 g−1, and shows no obvious change in 10%MnO2@CNTs (33.6 m2 g−1), while it was significantly enhanced to 49.4 m2 g−1 in 30%MnO2@CNTs. The physisorption measurements also show that the specific surface areas of PANI@CNTs are related to those of the MnO2-coated CNTs templates. PANI-L@CNTs had a surface area of 38.1 m2 g−1, whereas in the case of PANI-H@CNTs, the specific area is derived to amount to 51.5 m2 g−1.
The XPS results of PANI@CNTs carbonized at 550 °C and 850 °C are shown in Fig. 7. The N 1s spectra were deconvoluted into four peaks, which can be assigned to four different nitrogen species: pyridinic and nitrile (N1, at ca. 398.6 eV), pyrrolic and amine (N2, at ca. 400.2 eV), quaternary (N3, at ca. 401.2 eV), and pyridine oxide (N4, at ca. 403.0–404.0 eV).32,33 The nitrogen surface atomic concentrations are 3.8 at% (NCNTs-550C-L), 2.0 at% (NCNTs-850C-L), 7.6 at% (NCNTs-550C-H), and 3.8 at% (NCNTs-850C-H). The deconvolution of the N 1s peaks into the different nitrogen groups is summarized in Table 2. The nitrogen atomic surface concentration of the reference sample NCNTs-850C-REF was found to be only 0.8 at% after pyrolysis at 850 °C, which is only 1/5 of the sample prepared from 30%MnO2@CNTs. For the same reference sample, the nitrogen amount obtained from the elemental analysis is 1.33 wt%, which is much higher than that of the template-based samples with a nitrogen amount of 0.41 wt% (NCNTS-850C-L) and 0.70 wt% (NCNTS-850C-H). The low surface atomic concentration of the reference sample indicates that the PANI coating in the reference sample is less homogenous than the template-synthesized sample. The atomic concentrations of C and O were also derived and included in Table 2. Both concentrations increased slightly with increasing treatment temperature from 550 °C to 850 °C, possibly due to the loss of nitrogen. The N4 groups of NCNTs-550C-H and NCNTs-850C-H remained almost the same, indicating that those functional groups are highly stable against carbonization at 850 °C. N1 and N2 groups showed a significant decrease in NCNTs-850C-H compared to NCNTs-550C-H. It is reported that the pyrrolic groups can be converted to pyridine and finally into graphitic nitrogen (quaternary type),32 which is presumably the reason for the increase in N3. The nitrogen doping amount achieved by post-treatment of CNTs with NH3 was reported to be not higher than 9% of the as-made samples, and less than half of the nitrogen remained after thermal treatment at temperatures up to 500 °C.32 Even higher treatment temperatures could lead to the decomposition of most of the nitrogen groups on CNTs. The thermal stability of these post-doping methods at 850 °C was rarely studied, possibly due to the low amount of nitrogen left under such harsh treatment conditions. In our case, even after treatment at 850 °C the nitrogen content was rather high, indicating that the PANI approach is beneficial to obtain highly stable nitrogen species embedded in the CNT surfaces.
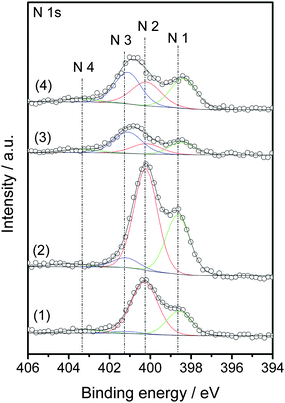 | ||
| Fig. 7 XP N 1s spectra of NCNTs-550C-L (1), NCNTs-550C-H (2), NCNTs-850C-L (3), and NCNTs-850C-H (4). N1: imine, at 398.1 eV; N2: pyridinic, at 398.7 eV; N3: nitride, at 399.6 eV; N4: pyrrolic, at 400.4 eV; N5: quarternary, at 401.2 eV; N6: pyridine oxide, at 403.0–404.0 eV. | ||
| Species | NCNTs-550C-L | NCNTs-850C-L | NCNTs-550C-H | NCNTs-850C-H |
|---|---|---|---|---|
| C (%) | 92.4 | 93.6 | 89.2 | 90.3 |
| O (%) | 3.8 | 4.4 | 3.2 | 5.9 |
| N% (total) | 3.8 | 2.0 | 7.6 | 3.8 |
| N1 | 1.1 | 0.5 | 2.6 | 1.2 |
| N2 | 2.4 | 0.4 | 4.3 | 1.1 |
| N3 | 0.1 | 0.9 | 0.5 | 1.3 |
| N4 | 0.2 | 0.2 | 0.2 | 0.2 |
Electrochemical impedance spectroscopy (EIS) in the presence of a freely diffusing and negatively charged redox species was performed to investigate the electrochemical properties of the catalysts after treatment at different temperatures. The corresponding Nyqvist plots are shown in Fig. 8. The preparation procedure as well as the heat treatment temperature had a profound influence on the impedance spectra. In complex three-dimensional electrode/electrolyte interfaces present in the investigated samples, there are many possible factors that contribute to variations in the charge transfer resistance (RCt). For instance, changes in RCt may be due to different surface properties/composition or due to the electrical contact (interconnection) between the carbon nanotubes. Sample NCNTs-850C-H in trace (2) shows the smallest RCt, which translates into high ORR activity, whereas NCNTs-850C-REF has a relatively large RCt, which is possibly due to a large contact resistance. Evidently, the electrochemical impedance results correlate with the observed ORR activity and may hence be used as additional evidence for the changes at the interface causing the observed variations in the ORR activity.
![Electrochemical impedance spectroscopy of NCNTs-550C-H (1), NCNTs-850C-H (2), and NCNTs-850C-REF (3). The measurements were performed at the formal potential of the [Fe(CN)6]3−/4− redox couple (5 mM; +200 mV vs. Ag/AgCl 3 M KCl) in the frequency range of 5 Hz (final) to 40 kHz (initial) with an AC amplitude of 5 mV.](/image/article/2010/NR/b9nr00405j/b9nr00405j-f8.gif) | ||
| Fig. 8 Electrochemical impedance spectroscopy of NCNTs-550C-H (1), NCNTs-850C-H (2), and NCNTs-850C-REF (3). The measurements were performed at the formal potential of the [Fe(CN)6]3−/4− redox couple (5 mM; +200 mV vs. Ag/AgCl 3 M KCl) in the frequency range of 5 Hz (final) to 40 kHz (initial) with an AC amplitude of 5 mV. | ||
The ORR activity of the NCNT catalysts was examined by RDE measurements in aqueous 0.4 M HCl. Fig. 9 compares RDE curves obtained at 900 rpm for samples prepared via different routes or treated at different temperatures. The samples synthesized at 550 °C (NCNTs-550C-L, trace (1); NCNTs-550C-H, trace (2)) display almost no activity in the ORR. However, the samples prepared with a heat treatment temperature of 850 °C (traces 3–5) show significantly higher activity compared to those heat-treated at 550 °C. NCNTs-850C-L (trace 3) shows a smaller oxygen reduction current compared to NCNT-850C-H (trace 4). Furthermore, sample NCNT-850C-H shows a three times higher reduction current (130 μA) compared to NCNTs-850C-REF synthesized from FeCl3 (40 μA) (trace 5), and the onset potential is more positive (0.53 V, 2.0 μA) than that of the reference sample (0.38 V, 2.0 μA). This may be due to the higher amount of nitrogen (3.8 at%) present in NCNT-850C-H synthesized from the MnO2 template compared to the one from FeCl3 (0.8 at%). No diffusion current plateaus were reached in all of the samples possibly due to the presence of a distribution of catalytic sites in the three-dimensional interface structure.34
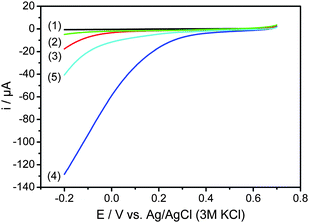 | ||
| Fig. 9 Polarization curves of NCNTs-550C-L (1), NCNTs-550C-H (2), NCNTs-850C-L (3), NCNTs-850C-H (4), and NCNTs-850C-REF (5) obtained by rotation disc electrode measurements with a rotation speed of 900 rpm at a scan rate of 5 mV s−1 in oxygen-saturated 0.4 M HCl at room temperature. CE: Pt foil, RE: Ag/AgCl/3 M KCl. | ||
The results show that a treatment temperature higher than 550 °C is necessary to obtain significant oxygen reduction activity in such catalysts in agreement with literature results. The RDE results correspond to those from EIS, where PANI-H@CNTs treated at 850 °C had a smaller RCt than the same sample treated at 550 °C. In addition to the intrinsic activity of the modified CNTs, conductivity may also account for the different performances. Previous studies showed that the conductivity during the carbonization of polyaniline can be significantly increased by a higher carbonization temperature.35 Thus, better conductivity may explain the lower RCt in NCNTs-850C-H compared to NCNTs-550C-H due to a higher extent of graphitization.
4. Conclusions
A novel method based on the oxidative polymerization of aniline was developed for the synthesis of nitrogen-doped CNTs. The doping was achieved through a homogenous coating of multi-walled CNTs with polyaniline using a MnO2 template followed by the carbonization of the polymer coating. The resulting composites consisting of a N-doped carbon shell supported on a CNT core were found to be highly active as electrocatalysts in the oxygen reduction reaction. The birnessite-type MnO2 template was synthesized by the impregnation of CNTs with KMnO4 followed by its thermal decomposition. Favorably, the template was completely dissolved during the polymerization of aniline in acid as indicated by elemental analysis. The polymer-coated CNTs were studied by TG-MS, and the surfaces of the carbonized samples were investigated by XPS. A high amount of nitrogen was found to be present in the carbonized shell even after high temperature treatment, especially in the samples prepared from 30% MnO2 carbonized at 550 °C (7.6 at%) and 850 °C (3.8 at%), which was much higher than the nitrogen content (0.8 at%) of the reference sample synthesized with FeCl3. The carbonized CNTs were further examined by electrochemical impedance spectroscopy and rotating disc electrode measurements. The sample prepared from the 30 wt% MnO2 template and carbonized at 850 °C showed the lowest charge transfer resistance and the best performance in the oxygen reduction reaction, indicating efficient nitrogen doping.Acknowledgements
Chen Jin thanks the International Max Planck Research School Surface and Interface Engineering in Advanced Materials (SurMat) for a research grant. Dr Tharamani Chikka Nagaiah is grateful to the Alexander von Humboldt Foundation for a postdoctoral fellowship. The studies were supported by the Research Department Interfacial Systems Chemistry (IFSC) at the Ruhr-University Bochum.References
- F. Federico, G. N. Martelli and D. Pinter, in Modern chlor-alkali technology: Gas-diffusion electrodes for chlorine related (production) technologies, ed. J. Moorhouse, Blackwell Science, London, 2001 Search PubMed.
- C. Jin, W. Xia, T. C. Nagaiah, J. Guo, X. Chen, M. Bron, W. Schuhmann and M. Muhler, Electrochim. Acta, 2009, 54, 7186 CrossRef CAS.
- R. J. Allen, J. R. Giallombardo, D. Czerwiec, E. S. De Castro and K. Shaikh, US Pat., 6149782, 2000.
- C. Jin, W. Xia, T. C. Nagaiah, J. Guo, X. Chen, M. Bron, W. Schuhmann and M. Muhler, J. Mater. Chem., 2010, 20, 736 RSC.
- J. M. Ziegelbauer, A. F. Gulla, C. O'Laoire, C. Urgeghe, R. J. Allen and S. Mukerjee, Electrochim. Acta, 2007, 52, 6282 CrossRef CAS.
- C. W. B. Bezerra, L. Zhang, K. Lee, H. Liu, A. L. B. Marques, E. P. Marques, H. Wang and J. J. Zhang, Electrochim. Acta, 2008, 53, 4397.
- R. Bashyam and P. Zelenay, Nature, 2006, 443, 63 CrossRef CAS.
- S. Maldonado and K. J. Stevenson, J. Phys. Chem. B, 2004, 108, 11375 CrossRef CAS.
- P. H. Matter, E. Wang, M. Arias, E. J. Biddinger and U. S. Ozkan, J. Phys. Chem. B, 2006, 110, 18374 CrossRef CAS.
- S. Kundu, T. C. Nagaiah, W. Xia, Y. Wang, S. van Dommele, J. H. Bitter, M. Santa, G. Grundmeier, M. Bron, W. Schuhmann and M. Muhler, J. Phys. Chem. C, 2009, 113, 14302 CrossRef CAS.
- K. Gong, F. Du, Z. Xia, M. Durstock and L. Dai, Science, 2009, 323, 760 CrossRef CAS.
- Y. Shao, J. Sui, G. Yin and Y. Gao, Appl. Catal., B, 2008, 79, 89 CrossRef CAS.
- L. Li, Z. Qin, X. Liang, Q. Fan, Y. Lu, W. Wu and M. Zhu, J. Phys. Chem. C, 2009, 113, 5502 CrossRef CAS.
- J. Stejskal and R. G. Gilbert, Pure Appl. Chem., 2002, 74, 857 CrossRef CAS.
- S. Sakkopoulos, E. Vitoratos and E. Dalas, Synth. Met., 1998, 92, 63 CrossRef CAS.
- L. Li, E. Liu, J. Li, Y. Yang, H. Shen, Z. Huang, X. Xiang and W. Li, J. Power Sources, 2010, 195, 1516 CrossRef CAS.
- L. Lin, H. Niu, M. Zhang, W. Song, Z. Wang and X. Bai, Appl. Surf. Sci., 2008, 254, 7250 CrossRef CAS.
- M. Trchova, E. N. Konyushenko, J. Stejskal, J. Kovarova and G. Ciric-Marjanovic, Polym. Degrad. Stab., 2009, 94, 929 CrossRef CAS.
- Y. Sheng, J. Chen, D. Zhu, C. Carrot and J. Guillet, Chin. J. Polym. Sci., 2004, 22, 269 CAS.
- N. Ballav, Mater. Lett., 2004, 58, 3257 CrossRef CAS.
- L. Pan, L. Pu, Y. Shi, S. Song, Z. Xu, R. Zhang and Y. Zheng, Adv. Mater., 2007, 19, 461 CrossRef CAS.
- V. G. Khomenko, V. Z. Barsukov and A. S. Katashinskii, Electrochim. Acta, 2005, 50, 1675 CrossRef CAS.
- W. Xia, C. Jin, S. Kundu and M. Muhler, Carbon, 2009, 47, 919 CrossRef CAS.
- D. V. Kosynkin, A. L. Higginbotham, A. Sinitskii, J. R. Lomeda, A. Dimiev, B. K. Price and J. M. Tour, Nature, 2009, 458, 872 CrossRef CAS.
- T. J. Aitchison, M. Ginic-Markovic, J. G. Matisons, G. P. Simon and P. M. Fredericks, J. Phys. Chem. C, 2007, 111, 2440 CrossRef CAS.
- X. Jin, W. Zhou, S. Zhang and G. Z. Chen, Small, 2007, 3, 1513 CrossRef CAS.
- Y. Wei, X. Tang and Y. Sun, J. Polym. Sci., Part A: Polym. Chem., 1989, 27, 2385 CAS.
- J. F. Moulder, W. F. Stickle, P. E. Sobol and K. D. Bomben, in Handbook of X-ray Photoelectron Spectroscopy: A Reference Book of Standard Spectra for Identification and Interpretation of XPS Data, ed. J. Chastain, Perkin-Elmer corporation, Minnesota, 1992 Search PubMed.
- T. I. T. Okpalugo, P. Papakonstantinou, H. Murphy, J. Mclaughlin and N. M. D. Brown, Carbon, 2005, 43(1), 153 CrossRef CAS.
- W. Z. Li, C. H. Liang, W. J. Zhou, J. S. Qiu, Z. H. Zhou, G. Q. Sun and Q. Xin, J. Phys. Chem. B, 2003, 107, 6292 CrossRef CAS.
- Y. Wang, A. Yuan and X. Wang, J. Solid State Electrochem., 2008, 12, 1101 CrossRef CAS.
- R. Arrigo, M. Hävecker, R. Schlögl and D. S. Su, Chem. Commun., 2008, 4891 RSC.
- R. Pietrzak, H. Wachowska and P. Nowicki, Energy Fuels, 2006, 20, 1275 CrossRef CAS.
- R. Jiang and F. C. Anson, J. Electroanal. Chem., 1991, 305, 171 CrossRef CAS.
- M. Trchova, P. Matejka, J. Brodinova, A. Kdova, J. Prokes and J. Stejskal, Polym. Degrad. Stab., 2006, 91, 114 CrossRef CAS.
| This journal is © The Royal Society of Chemistry 2010 |
