Quantum sized, thiolate-protected gold nanoclusters
Rongchao
Jin
*
Carnegie Mellon University, Department of Chemistry, Pittsburgh, PA 15213, USA. E-mail: rongchao@andrew.cmu.edu
First published on 8th December 2009
Abstract
The scientific study of gold nanoparticles (typically 1–100 nm) has spanned more than 150 years since Faraday's time and will apparently last longer. This review will focus on a special type of ultrasmall (<2 nm) yet robust gold nanoparticles that are protected by thiolates, so-called gold thiolate nanoclusters, denoted as Aun(SR)m (where, n and m represent the number of gold atoms and thiolate ligands, respectively). Despite the past fifteen years' intense work on Aun(SR)m nanoclusters, there is still a tremendous amount of science that is not yet understood, which is mainly hampered by the unavailability of atomically precise Aun(SR)m clusters and by their unknown structures. Nonetheless, recent research advances have opened an avenue to achieving the precise control of Aun(SR)m nanoclusters at the ultimate atomic level. The successful structural determination of Au102(SPhCOOH)44 and [Au25(SCH2CH2Ph)18]q (q = −1, 0) by X-ray crystallography has shed some light on the unique atomic packing structure adopted in these gold thiolate nanoclusters, and has also permitted a precise correlation of their structure with properties, including electronic, optical and magnetic properties. Some exciting research is anticipated to take place in the next few years and may stimulate a long-lasting and wider scientific and technological interest in this special type of Au nanoparticles.
 Rongchao Jin | Rongchao Jin earned his BSc degree from the University of Science and Technology of China (Hefei) in 1995, his MSc from the Dalian Institute of Chemical Physics (China) in 1998, and his PhD from Northwestern University in 2003. After post-doctoral research at the University of Chicago, he joined the chemistry faculty of Carnegie Mellon University. His current research interests include the synthesis of nanoparticles with atomic precision, study of their utilization, structure, electronic and optical properties. |
1. Introduction
The use of gold nanoparticles for decorative purposes dates back to ancient times, albeit at that time no-one knew the material was indeed nanoscale particles due to the unavailability of nanoscale imaging tools. Scientific research on gold nanoparticles, however, did not start until the mid-19th century. In 1857, Michael Faraday successfully prepared a gold colloid through the reduction of a gold salt with (white) phosphorus in a two-phase system.1 The brilliant ruby-red color of the gold colloid greatly intrigued Faraday, and also stimulated a great deal of experimental and theoretical research on metal colloids .2–8 In 1908, the striking optical properties (including absorption and scattering) of gold nanoparticles were successfully explained by the classic work by Gustov Mie, who solved Maxwell's equations for light interaction with a single gold nanoparticle.3 But the physical nature of the optical excitation of gold nanoparticles (as well as other types of metal nanoparticles) was not understood until the full establishment of the electron band theory for metals in the 1960s.8 By then, electronic excitation in metal nanoparticles was finally understood as a collective excitation mode of the conduction electrons in the particle, so-called surface plasmon resonance. Since the 1990s, we have witnessed tremendous research efforts in shape and size control of gold nanoparticles as well as exploration of their technological applications in nano-electronics and optics, biological sensing, catalysis, and biomedicine.9–12This review will focus on a special type of ultra-small gold nanoparticles (<2 nm core diameter) protected by thiolate ligands, so-called gold nanoclusters (or clusters for short). The ultra-small size of these nanoclusters induces distinctive quantum confinement effects, which result in discrete electronic structure and molecular-like properties, such as HOMO–LUMO electronic transition, enhanced photoluminescence, intrinsic magnetism, and many others (see section 4 in this review). All these unique properties of gold nanoclusters are fundamentally different from those of their larger counterparts—crystalline Au nanoparticles (also called nanocrystals) in which the optical properties are dominated by plasmon excitation and possess a collective nature (as opposed to the single-electron transition in gold nanoclusters). Due to the high sensitivity of the properties of gold nanoclusters to the number of atoms in the particle, these ultra-small nanoparticles are better represented by their exact formula, generally denoted as Aun(SR)m, where, n and m are the respective number of metal atoms and thiolate ligands (–SR). The most interesting size (n) range is from about a dozen to a few hundred atoms (equivalent to the subnanometre to ∼2 nm range).
Of special note, herein we reserve the term “gold nanoclusters” or “gold clusters” for those ultra-small gold nanoparticles that exhibit a discrete electronic structure (as opposed to the quasicontinuous band structure in Au nanocrystals). Many researchers have, instead, used the same terminology to cover the entire size range of Au nanoparticles from ∼1 to ∼100 nm, such as in the classic book by Kreibig and Vollmer.8 These authors used terms “very small clusters” to refer to 2–20 atoms, “small clusters” (20–500 atoms), and “large clusters” (500–107 atoms). We thought that the special range of subnanometre to ∼2 nm for gold nanoparticles may deserve a special term to describe them, as these ultra-small nanoparticles are vastly different to larger Au nanoparticles in terms of atomic packing, electronic structure, magnetism, electrochemical and charge transport properties. The non-unified nomenclature may confuse new practitioners in the field.
Gold thiolate nanocluster research started about fifteen years ago (see section 3), but phosphine-capped gold clusters were reported as early as the 1970s.13–22 Gold, as a unique noble metal, is particularly attractive due to its superior resistance to oxidation (the other one is Pt). In the past decade, gold thiolate clusters have drawn significant research interest due partly to their extraordinary chemical stability as well as a wide range of potential applications. However, the major difficulties encountered in the synthesis of atomically precise gold thiolate clusters have precluded in-depth studies on their new physical and chemical properties effected by quantum confinement of electrons in the particle.
Recently, there have been major research advances in the synthesis of atomically precise Aun(SR)m clusters and in the structural determination of thiolated gold clusters by X-ray crystallography, including Au102(p-MBA)44 (p-MBA = SPhCOOH)23 and [Au25(SCH2CH2Ph)18]q (q = −1, 0).24–26 The breakthrough in structural determination has shed some exciting light on the interesting atomic packing structure adopted in these gold nanoclusters and has also permitted a precise structure–property correlation for an in-depth understanding of their intriguing electronic, optical and magnetic properties. This review will summarize the research progress in gold thiolate cluster synthesis with a focus on the recently reported truly monodisperse Aun(SR)m systems. With respect to the physicochemical properties of thiolated gold clusters, we will focus on the Au25(SR)18 cluster system, which has been most extensively studied and serves as the first excellent model for one to appreciate the detailed cluster structure–property relationships based upon experiment and theory.
This review is organized as follows. section 2 first introduces some basic physics, which allows one to gain some basic understanding of electron energy quantization in metal clusters. Section 3 first summarizes briefly the synthetic work on thiolate-protected gold nanocrystals (>2 nm), and then focuses on nanoclusters since the latter is the focus of this review. Section 4 discusses some details on the structure, electronic, optical and magnetic properties of Aun(SR)m clusters using Au102(p-MBA)44 and [Au25(SCH2CH2Ph)18]q (q = −1, 0) as pedagogical examples. Finally, I provide a personal perspective on the major issues yet to be worked out in future research. Of note, it is a tough task to review metal cluster research since this field is extremely broad and crosses many disciplines. This review only serves as a starting point for researchers who are interested in this subject. And, due to my limited knowledge, some excellent work from my colleagues may have been overlooked in this review.
2. Basic physics: electronic energy quantization in metal clusters
The nanoscale (typically 1–100 nm) lies in between discrete atoms (or small molecules, <1 nm) and bulk solids, and constitutes a particularly interesting length scale. To understand the fundamental properties of metal nanoparticles, the free-electron theory for metals is of particular importance, which is indeed a quite successful model and provides intuitive insight into the electronic properties of metal nanoparticles, although it is quite naïve in some aspects, as this model assumes no electron–electron or electron–ion lattice interactions (both aspects are indeed fundamentally important). Nevertheless, the free-electron model still works quite well in most aspects, at least to a first order approximation, and herein we use this simple model to acquire some semi-quantitative estimation of electronic energy quantization in gold nanoclusters.The free-electron model was first developed by Drude in 1900 (just three years after Thompson's discovery of the electron), and later refined by Sommerfeld by replacing the classical Maxwell–Boltzmann statistics with the Fermi–Dirac statistical function for electrons. Accompanying the major development of quantum physics in the 1920s, the electron band theory for the solid state started to come into being around the 1930s, but at that time the calculation of electronic band structures of metals was still formidable. It wasn’t until the popularization of computer technology in the 1960s that computation of the band structure of metals became possible, in particular, for the band structure of gold, which is largely complicated by strong relativistic effects. Shortly after the establishment of the band theory of bulk metals, physicists started to think about the electronic structure of small particles. Readers may refer to some early work by Kubo et al.27
Below we shall introduce some basic physics using the free-electron model and will extrapolate the model into the cluster size regime to gain some useful insight into electronic energy quantization in small metal particles. It should be noted that the free-electron model serves only for estimation purposes (yet quite intuitive), since it does not take into account the surface effects in small particles and ligands' contributions to the electronic structure.
2.1 The free-electron model
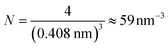
Bulk metals typically adopt cubic or hexagonal crystal structures, including fcc, bcc, and hcp. Due to the extremely high electron density (for example, ∼6 × 10²² per cm3 for 6s valence electrons (i.e. conduction electrons) in bulk gold (fcc structure, unit cell edge length: 0.408 nm), the electronic states are densely spaced, forming quasi-continuous bands (e.g. 6s or 6sp band and 5d bands). The 6s electrons can indeed be quite well described by the free-electron theory, at least to a first order approximation.Let us suppose N electrons in a cube of volume a3; the Schrödinger equation can be greatly simplified into a one-electron equation under the major assumptions of the free-electron model (i.e., no electron–electron or electron–ion interactions),
 | (1) |
 | (2) |
 | (3) |
 | (4) |
 | (5) |
 | (6) |
2.2 Extrapolation of the free-electron model into the cluster regime
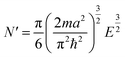
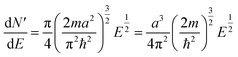
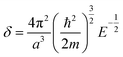
The above free-electron model works quite well for gold, silver, and copper, etc. In the band theory, the rigorously computed s-band (6s for gold) indeed closely resembles what is derived from the simple free-electron model. Let us now extrapolate the free-electron model into the cluster size regime to obtain some useful results for metal nanoclusters.| δ = kBT | (7) |
 | (8) |
 | (9) |
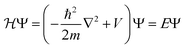
The critical number of valence electrons is actually equivalent to the estimated critical particle size, see below.
Each gold atom in the cluster donates one 6s valence electron. The net number of gold atoms in the fcc unit cell (edge length 0.408 nm) is
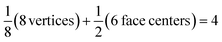 | (10) |
 | (11) |
2.3 The band model of gold
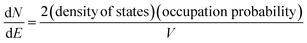
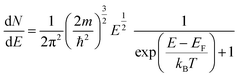
In the band model, the 5d-bands of gold overlap the 6s bands in the energy space, and interband transitions from 5d-band to 6s band (i.e. to states above the Fermi level) will occur in optical excitation, but in terms of energy quantization in small clusters, one still expects that the 5d bands retain the condensed state with a bandwidth of ∼3 eV, and only the 6s band will experience major quantization.For the 6s band, the number of electrons per unit energy and volume, so-called electron population density, can be expressed as,
 | (12) |
 | (13) |
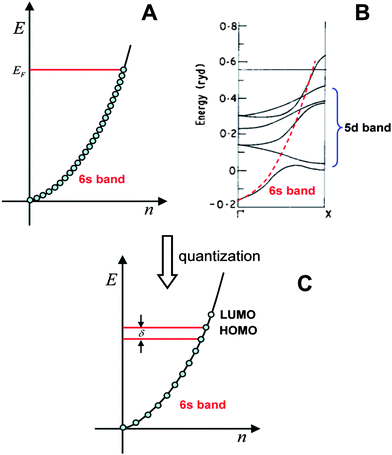 | ||
| Fig. 1 The valence electron band of gold. A) Free-electron model; B) Band structure computed by the band theory, the energies are in units of Rydberg (1 Ryd = 13.6 eV); C) Quantized electronic energy levels in small particles. (Fig. 1B is adapted from ref. 28. Copyright 1970 Institute of Physics and IOP Publishing Limited). | ||
In the case of small particles, electronic energy quantization occurs and the spacing (δ) becomes appreciable; the finite energy states are schematically shown in Fig. 1C. Note that the energy states are evenly distributed, which is not the case in real clusters. We will come back to this when we discuss the electronic structure of Au25(SR)18 clusters.
3. Chemical synthesis of thiolate-protected gold clusters
A central issue in current gold thiolate cluster research is to develop synthetic chemistry that permits the synthesis of atomically precise clusters with precise control of their size (i.e., the number of gold atoms in the cluster). This atomic level of control is necessary because of the sensitivity of the cluster's properties to the number of atoms. This indeed brings major challenges to materials chemists since the current knowledge of the kinetics of particle growth in solution is still quite limited. Nevertheless, some remarkable progress in controlling the clusters with atomic precision has been achieved in recent years. This section will summarize the advances in the synthesis of gold thiolate clusters with a focus on solution-phase chemical synthesis.Before we discuss the chemical synthesis of metal clusters, it may be meaningful to mention the physical synthesis of metal clusters. Metal clusters are readily produced in the gas phase when a bulk metal is heated to near its melting point; the emitted atomic vapor contains dimers (M2), trimers (M3), tetramers (M4), and larger ones (Mn), with n up to even a few hundred, but the yield drastically drops with increasing size (n).29 For the gas-phase clusters, their major disadvantages are, i) they are generated as a mixture and hence, mass separation is necessary; ii) their short lifetimes, unless the clusters are carefully trapped or deposited onto substrates without causing aggregation.
For practical applications, it is highly desirable to make solution-phase metal nanoclusters since such methods permit an easy scale-up, and a large quantity of clusters can be readily obtained once a synthetic approach is developed. In contrast to gas-phase clusters, which are bare (without ligand protection), solution-phase clusters are protected by ligands (e.g.phosphines, amines, thiols). These ligands typically form a monolayer on the cluster surface (hence, monolayer-protected clusters) and the ligand layer prevents the clusters from aggregation in solution or in the solid phase. On the other hand, the ligand layer may profoundly influence the physical and chemical properties of metal clusters, in particular when strong ligands such as thiols are used to stabilize the clusters.
Due to the ultra-small size (<2 nm) requirement for metal clusters to exhibit quantum confinement effects (see section 2), synthetic control of cluster size with nanometre precision (e.g. ± a fraction of nm) is not sufficient; indeed, precise control of the number of metal atoms in the particle becomes necessary in order to observe distinct quantum size effects. This brings major difficulties in the chemical synthesis of metal nanoclusters, including the size and monodispersity control. For chemists, a major task is to explore appropriate protecting ligands that can terminate the growth of nanoparticles at a very early stage (hence, obtaining clusters) and protect them from aggregation and size evolution over time; this usually requires strong passivating ligands, such as thiols. In early work, quite extensive work was done on phosphine-protected gold clusters, such as Au11(PR3)7Cl3,13,14 Au11(PR3)7(SPh)3,30 [Au13(PR3)10Cl2]3+,21 [Au39(PR3)14Cl6]2+,22 Au55(PR3)12Cl6,15,31 and bimetal clusters32 such as [Au13Ag12(PR3)10Br8]+,33 [Au18Ag19(PR3)12Br11]2+,34 and [Au18Ag20(PR3)14Cl12]2+,35 where PR3 represents phosphines in general. These clusters, as well as Pdn,36–40 Irn,41 and Au(I) chalcogenide clusters42,43 will not be covered in this review. Schmid provided a quite comprehensive review on gold phosphine clusters.44
In regard to thiolate-capped gold nanoparticles, we roughly divide the relevant research into three stages, i) from polydisperse to narrow-sized Au nanoparticles in the size range of ca. 2–5 nm, these nanoparticles are large enough to exhibit fcc crystallinity (hence, Au nanocrystals); ii) moving toward Au nanoclusters (<2 nm), during this stage relatively monodisperse Au nanoclusters were obtained by post-synthetic size selection, and iii) synthesis of truly monodisperse Aun(SR)m clusters (∼1–2 nm). Below we shall briefly summarize the research progress and discuss some representative work. Our focus is atomically precise Aun(SR)m nanoclusters.
3.1 Basic route to thiolate-protected gold nanoparticles
Inspired by the study of thiol self-assembled monolayers (SAMs) on metal surfaces started in the 1980s,45–47 Brust et al. exploited thiols for gold nanoparticle synthesis in the early 1990s.48–50 Their seminal work has since then stimulated tremendous research in gold thiolate nanoparticles.51–59The basic reactions of the Brust synthesis include,
i) Phase transfer of a gold salt (reaction is not balanced):
| HAuCl4 (aq) + TOABr (tol) → [AuCl4−xBrx]TOA (tol) + HCl(Br) (aq) | (14) |
ii) Reduction of Au(III) to Au(I):
| [AuCl4−xBrx]TOA (tol) + HSR → Au:SR (complexes) | (15) |
iii) Reduction of Au(I) to Au(0):
| Au:SR (tol) + NaBH4 (aq) → Aun(SR)m | (16) |
The Au nanoparticles made by the Brust method are stabilized by a monolayer of thiolates and sometimes are simply called MPC. The most attractive features of these nanoparticles are, 1) the thiolate-protected nanoparticles are extraordinarily stable and can be isolated and stored in powder form long term and are re-dissolvable in solvent;48,52 this is in contrast with conventional gold colloids stabilized by electrostatic interactions; 2) such nanoparticles can be subject to further synthetic manipulations such as surface functionalization. However, an apparent disadvantage of the gold nanoparticles from the early syntheses was the inherent polydispersity of the particles; their size typically ranges from ∼2 to ∼5 nm. Nonetheless, the great advantages of thiolate-protected Au nanoparticles still attracted many researchers and they have since led to fruitful research on this unique type of robust nanoparticles.
Many groups, including Brust, Whetten, Murray, and others carried out extensive work on the synthesis of gold thiolate nanoparticles using a variety of thiols, including long-chain alkylthiols (Cn-SH),52,53 ω-substituted alkylthiols,54 arenethiols,55 and water-soluble thiols,56etc. The primary research goals were: 1) to improve the size distribution of the Au thiolate nanoparticles, and 2) to achieve small-sized clusters.
Although the initial syntheses resulted in polydisperse Au nanoparticles, relatively monodisperse nanoparticles (e.g. good enough for superlattice formation) were obtained by post-synthetic treatment, 1) size-selective precipitation by adding a non-solvent,53 2) chromatographic separation,57–60 or 3) thermal treatment.61–64 For example, Lin et al. reported a thermal ripening method for the preparation of very uniform nanoparticles (∼5 nm) starting with very heterogeneous gold nanoparticles stabilized by surfactant (didodecyldimethylammonium bromide, DDAB).62,63 Miyake and coworkers found that alkanethiol-protected polydisperse Au nanoparticles (∼1.5 nm) in the solid state can transform into 3.4, 5.4, 6.8, and 9.7 nm (mean diameter) by heating to 150–250 °C in air.65 Hussain et al.66 reported an excellent size control of Au nanoparticles in the small-size regime (<5 nm) using polymeric thioether as stabilizers, and the as-preared nanoparticles can be readily displaced by thiol ligands to yield monolayer-protected particles of the usual type. Cooper et al.67 designed polymeric thiol ligands for one-step aqueous preparation of highly monodisperse gold nanoparticles with diameters below 5 nm and the particle size and distribution was found to be controlled by subtle variation of the polymer structure. Yao et al.68,69 prepared uniform Au nanocrystals (3.3, 4.3, 5.6 nm) with mercaptosuccinic acid as the ligand. The Au nanoparticles made by all those methods readily form superlattices, indicating a tight size distribution (typically ∼5–10%). There are many other synthetic protocols nowadays that permit the synthesis of relatively monodisperse Au nanocrystals in the size range of ca. 2–6 nm. Very recently, Wu et al. devised a special type of thiol ligand for making monodisperse, super-robust Au nanoparticles, which are suitable for biological applications under very harsh conditions.70,71
The above-discussed Au nanoparticles are predominantly fcc crystalline and do not show distinctive quantum size effects, therefore, we shall not discuss in more detail, instead, we turn our attention to smaller Au nanoparticles that exhibit quantum size effects.
3.2. From Au nanocrystals to nanoclusters
To make ultra-small Au nanoparticles that exhibit distinct quantum confinement effects, Whetten, Murray, and others made modifications to the original Brust protocol, i) increasing the thiol-to-gold ratio to 2![[thin space (1/6-em)]](https://www.rsc.org/images/entities/char_2009.gif) :1 (as opposed to the original 0.2:1), ii) using a greater excess of the reducing agent (typically NaBH4 in aqueous solution). Smaller Au nanoparticles (down to ∼1.5 nm) could be produced by the modified methods, but the as-prepared crude product consists of quite polydisperse nanoparticles.53,54 However, the extraordinary stability of gold thiolate nanoparticles made it possible to perform solubility-based fractionation of the crude mixture into narrow-sized populations of nanoparticles.53,72,73 Alvarez et al. performed extensive work on fractionation of as-prepared polydisperse Au nanoparticles using appropriate solvents (such as ethanol) to selectively precipitate thiolate-protected Au nanoparticles, and obtained quite narrow size-distributed fractions (called nanocrystal molecules) in the 1.5–3.5 nm range (containing some 100 to 1300 Au atoms, analyzed by laser desorption ionizationmass spectrometry, LDI-MS).73,74 Superlattices were readily formed from these fractionated nanoparticles, indicating the high monodispersity of these fractionated nanoparticles.
:1 (as opposed to the original 0.2:1), ii) using a greater excess of the reducing agent (typically NaBH4 in aqueous solution). Smaller Au nanoparticles (down to ∼1.5 nm) could be produced by the modified methods, but the as-prepared crude product consists of quite polydisperse nanoparticles.53,54 However, the extraordinary stability of gold thiolate nanoparticles made it possible to perform solubility-based fractionation of the crude mixture into narrow-sized populations of nanoparticles.53,72,73 Alvarez et al. performed extensive work on fractionation of as-prepared polydisperse Au nanoparticles using appropriate solvents (such as ethanol) to selectively precipitate thiolate-protected Au nanoparticles, and obtained quite narrow size-distributed fractions (called nanocrystal molecules) in the 1.5–3.5 nm range (containing some 100 to 1300 Au atoms, analyzed by laser desorption ionizationmass spectrometry, LDI-MS).73,74 Superlattices were readily formed from these fractionated nanoparticles, indicating the high monodispersity of these fractionated nanoparticles.
Several critical sizes of Au nanoparticles were observed by Alvarez et al.,53,73 including species of 93–92 k, 57 k, 46–45 k, and 29–27 k (measured by LDI-MS, k = 1000 amu units, the species presumably exist in the form of AunSm under LDI conditions), Fig. 2. The 92 k species were studied by HR-TEM; fcc lattice images were observed, hence, these particles are crystalline. The other fractions seemed too small to be studied by HR-TEM, but were proposed to be fcc truncated Dh structures on the basis of the calculations by Landman et al.,75 and the optimum sizes (Aun) were theoretically suggested to be Au459 (corresponding to the 93 k species, 2.5 nm), Au314 (57 k, 2.1 nm), Au225 (45 k, 2.0 nm), and Au140 (28 k, ∼1.7 nm) metal cores.
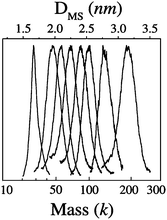 | ||
| Fig. 2 Eight fractions of gold nanocrystals (3.2, 2.7, 2.5, 2.4, 2.2, 2.1, 2.0, and 1.7 nm, thiolate SC6 as passivant) with their core masses determined by LDI mass spectrometry (k = 1000 amu units). Reproduced from ref. 73 with permission. Copyright 1997 American Chemical Society. | ||
Murray and coworkers reported the synthesis and characterization of unfractionated (i.e. as-prepared) dodecanthiolate-protected Au nanoparticles with average core diameters ranging from 5.2 nm down to ∼1.5 nm (equivalent 4800–110 Au atoms/core).54 They found that these nanoparticles, even the smallest core size, were still large enough to exhibit surface plasmons (i.e. these nanoparticles can be considered metallic). However, it should be noted that those small Au nanoparticles (<2 nm) made at that time were not sufficiently monodisperse to exhibit distinctive quantum size effects; the presence of mixed sizes or a small fraction of larger nanoparticles (>2 nm) would readily wash out some optical spectroscopic features and complicate data interpretation.
Overall, the early work by Whetten and Murray groups implied that the transition from metallic to molecular behavior should lie at around ∼2 nm, which indeed agrees with the estimated 1.7 nm from the free-electron model at which electron energy quantization occurs (see section 2).
To make sub-2 nm or even smaller Au nanoparticles with a sufficiently narrow size distribution, Whetten and coworkers53 refined the preparation protocol by recognizing the reaction mechanism between HAuCl4 and R-SH [see eqn (16)], that is,
| Au(III) + 3HSR → Au(I)SR (complexes) + RSSR | (17) |
![[hair space]](https://www.rsc.org/images/entities/char_200a.gif) :1 has become a routine condition for thiolated Au cluster synthesis. The thiolate chain length (n-CnH2n+1SH, where, n = 4, 6, 12, 18) was systematically investigated. Several species with core masses at 29–28 k (1.7 nm, ∼146 atoms), 23–22 k (1.5 nm, ∼101 atoms), and 15–14 k (1.3 nm, ∼75 atoms), and the smallest ever cluster 8 k (1.1 nm, ∼38 atoms) were obtained, Fig. 3A.76 Structural characterization was attempted by performing powder X-ray diffraction (PXRD), and the 22 k and 14 k species were proposed to be decahedra (Dh).75,77 Chen et al. carried out a systematic study on the electrochemical properties of these clusters and observed molecule-like charge behavior in smaller clusters, Fig. 3B–D.78 Among this series of gold thiolate clusters, the 29 k species was found to quite predominant in the synthesis and hence was isolated in relatively large quantities.79–81 Detailed electrochemical measurements were reported.81–83 The 14 k species (1.3 nm, ∼75 atoms) was found to convert to smaller clusters (8 k) in a thiol etching process at 70 °C under an inert atmosphere.84 Step-like optical absorption was for the first time observed in the 8 k species.76
:1 has become a routine condition for thiolated Au cluster synthesis. The thiolate chain length (n-CnH2n+1SH, where, n = 4, 6, 12, 18) was systematically investigated. Several species with core masses at 29–28 k (1.7 nm, ∼146 atoms), 23–22 k (1.5 nm, ∼101 atoms), and 15–14 k (1.3 nm, ∼75 atoms), and the smallest ever cluster 8 k (1.1 nm, ∼38 atoms) were obtained, Fig. 3A.76 Structural characterization was attempted by performing powder X-ray diffraction (PXRD), and the 22 k and 14 k species were proposed to be decahedra (Dh).75,77 Chen et al. carried out a systematic study on the electrochemical properties of these clusters and observed molecule-like charge behavior in smaller clusters, Fig. 3B–D.78 Among this series of gold thiolate clusters, the 29 k species was found to quite predominant in the synthesis and hence was isolated in relatively large quantities.79–81 Detailed electrochemical measurements were reported.81–83 The 14 k species (1.3 nm, ∼75 atoms) was found to convert to smaller clusters (8 k) in a thiol etching process at 70 °C under an inert atmosphere.84 Step-like optical absorption was for the first time observed in the 8 k species.76
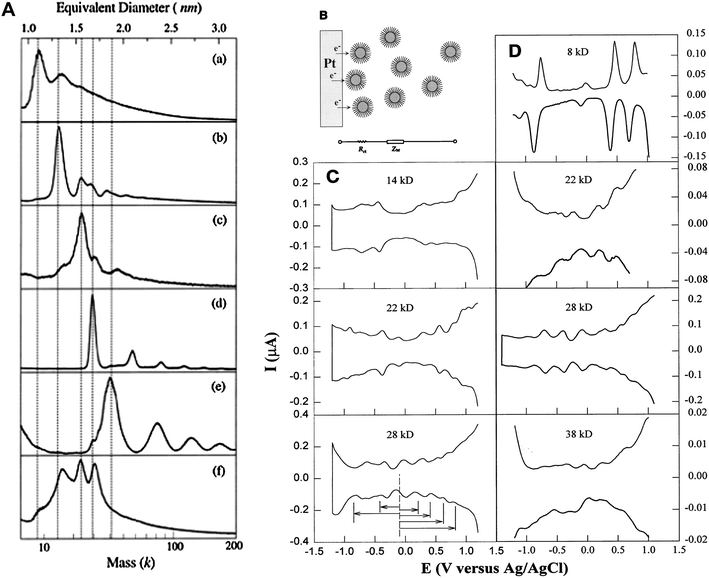 | ||
| Fig. 3 Left panel: LDI mass spectra of Aun(SCn) clusters, (a) 8 k (>75% abundance); (b) 14 k (80%); (c) 22 k (60%), (d) 28 k (95%), (e) 38 k (∼60%); (f) crude mixture. Reproduced from ref. 76 with permission. Copyright 1997 American Chemical Society. Right panel: Differential pulse voltammograms (DPV) for Aun(SCn) species; Reproduced from ref. 78 by permission. Copyright 1998 American Association for the Advancement of Science (AAAS). | ||
3.3. Monodisperse Aun(SR)m clusters
The work summarized in the above section represents important advances in gold cluster synthesis, but a true monodispersity at the atomic level was not attained then. It is of critical importance to achieve atomic monodispersity of clusters in order to observe distinct quantum size effects. Therefore, one needs to precisely control the number of gold atoms in the Aun(SR)m cluster.Those early-made gold thiolate clusters were typically hydrophobic (capped by alkanethiolates or arylthiolates), and were only amenable to LDI or MALDI characterization at that time. Unfortunately, LDI or MALDI tends to fragment the cluster85,86 (e.g. loss of thiolate ligands, breaking of Au–S or S–C bonds, or even loss of gold atoms), hence, it was not possible to determine the intact cluster mass and to further deduce the formula. It is highly desirable to come up with a system that is amenable to electrospray ionization (ESI) mass spectrometry characterization. Compared with LDI and MALDI, ESI is a much softer ionization technique, which allows for the determination of the intact cluster mass, based upon which one can deduce the exact cluster composition in conjunction with other characterization such as elemental analysis. The goal of determining the cluster formula is certainly very important, as the availability of the precise cluster composition (i.e. the numbers of gold atom and thiolate ligand) will permit theoretical prediction of the cluster structure and will benefit many other studies. In early times, ESI-MS analysis was usually done in aqueous solutions (note: nowadays one can routinely perform ESI analysis for organic solution samples). To utilize ESI-MS, Schaaff et al.87 explored a water-soluble tripeptide thiol, glutathione (GSH = y-Glu-Cys-Gly) for the synthesis of water-soluble gold clusters. The bulky GSH ligand was also thought to exert some potential steric effect on cluster size control. A new species was indeed isolated by running polyacrylamide gel electrophoresis (PAGE) separation on the as-prepared mixture, and this cluster was amenable to full characterization with ESI-MS.87,88 The mass of the intact cluster was precisely determined to be 10.4 kDa, Fig. 4; based upon the exact mass the cluster was formulated as Au28(SG)16 (later corrected as Au25(SG)18, see Tsukuda's work, vide infra). Multiple optical absorption bands were observed in this cluster, which was ascribed to quantum confinement effects in the cluster.
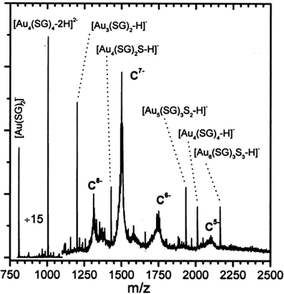 | ||
| Fig. 4 ESI mass spectrum of the 10.4 k species. The −5, −6, −7, and −8 charge states of the cluster and various low-molecular-weight fragment ions were seen. Reproduced from ref. 87 with permission. Copyright 1998 American Chemical Society. | ||
Murray and coworkers report the synthesis and isolation of a molecule-like cluster89,90 initially erroneously formulated as Au38(SR)24 (later corrected to Au25(SR)18). The synthesis was based upon their earlier synthetic work on arenethiolate-protected gold nanoparticles.55 Lee et al. also performed voltammetry and electron-transfer dynamics studies on these clusters.91,92 Quinn and coworkers reported83 the synthesis and electrochemical properties of Au38(SR)24 clusters (should be corrected to Au25(SR)18). In Quinn's work, the cluster was isolated after thiol etching of a crude product made by following a modified protocol of the one reported by Hicks earlier.82 Abid et al.93 reported the synthesis of ω-hydroxy hexathiolate-protected gold clusters; by employing quantitative high-angle annular dark-field scanning transmission electron microscopy (HADF-STEM) in conjunction with other analyses, the cluster composition was determined to be Au13(SC6OH)8 (note: This cluster showed an almost identical absorption spectrum to Au25(SR)18, so perhaps it should be corrected to Au25(SC6OH)18).
Tsukuda and coworkers were attracted by the Aun(SG)m system and performed a high-resolution PAGE separation of the Aun(SG)m clusters and conducted an impressive study of ESI mass spectrometry analysis of all the isolated species.94 Very clean ESI-MS spectra were for the first time attained, indicating the high purity of the as-separated Aun(SG)m clusters and greatly improved ESI conditions (i.e. suppressed fragmentation of clusters in ESI analysis). Six species were isolated with their formula determined by ESI-MS to be 1 = Au18(SG)11, 2 = Au21(SG)12, 3 = Au25±1(SG)14±1, 4 = Au28(SG)16, 5 = Au32(SG)18, 6 = Au39(SG)23. Among them, species 3 seems to still be a mixture, while others showed well defined patterns of multiply charged ions in the mass spectra. The assignment of these species needed refinement due to the limited mass spectrometric resolution (m/Δm ∼ 400) at that time. In a follow-up report,95 Negishi et al. re-assessed the clusters by taking advantage of freshly prepared samples, higher mass resolution, and more accurate mass calibration. Nine cluster species were identified and reassigned to Au10(SG)10, Au15(SG)13, Au18(SG)14, Au22(SG)16, Au22(SG)17, Au25(SG)18, Au29(SG)20, Au33(SG)22, and Au39(SG)24, respectively, Fig. 5; note that some of the formula are re-assignments of the earlier reported clusters.94 Of note, the Au25(SG)18 cluster was for the first time identified and confirmed by detailed ESI analysis. Among these clusters, the Au25(SG)18 cluster was also demonstrated to be particularly stable compared to other sizes.96–98
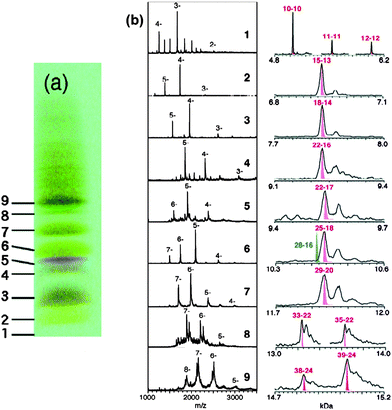 | ||
| Fig. 5 Left picture: PAGE results for the Au:SG cluster mixture. Mid and right panels: Low-resolution and high-resolution ESI mass spectra of the fractionated Au:SG clusters. Reproduced from ref. 95 with permission. Copyright 2005 American Chemical Society. | ||
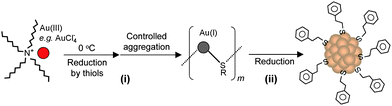
Our group became involved in gold nanocluster research mainly motivated by the observation that ultra-small nanoparticles (<2 nm) were actively involved in the shape-controlled synthesis of gold and silver nanocrystals (e.g., nanoprisms, nanorods) (unpublished work). Prior to our work on gold thiolate clusters, the synthetic method had already been well developed by Whetten, Murray, and Tsukuda et al. In a standard protocol, ∼3× thiol and ∼10× NaBH4 were typically used, and the addition of NaBH4 was usually performed at low temperatures (0 °C or −78 °C, the latter is however cumbersome). In regard to the two main reduction steps [eqns (15) and (16)], we focused on the Au(I):SR intermediates [eqn (15)] and thought that the Au(I):SR aggregates could be dug out for controlling cluster size and, more importantly, the cluster monodispersity. Since the formation of Au(I)SR aggregates occurs after the reduction of Au(III) into Au(I) by excess thiol [Scheme 1, step (i)], the reaction temperature was thought to potentially affect the Au(I)SR aggregation process, hence, resulting in some differences in the structure of the aggregates and ultimately influencing the product purity and possibly the gold cluster size as well. This was indeed the case as demonstrated in our experiments. By performing the reduction of Au(III) to Au(I) at 0 °C (as opposed to at room temperature typically done by others) and also by controlling the stirring speed during the Au(I) aggregation (or self-assembly) process, we were able to obtain Au25(SR)18 clusters in high yield and more importantly, in high purity, as evidenced by the well-defined UV–vis absorption spectrum of the crude product without any purification, Fig. 6.99 The high purity of the Au25 clusters permitted us to grow high-quality single crystals of Au25 in later work (vide infra).
 | ||
| Scheme 1 High-yield synthesis of gold thiolate clusters via kinetic control. | ||
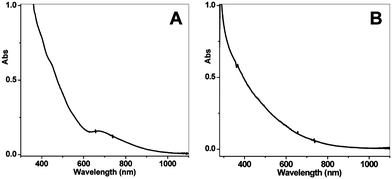 | ||
| Fig. 6 UV–vis spectra of the final crude products, (A) prepared using the low-temperature method as shown in Scheme 1, and (B) using the room-temperature standard protocol (the temperature control in the kinetically controlled synthetic method is for step (i) as shown in Scheme 1). Reproduced from ref. 99 with permission. Copyright 2008 American Chemical Society. | ||
Our finding of the kinetic control conditions for the high-yield synthesis of Au25(SR)18 in high purity is quite interesting and deserves a more detailed investigation on the mechanism (work underway). Very recently, this kinetic control approach has also been extended to prepare Au25 clusters capped with functionalized thiols100 as well as Au20(SCH2CH2Ph)16.101 The Au20(SCH2CH2Ph)16 cluster exhibits a quite large optical energy gap (Eg ∼ 2.15 eV), cf. the HOMO–LUMO gap (1.3 eV) of Au25(SCH2CH2Ph)18. The kinetic control method may be extendable to the synthesis of other size-discrete Aun(SR)m clusters.
Another quite useful method for making monodisperse Aun(SR)m clusters is the thiol etching method. In Whetten's early work, they conducted thiol etching on a mixture of 14 k and 8 k species, and found that the 8 k species became enriched after thiol etching of the mixture.84 In some cases, phosphine-protected gold clusters can be exploited to prepare gold thiolate clusters. Hutchison and coworkers reported an improved synthesis of phosphine-capped Au11 clusters and ligand exchange with thiols to make small thiolated clusters.102–104 Woehrle et al. also performed systematic studies on the mechanism of thiol etching of phosphine-capped Au nanoclusters.105 In another report, phosphine-capped Au∼55 clusters were converted to Au∼75 following thiol etching with C6–SH.106 Shichibu et al. reported the conversion of Au11phosphine clusters to Au25(SG)18 in the presence of excess GSH.107 Price and Whetten prepared a 8.7 kDa (MALDI-MS determined) species of benzenethiolate-capped gold clusters following an oxidative etching of 22 k clusters.108 Qian et al. found that phosphine-capped, polydisperse Au nanoparticles (predominantly 1–3.5 nm) can be utilized as a common starting material for respective conversion into well-defined monodisperse 25-atom (Au25) nanorods and nanospheres via one-phase and two-phase thiol etching, respectively.109 This work demonstrates that the Au25 particle shape can be conveniently controlled by using different types of ligands in the thiol etching step. This conversion process is striking in two features: size focusing and shape control, and may be extendable to the synthesis of other robust well-defined Au nanoclusters. Overall, the ligand exchange from phosphine to thiol seems to result in a core size change. In another system, Tsunoyama et al. also used octadecanethiol (C18–SH) to etch pre-formed gold clusters stabilized by poly(N-vinyl-2-pyrrolidone) (PVP) and obtained four fractions after recycling size-exclusion chromatography separation.110 The as-obtained Au:SC18 clusters were determined to be 8, 11, 21, and 26 kDa by LDI mass spectrometry. This sequence of core sizes is different from the series of 8, 14, 22, and 29 kDa obtained by direct reduction of Au(I)–SCnpolymers by NaBH4, in the latter the kinetic factors apparently play a major role.
Recently, Chaki et al. reported the synthesis of 8 k and 29 k species following a thiol etching method, but the yield was quite low.111 These clusters are assigned to be Au38(SCn)24 and Au144(SCn)59 on the basis of detailed ESI-MS analysis. Quinn and coworkers also reported the synthesis of Au38(SC6)22, but atomically monodisperse clusters were not obtained.112 The assignment of the formula is based upon LDI-MS characterization; it perhaps should be corrected as Au38(SC6)24. Qian et al. reported an improved thiol etching method using glutathione-capped Aun(SG)m as a starting material; this method allows, for the first time, a large-scale synthesis of Au38(SC12)24 clusters.113 The method has also been extended to the synthesis of phenylethylthiolate-capped Au38(SC2H4Ph)24 clusters.114 A mechanistic understanding of the details of the conversion process remains to be done. The high purity and largely improved synthetic yield of Au38(SR)24 has opened up the possibility of growing single crystals of Au38(SR)24 for X-ray structural determination. Regarding the 29 k species, early work by Whetten and Murray et al. determined its composition to be roughly Au∼140.76,89,90 The precise Au144(SR)59 formula reported by Chaki et al. is interesting. Theoretical calculations by Lopez-Acevedo et al. assumed the Au144(SR)60 formula; they predicted an icosahedron-based structure.115 Qian et al. recently developed a two-step method for the synthesis of atomically monodisperse Au144 nanoclusters and performed a detailed analysis on the formula of the clusters. ESI-MS, thermogravimetric and elemental analyses, all confirmed the Au144(SR)60 formula (where R = C12H25 or CH2CH2Ph).116 The discrepancy between Au144(SR)59 and Au144(SR)60 is still unclear.
The thiol analogue of phosphine-protected 55-atom gold clusters is particularly attractive. Although the Au55phosphine cluster remains to be verified by X-ray crystallography,31 some preliminary work has identified a gold thiolate species close to Au55. Inomata and Konishi reported thiolated 14 kDa clusters.117 Schmid et al. reported the preparation of Au55 protected by dodecaborate and silsesquioxane thiols.118,119 Tsukuda and coworkers120 further pushed forward the search for the Au55thiolate cluster in their recent work, and observed a 11 kDa species (AunSm+ in LDI-MS) by high-resolution chromatographic fractionation of Au:SCn clusters prepared by thiolation of aqueous polymer (poly(N-vinyl-2-pyrrolidone), PVP)-stabilized Au clusters (∼1.3 nm). Based upon LDI-MS characterization, the cluster composition was suggested to be Au55(SCn)32 clusters (chain length n = 12, 18), but the exact formula remains to be verified by ESI-MS.120
For aqueous gold thiolate clusters, Ackerson et al. investigated a variety of water-soluble thiols and synthetic conditions for gold thiolate clusters.56 Their detailed work led to the successful crystallization of Au102(p-MBA)44 clusters,23 albeit the clusters were not monodisperse.†It is quite amazing that single crystals of Au102(p-MBA)44 were obtained from a polydisperse sample. Negishi et al. also prepared water-soluble gold thiolate clusters using various ligands and separated the mixture by PAGE.121 In another report, Zhang et al. conducted the synthesis and HPLC (C18 reversed phase column) separation of gold clusters stabilized by N-acetyl-L-cysteine.122 Yao et al. used penicillamine to prepare small gold clusters.123 For Aun(SG)m clusters, Kimura et al. also attempted to analyze larger clusters124 than those isolated by the PAGE method previously.95
It is worth noting that in the determination of the exact composition of gold thiolate clusters, ESI-MS has become an indispensable tool. In this regard, the Tsukuda and Murray groups have done impressive mass spectrometry work. Examples include the first correct identification of Au25(SG)18 in Tsukuda's early ESI-MS work95 and recent ESI-MS determination of Au38(SCn)24 and Au144(SCn)59,111 as well as recent reports by Tracy et al. on ESI analysis of Au25(SR)18 clusters by adding alkali acetate to promote cluster ionization.125 Apart from the ESI work, Dass et al.126,127 also demonstrated MALDI-MS analysis of intact Au25(SR)18 clusters using a special compound trans-2-[3-(4-tert-butylphenyl)-2-methyl-2-propenyldidene] malononitrile (abbreviated as DCTB) as a matrix. All these advances have pushed forward the gold thiolate cluster research. However, the molecular mass determination of large Aun(SR)m nanoclusters still remains a challenge, albeit in the case of Au144(SR)60 successful determination of the exact molecular mass has been attained.116
To summarize the chemical synthesis of Aun(SR)m nanoclusters, the various synthetic methods reported include solubility-based fractionation of mixed clusters, the kinetic control approach, and the thiol etching method. Overall, recent synthetic work has produced several truly monodisperse nanoclusters in bulk quantities, including Au20(SR)16,101 Au25(SR)18,87,89,99,107 Au38(SR)24,113,114 Au144(SR)60,116 and the various Aun(SG)m clusters.95 Future work should extend the synthetic chemistry or develop new approaches to preparing more size-discrete Aun(SR)m nanoclusters with their exact composition determined by ESI-MS. The purity of the clusters is perhaps the most important factor in all synthetic work, otherwise, their exact molecular formula cannot be unambiguously determined.
4. Properties of thiolate-protected gold clusters
The material properties of gold thiolate clusters constitute the most exciting part of the entire research of gold thiolate clusters. Below we shall summarize recent advances in understanding the structural, electronic, optical and magnetic properties of gold thiolate clusters. The Au102(p-MBA)44 and [Au25(SCH2CH2Ph)18]q (q = −1, 0) clusters will be used as examples to illustrate the interesting material properties of Aun(SR)m clusters.Note the electrochemical properties of gold clusters will not be covered herein as there have been several excellent reviews by Murray128 and Quinn.129
4.1. Atomic packing structure of Aun(SR)m clusters
One of the most interesting and important aspects of Aunthiolate clusters is their atomic packing structure. Two major questions are to be answered.i) Whether the structure of Aun(SR)m clusters resembles that of their larger counterparts (Au nanocrystals or bulk gold, i.e. fcc structure). Previously Cleveland et al. theoretically predicted fcc-based octahedral or decahedral structures of gold clusters.75 This remains to be verified by experiment. If non-fcc structures are adopted in gold thiolate clusters, then an interesting question pertains to how the atomic packing mode evolves with cluster size. In the case of phosphine-protected gold clusters, including Au13 and bimetal clusters such as Au13Ag12 and Au18Ag20, a ubiquitous icosahedral structural motif was identified.21,33–35
ii) What kind of bonding mode does the Au–S linkage adopt? In SAM research, a generally accepted mode is the terminal Au–S mode.46,47,130 Whether there is some similarity between Aun(SR)m clusters and SAMs is yet to be determined.131,132
To determine the crystal structure of gold thiolate clusters, the best and most reliable approach is still X-ray crystallography. Unfortunately, to grow high-quality single crystals of Aun(SR)m clusters is, in general, very difficult, albeit breakthroughs have been made recently in the cases of Au102(SPhCOOH)44 and [Au25(SCH2CH2Ph)18]q (q = −1, 0) clusters. Overall, single-crystal growth still remains the most challenging part of gold thiolate cluster research.
The first succeeded case is Au102(p-MBA)44, where p-MBA = SPhCOOH, Kornberg and coworkers were able to coax these clusters into single crystals and successfully determined their X-ray structure.23 The cluster can be viewed as an Au49 Marks decahedral kernel.133Fig. 7a–b show the top and side views of the Au49 kernel. The rest of the 53 Au atoms can be divided into three groups:133 1) 30 green Au atoms (Fig. 7c–d), these gold atoms form two symmetry-equivalent 15-atom rhombicosi-dodecahedral fragments and face-cap the Au49 MD under pseudo D5h symmetry, forming the Au79 kernel; 2) 10 yellow Au atoms (Fig. 7c–d) cap the 10 square-shaped Au (green) facets of the Au79 kernel under pseudo D5h symmetry, forming a protecting layer; 3) 13 blue Au atoms (Fig. 7c–d) are multiply connected as part of a steric/electronic coating to the red and/or green Au atoms of the Au79 kernel. The 44 p-MBA ligands interact not only with gold but also with one another, forming a rigid surface layer. Interestingly, the Au102(SPhCOOH)44 clusters are chiral, with the two enantiomers alternating in the crystal lattice.23
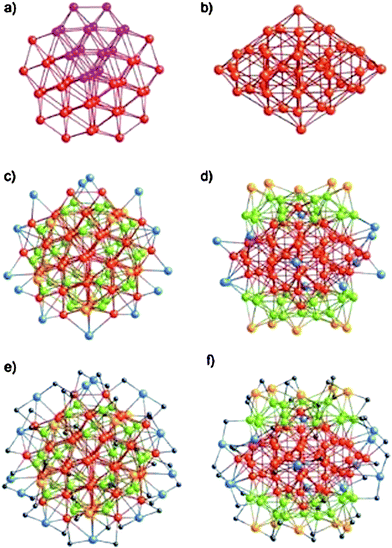 | ||
| Fig. 7 Anatomy of the Au–S framework of crystallographic C2 site symmetry in Au102(SR)44. a–b) top and side views of the Au49 Marks decahedron (pseudo D5h symmetry); c–d) pseudo C5 and crystallographic C2 axial views of the bare Au102 structure. e–f) pseudo C5 and crystallographically C2 axial views of the entire Au102(SR)44 cluster. Reproduced from ref. 133 with permission. Copyright 2008 Wiley-VCH. | ||
The second case is [Au25(SCH2CH2Ph)18]q clusters (q = −1, 0). Shortly after the synthesis of [Au25(SCH2CH2Ph)18]−via a kinetic control approach,99 we succeeded in growing single crystals of [Au25(SCH2CH2Ph)18]− (counterion: TOA+) in 2007. The high purity of [Au25(SCH2CH2Ph)18]− seems the key to our successful growth of high-quality single crystals of [Au25(SCH2CH2Ph)18]−. Ironically, the single crystals grown by Zhu25 did not attract my immediate attention due to my inexperience in X-ray crystallography and also because of some other reasons. The X-ray structure of [Au25(SCH2CH2Ph)18]− was not worked out until 2008, Rosi did initial trials in late 2007 and the exact structure was solved by Hollander early 2008.25
It should be noted that the anionic cluster structure was also independently reported by the Murray group24 and theoretically predicted by Hakkinen et al.134 These three reports appeared in the Journal of the American Chemical Society back to back in early 2008. It is also worth noting that in Murray's work, the crystallization method seems somewhat different than the method reported by us; Heaven et al. introduced Ph–SH in the crystal growth solution,24 while in Zhu's method, the [Au25(SCH2CH2Ph)18]−TOA+ crystals were directly grown from a solution of [Au25(SCH2CH2Ph)18]− clusters (mixed toluene–ethanolsolvent) without any additives.25
X-Ray crystallographic analysis 25 shows that the Au25 cluster features a centered icosahedral Au13 core (Fig. 8A), which is further capped by a second shell comprised of the remaining twelve Au atoms. The best way to appreciate the symmetry of the Au25 cluster is to view it along the three mutually perpendicular C2 axes of the icosahedron (x, y, and z, Fig. 8A); one can readily define how the remaining twelve Au atoms are situated, i.e., they are in six pairs around the ±x, ±y, and ±z axes (Fig. 8B). Apparently, the twelve exterior Au atoms do not form a closed shell on the Au13 icosahedron because the icosahedron has 20 triangular faces (Au3) and, only twelve of them are face-capped, leaving eight Au3 triangular faces uncapped. The entire Au25 cluster is protected by eighteen –SR ligands.25 By taking into consideration the electronic structure of the cluster (vide infra), one may view the Au25(SR)18 structure as an Au13 icosahedral kernel capped by six extended staple motifs –S–Au–S–Au–S– (i.e. Au2S3) along the ±x, ±y, and ±z axes (i.e., six pairs of Au2S3).
![Anatomy of the Au–S framework of a [Au25(SCH2CH2Ph)18]− cluster (counterion: TOA+). For clarity, only Au and S atoms are shown. Reproduced from ref. 25 with permission. Copyright 2008 American Chemical Society.](/image/article/2010/NR/b9nr00160c/b9nr00160c-f8.gif) | ||
| Fig. 8 Anatomy of the Au–S framework of a [Au25(SCH2CH2Ph)18]− cluster (counterion: TOA+). For clarity, only Au and S atoms are shown. Reproduced from ref. 25 with permission. Copyright 2008 American Chemical Society. | ||
We have also solved the crystal structure of a charge-neutral [Au25(SCH2CH2Ph)18]0 cluster, which was converted from the anion via air oxidation.26 The one-electron loss of the [Au25(SCH2CH2Ph)18]− cluster in its conversion to [Au25(SCH2CH2Ph)18]0 is a surprise in light of the chemical inertness of gold nanoparticles; note that bulk gold cannot be oxidized by O2. X-Ray crystallography shows that, in contrast with the crystal structure of the anionic cluster which exhibits apparent structural distortions in the Au25S18 framework (Fig. 9A and C), such distortions are not observed in the neutral cluster (Fig. 9B and D). The charge effect is also manifested in the optical absorption spectra of the clusters (see section 4.2).
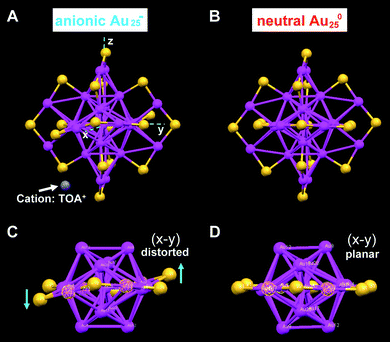 | ||
| Fig. 9 Comparison of the crystal structures of Au25 anionic (A and C) and neutral (B and D) clusters. Both clusters are capped by eighteen phenylethanethiol ligands (for clarity C and H atoms are omitted); for anionic Au25, the counterion is tetraoctylammonium TOA+ (only N (in blue) is shown for clarity). Reproduced from ref. 26 with permission. Copyright 2008 American Chemical Society. | ||
Compared with the Au102(SR)44 structure in which simple –Au–S–Au– staples (total 19 simple RSAuSR staples, plus two RS(AuSR)2 extended staples) dominate the Au–S bonding mode, the gold core structure and the Au–S bonding mode apparently evolve with cluster size. It remains to be seen, after more crystal structures of gold thiolate clusters are solved in the future, how the atomic packing structure evolves with cluster size. Since Au nanocrystals (>2 nm) typically exhibit fcc structure (evidenced by XRD), the icosahedral structure (observed in Au25) must disappear at some size with increasing cluster size and transform to close-packed layer structures. It also remains to be seen whether other types of Au–S bonding modes appear in other sized Aun(SR)m clusters. On the other hand, whether gold thiolate clusters can adopt hollow cages or helical structures is an interesting question. From the theoretical side, Zeng and coworkers135 recently studied the (AuSR)n (n = 6–12) by using a global-minimum search method and revealed a new family of double helical structures in small-sized Au(I) thiolate clusters (n = 6–9) and the separate-ring structures in larger clusters as well. These structures are different from previously known zigzag crown structures for (AuSR)n (n = 6–12) and catenane structures for (AuSR)n (n = 10, 12). An interesting question is: Can these hollow or helical structures be adopted in ligand-protected Aun(SR)m clusters? It is worth noting that, in a recent theoretical study, Hakkinen et al. predicted the existence of a hollow Au12 cage (as the inner-most shell) in a Au144(SR)60 cluster.115
4.2 Electronic structure and optical properties of Aun(SR)m clusters
Prior to the X-ray structural determination of Aun(SR)m clusters and theoretical calculations based upon X-ray structures, the nature of the cluster's absorption peaks and their electronic origin were not understood. The available crystal structures of Au102(p-MBA)44 and [Au25(SCH2CH2Ph)18]q (q = −1, 0) have permitted an in-depth understanding of both the electronic and optical properties. Below we shall discuss the DFT-calculated electronic structures of Au102 and Au25 clusters based upon X-ray crystal structures.For the Au102(p-MBA)44 nanocluster, Hakkinen et al. performed DFT calculations and found that the gold atoms in the cluster are in two distinct chemical states: the 79 core Au atoms are in a metallic (charge-neutral) state whereas the 23 Au atoms that belong to protecting RS(AuSR)x units are oxidized.136 This composition evokes the “divide and protect” structural feature proposed earlier.137 The Au23(p-MBA)44 layer can further be divided into 19 RS(AuSR) units and 2 RS(AuSR)2 units. The electronic structure of the Au79 features a delocalized electron-shell structure. Zeng and coworkers also performed DFT calculations on a Au102(SCH3)44 model cluster.138 The calculated HOMO–LUMO gap is 0.54 eV, consistent with the DFT calculations by Hakkinen et al.136 and by Li et al.139 These results imply that the relatively high stability of the Au102(p-MBA)44 nanocluster may be attributed to the electronic shell closing of the 58 valence electrons, that is, 102 (Au) − 44 (thiolate) = 58e, by assuming each thiolate consumes one 6s valence electron of gold. With respect to the optical properties of Au102(p-MBA)44 clusters, no experimental data has been reported.
In the case of Au25(SCH2CH2Ph)−18, shortly after we attained its X-ray structure, we collaborated with Schatz and Aikens, who carried out DFT calculations on the basis of the crystal structure and achieved a deep understanding of the quantum confinement nature of the electronic structure and the optical absorption spectrum.25 To reduce the computational demand, Au25(SH)−18 was used as a model of Au25(SCH2CH2Ph)−18. The calculated Kohn–Sham molecular orbitals (MOs), energies, and atomic orbital (AO) contributions are shown in Fig. 10A. In the electronic structure of Au25(SH)−18, the HOMO and the lowest three LUMOs are mainly composed of 6s (or 6sp) atomic orbitals (labeled in green) of gold, thus, these orbitals constitute the sp-band if we keep the solid-state terminology (Fig. 10A). The HOMO level is nearly triply degenerate while the LUMO is doubly degenerate. The HOMO-1 through HOMO-5 levels are mainly constructed from the 5d10 atomic orbitals (labeled in blue) of gold and hence constitute the d-bands (Fig. 10A). Note that both sets of HOMO and LUMO orbitals have a significant degree of the S(3p) (labeled in yellow) character, indicating the ligand influences the electronic structure of the cluster. The computed HOMO–LUMO gap (1.3 eV) agrees well with the experimental value,25 also consistent with the theoretical calculations by Akola et al.134
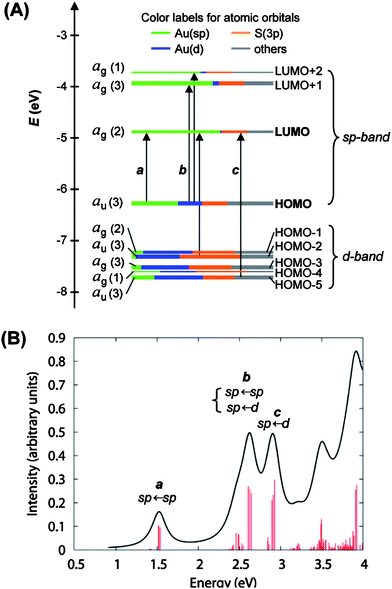 | ||
| Fig. 10 (A) Kohn–Sham orbital energy level diagram for a model compound Au25(SH)−18. Each KS orbital is drawn to indicate the relative contributions (line length with color labels) of the atomic orbitals of Au (6sp) in green, Au (5d) in blue, S (3p) in yellow, and others in grey (those unspecified AOs, each with a <1% contribution). The left column of the KS orbitals shows the orbital symmetry (g, u) and degeneracy (in parentheses); the right column shows the HOMO and LUMO sets. (B) The theoretical absorption spectrum of Au25(SH)−18. Reproduced from ref. 25 with permission. Copyright 2008 American Chemical Society. | ||
It is interesting to notice that the envelope of the electronic structure of Au25 bears some resemblance to the band structure of bulk gold (Fig. 1B), that is, the 5d-bands are very densely spaced (i.e. high density of states), while a significant energy quantization occurs to the 6s-band. This picture qualitatively agrees with the prediction of the free-electron model (Fig. 1C), but the uneven distribution of the quantized energy levels of the 6s band cannot be described by the free-electron model since the latter assumes equally spaced electron energy levels. Moreover, the naïve free-electron model cannot account for the ligand effects since surface is not taken into account by solid-state theory.
4.3 Optical properties of Aun(SR)m clusters
The optical properties of gold clusters is one of the most interesting material properties. Since no experimental data on the optical properties of Au102(p-MBA)44 clusters has been reported. Herein we use only Au25(SR)18 as an example to illustrate the quantum size effect on the optical absorption spectrum. A precise correlation of the Au25 structure with its optical absorption properties was obtained.25 The theoretical spectrum for Au25(SH)−18 agrees quite well with experiment, especially in the spectral shape (compare Fig. 10B and Fig. 11). The first excited transition occurs at 1.52 eV (peak a in Fig. 10B and Fig. 11) and corresponds to a LUMO←HOMO transition (Fig. 10A), which is essentially an intraband (sp←sp) transition. Because only the three orbitals in the HOMO (triply degenerate) have more s character than d character, transitions arising out of the other occupied HOMO-n orbitals tend to be interband (sp ← d) transitions (Fig. 10A). The peak at 2.63 eV (b in Fig. 10B and Fig. 11) arises from mixed intraband (sp←sp) and interband (sp←d) transitions (Fig. 10A). The peak at 2.91 eV (c in Fig. 10B) arises principally from an interband transition (sp←d). Taken together, the optical absorption properties of Au25 clusters apparently root in strong quantum confinement of electrons in the cluster. This cluster serves as a good example to illustrate the quantum size effect on the optical properties of gold clusters. Unlike Au nanocrystals in which surface plamsons (collective excitation of conduction electrons) dominate the optical properties, ultra-small Au25(SR)18 clusters manifest one-electron transitions. An interesting question is how many electrons are needed to support plasmon excitation. This remains to be revealed in future work.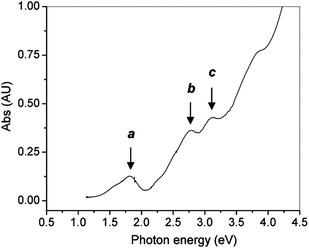 | ||
| Fig. 11 The UV–vis spectrum of Au25 clusters (single crystals redissolved in toluene). Reproduced from ref. 25 with permission. Copyright 2008 American Chemical Society. | ||
According to the free-electron model we discussed in section 2. It would be interesting to find out from what AOs the MOs (e.g. the HOMO and LUMO) are constructed, so that one could appreciate the possible electron delocalization and localization features. In this regard, the HOMO, LUMO, and other orbitals including the LUMO + 1 and LUMO + 2 are comprised almost exclusively of AO contributions from the 13 Au atoms in the icosahedral kernel rather than the 12 exterior Au atoms. Thus, the first peak in the absorption spectrum (a in Fig. 10 and Fig. 11) can be viewed as a transition that is due entirely to the electronic and geometric structure of the Au13 core. This is strikingly different from a biicosahedral [Au25(PPh3)10(SCn)5Cl2]2+ structure;140–142 this structure shows a similar low energy band at 1.76 eV, but its origin is revealed by DFT calculations to arise from the interaction between the two vertex-sharing Au13 icosahedra rather than the electronic transition within the individual Au13 unit. These results clearly demonstrate that the cluster structure plays an important role in the optical properties.
Aikens recently performed a more detailed time-dependent DFT calculations on the optical absorption spectra of Au25(SH)−18 and mixed-metal “core–shell” systems Au13Ag12(SH)−18 at the SAOP/TZP level of theory.143 The splitting between the LUMO and LUMO + 1 and between the HOMO and HOMO-1 varies markedly with the type of metal in the M13 core and in the oligomeric thiolate ligands. An important conclusion is that the optical absorption spectra are not separable into core and ligand contributions; geometric and electronic interactions between the Au13 kernel and the surface are responsible for complex absorption spectra, albeit in afore-discussions the Au25(SR)18 structure was dissected into an Au13 kernel and six –S–Au–S–Au–S– staple motifs.
Comparing the optical spectra of the anion and of neutral [Au25(SC2H4Ph)18]q (q = −1, 0). The cluster charge shows some effects on the optical absorption spectrum.26,92,144 The overall spectral profiles are quite similar, but the 800-nm band observed in the anion disappears in the neutral [Au25(SR)18]0 cluster, and the 400 nm band is less pronounced in the anion but become very prominent in the neutral cluster.26 These fine features can serve as spectroscopic fingerprints and allow for a convenient identification of the cluster charge state in practical work.
With respect to the nonlinear optical properties, Ramakrishna et al. demonstrated that quantum-sized gold clusters can be used as efficient two-photon absorbers.145 Miller et al.146 have performed a femtosecond spectroscopic study on the ultra-fast excited-state relaxation dynamics of Au25(SCH2CH2Ph)−18 clusters and observed an 80 cm−1 vibration localized to the Au13 kernel; this mode reflects the strong vibronic coupling of a delocalized Au–Au bond-stretching vibration, which is analogous to the radial breathing modes of larger Au nanoparticles. The nonlinear optical properties and electron dynamics of gold thiolate clusters remain to be fully explored in future studies when more size-discrete clusters become available.
Creutz et al. observed the Au–S stretch bands in the range 170–270 cm−1 for thiolate-protected ∼2 nm Au nanoparticles.132 The Au–S stretch frequencies observed seem similar to those found from HREELS of alkanethiol SAMs on Au(111).131 Therefore, the valence state of surface gold atoms in the thiolate clusters should somewhat resemble Au(I), and this picture is consistent with the descriptions of the surface Au(I)-bridged thiolate “staples” on both Au102 and Au25 clusters.
Walter et al. recently invoke a superatom picture to describe the electronic properties of thiolate-protected gold clusters.136 For examples, the stability of Au102(SR)44 and Au25(SR)18 can be ascribed to the electronic shell closing, i.e., 1S21P61D102S21F142P61G18 (total valence electrons = 58 e) for Au102(SR)44), and 1S21P6 (total: 8 e) for Au25(SR)−18. This picture also seems to work for previous phosphine-capped clusters. Jiang and Dai recently applied the superatom concept to the core-substitution chemistry of M@Au24(SR)−18, and searched the periodic table for the potential core atom M by applying a simple rule derived from the 8-electron count to create many series of M@Au24(SR)−18 core–shell nanoclusters.147 Sixteen elements from groups 1, 2, and 10–14 of the periodic table are found to maintain both the electronic and geometric structures of the original Au25(SR)18 cluster, indicating that the electron-counting rule based on the superatom concept is quite useful in predicting M@Au24SR18q clusters and may provide useful information for experimental exploration.147
Comparing with Au nanocrystals that are metallic and exhibit a strong plasmon absorption band (at 520 nm for spherical nanocrystals), the multi-band absorption spectrum of Au25 clusters is quite striking. It remains to be seen how the optical properties of Aun(SR)m clusters evolve with increasing cluster size. Experimentally, previous work has shown a gradual broadening and concurrent decrease in intensity of the surface plasmon resonance at ∼520 nm into a nearly featureless decay spectrum observed from the 3.2 to 1.4 nm size series.73 However, these particles are not truly monodisperse; the presence of mixed sizes readily washed out the step-like absorption bands in clusters. For future work, it is essential to prepare a series of size discrete, atomically precise Aun(SR)m clusters and grow single crystals for structural determination. DFT calculations in conjunction with experiment should reveal the evolution of the optical properties of Aun(SR)m clusters.
4.4 Chiroptical properties of Aun(SR)m clusters
The chiral optical response from the Aun(SR)m clusters is an intriguing issue, which is less conclusive. Previously, Whetten and coworkers observed distinctive circular dichroism (CD) signals from Au28(SG)16 clusters (corrected to Au25(SG)18).87 They suggested three possible mechanisms to interpret the origin of the observed optical activity, (i) the structure of the Au25 core is inherently chiral; (ii) the adsorption of the –SG thiolates on the core's surface results in a chiral pattern of adsorbate interactions with an inherently achiral core; (iii) chiral elements of the –SG adsorbates induce optical activity in the core electronic structure, even though neither the adsorption pattern nor the core structure is chiral. For the first possibility, a good example is Au102(SR)44 clusters, in which a chiral arrangement of gold atoms was indeed observed.23In recent work, Yao, Burgi and others have performed extensive work on the chiroptical properties of Aun clusters capped by various chiral thiolates.123,148–150 Due to the unavailability of crystal structures of these clusters, there have been no definitive conclusions yet in terms of the origin of the chiroptical bands. Some examples are given below to illustrate some interesting experimental observations.
Yao et al.149 reported gold nanocluster enantiomers protected by optically active thiols: D- and L-penicillamine (D-Pen and L-Pen). Strong optical activity was observed in the two enantiomers with a mirror image relationship in the CD spectrum. The results suggest that the nanoclusters have well-defined stereostructures as conventional chiral molecules do, and that the surface modifier acts as a chiral selector. Several different sized clusters (mean diameter of 0.57, 1.18, or 1.75 nm, separated by PAGE) were investigated, and optical activity or anisotropy factors increased with a decrease in the cluster size. The CD signals of clusters were also found to exhibit a temperature dependence (20 and 40 °C),149 in contrast with their ordinary absorption spectra which were essentially temperature independent. A dissymmetric field model was used to explain the origins of their optical activity. Yao et al.150 also found that chiral ephedrinium cations can effect a phase transfer of aqueous racemic penicillamine-protected gold nanoclusters into chloroform and lead to appreciable optical activity of the transferred clusters in the metal-based electronic transition region, but the ordinary absorption spectrum of the clusters is unchanged. This symmetry breaking of the optically inactive gold nanoclusters is quite interesting and further supports that the observed optical activity is likely induced by the ligand dissymmetric field brought about by the surface stereostructures.
Gautier and Bürgi151 prepared gold clusters capped with N-isobutyryl-L-cysteine and N-isobutyryl-D-cysteine, respectively. These particles have core sizes (Aun, n = 10–12, 15 and 18 gold atoms, respectively) show step-wise optical absorption spectra, indicating a quantized electronic structure. Some separated clusters exhibit strong optical activity in both UV–vis and IR regions with opposite sign when capped with the D- and L-enantiomers of N-isobutyryl-cysteine, respectively. The origin of the optical activity in the metal-based transitions is consistent with a mechanism that is based on a chiral footprint on the metal core imparted by the adsorbed thiol.
A similar ligand-pertained effect was also found in phosphine-capped [Au11(BINAP)4X2]+ (X = Cl and Br) clusters,152 where BINAP represents chiral bidentate phosphine ligand 2,2-bis(diphenylphosphino)-1,1-binaphthyl. Achiral monodentate phosphine-capped Au11(PPh3)X+2 clusters did not show any CD signals, while Au11 stabilized by the enantiomers, [Au11(R-BINAP)4X2]+ and [Au11(S-BINAP)4X2]+, exhibited intense and mirror-image Cotton effects.152 Yanagimoto et al. discussed the origin of the chiroptical activity of [Au11(BINAP)4X2]+ in the context of the structural deformation of the Au11 core.
The case of Au25(SG)−18 deserves a more detailed discussion since the crystal structure of the phenylethylthiolate analogue has been solved. A natural question would be whether Au25(SG)18 adopts the same structure of Au25(SCH2CH2Ph)−18. The optical absorption spectra of these two clusters are almost identical, which implies that they should share the same structure, but further proofs should be sought to confirm this. In our recent work,153 we employed 1D and 2D correlation NMR spectroscopy in conjunction with LDI-MS to probe the structure of Au25(SG)18. NMR reveals fine spectral features that explicitly indicate two types of surface binding modes of the –SG thiolates, which is consistent with the ligand distribution in the Au25(SCH2CH2Ph)−18 cluster. LDI-MS analysis shows that Au25(SG)18 exhibits an identical ionization and core fragmentation pattern with phenylethyl-thiolate capped Au25 clusters. These results confirm that glutathione capped Au25(SG)−18 clusters adopt the same structure as that of Au25(SCH2CH2Ph)−18. This conclusion is also valid for other types of thiolate-capped Au25 clusters, including hexyl- and dodecylthiolates. Interestingly, the chiral optical responses in the visible wavelength region were only observed from the Au25(SG)18 clusters, but no CD signals from Au25(SCH2CH2Ph)−18.
The chiroptical signals from Au25(SG)18 are apparently not caused by the chiral Au25 core since Au25(SG)18 and Au25(SCH2CH2Ph)18 are demonstrated to possess the same structure. In addition, the NMR spectrum of Au25(SG)18 as well as of Au25(SCH2CH2Ph)18 (including the anionic and neutral clusters) does not show any Au25 core chirality-induced peak splitting (excluding the chiral C-6 induced NMR peak splitting in –SG).153 This serves as a solid proof that the atomic arrangement in the Au25 core is non-chiral. Therefore, the first proposed mechanism of chirality86 coming from the Au25 core can be ruled out. The second mechanism (i.e., chirality coming from the thiolates) can also be ruled out since free glutathione shows a CD signal in the UV (at ∼230 nm) and should not shift to the visible wavelength region, albeit slight redshift is possible. In addition, no chiral adsorption pattern of thiolates was found in the case of Au25(SCH2CH2Ph)18.25,153 Taken together, all the data confirms that the chiroptical responses from the Au25(SG)18 cluster are due to the chiral field of the –SG ligands. Similar effects were also observed in other clusters capped by phosphine or thiolate. Nevertheless, a concrete conclusion remains to be made after the crystal structure of Au25(SG)18 clusters is solved in the future.
Theoretical calculations154,155 will permit a deeper understanding of the intriguing chiroptical properties of gold thiolate clusters. By comparing the simulated CD spectrum with experiment, one may gain insight into the origin of the chiroptical response from the clusters. Recently, Cautier and Burgi156 had a detailed discussion on the chirality of the metal-based electronic transitions observed in gold thiolate clusters and possible applications of these new chiral nanomaterials.
4.5 Magnetic properties of Aun(SR)m clusters
Magnetism is a long-lasting interesting topic in the contemporary physics of metals. According to the quantum theory, magnetism is essentially a spin property of electrons. For gold, single atoms (e.g. in gas beams or adsorbed on a support) possess unpaired 6s1 electrons and hence are paramagnetic; while bulk gold is diamagnetic (susceptibility χ = −2.8 × 10⁻⁵ cm3 mol−1) because the paramagnetism of the itinerant (or conduction) electrons is counteracted by the orbital and ionic core diamagnetism.157 The evolution of magnetism from paramagnetic gold atoms to nanoparticles to bulk is of fundamental interest and importance. For gas-phase gold clusters, theoretical work by Wang et al. has identified ultra-high magnetic moments in the gold-coated transition-metal anionic cluster [Mn13@Au20]−.158 In the case of thiolate-capped gold clusters, Negishi et al. reported an observation of paramagnetism in Aun(SG)m clusters but the fundamental origin of magnetism was not understood due to the unavailable crystal structures of the Aun(SG)m clusters.159In recent work, we observed paramagnetism in charge neutral [Au25(SR)18]0 clusters.160 We demonstrated that the magnetism in the cluster can be reversibly switched on or off by controlling the charge state of the [Au25(SR)18]q cluster, that is, the anionic cluster is non-magnetic while the neutral one is magnetic (Fig. 12A and B). With the crystal structure of [Au25(SR)18]0, we have achieved a correlation of crystal structure and magnetic properties. DFT calculations based on the crystal structure of [Au25(SR)18]0 successfully explained the origin of the magnetism. It is found that the unpaired spin in the [Au25(SR)18]0 cluster arises from the highest occupied Kohn–Sham orbital (one of the triply degenerate HOMO). Interestingly, the HOMO orbital exhibits distinct P-like character, Fig. 12C–D (different views of the P-like orbital), hence, supporting the superatom model for metal clusters136,161,162 The results of the [Au25(SR)18]0 nanoclusters demonstrate that the Au25(SR)18 cluster can be viewed as a thiolate-protected superatom.
![(A) Reversible conversion between the neutral and anionic Au25(SR)18 nanoclusters. (B) DFT calculated Kohn–Sham orbital level diagram for the neutral and anionic nanoclusters, respectively. (C–D) Views of the highest occupied Kohn–Sham orbital for [Au25(SH)18]0 at the LB94//Xα/TZP level of theory. The HOMO possesses two lobes and exhibits distinct P-like character. (D) is rotated relative to (C) to show one of the lobes (contributed by three Au atoms in the icosahedral shell). Purple: Au, yellow: S, white: H atoms. Reproduced from ref. 160 with permission. Copyright 2009 American Chemical Society.](/image/article/2010/NR/b9nr00160c/b9nr00160c-f12.gif) | ||
| Fig. 12 (A) Reversible conversion between the neutral and anionic Au25(SR)18 nanoclusters. (B) DFT calculated Kohn–Sham orbital level diagram for the neutral and anionic nanoclusters, respectively. (C–D) Views of the highest occupied Kohn–Sham orbital for [Au25(SH)18]0 at the LB94//Xα/TZP level of theory. The HOMO possesses two lobes and exhibits distinct P-like character. (D) is rotated relative to (C) to show one of the lobes (contributed by three Au atoms in the icosahedral shell). Purple: Au, yellow: S, white: H atoms. Reproduced from ref. 160 with permission. Copyright 2009 American Chemical Society. | ||
5. Outlook
Metal nanoclusters form an interesting intermediate state between discrete atoms and bulk metals, and the research on metal nanoclusters indeed bridges multiple disciplines, including chemistry, physics, and materials. For gold thiolate clusters, despite the past extensive work, several major issues are still to be worked out and a number of fundamental questions remain to be answered in future work.5.1 Size controlled synthesis of Aun(SR)m clusters
From the above discussions, one sees the critical importance of obtaining pure clusters and of precisely controlling the number of gold atoms in the cluster. Size-mixed clusters tend to smear out the optical properties and complicate all characterization and studies of the cluster properties. In spite of the recent major advances in gold thiolate cluster synthesis, it still remains a major task for chemists to develop or improve the synthetic chemistry for synthesizing a series of size-discrete Aun(SR)m clusters in high purity and high yield. The purity of the clusters is certainly the most critical factor in future synthetic work, as many characterizations (e.g.elemental analysis, thermogravimetric analysis) assume pure clusters; If the clusters are not pure, these characterization would lead to erroneous composition or formula of the clusters. In determining the exact formula of clusters, ESI-MS is an indispensable tool and will play an important role. It is still quite challenging to perform ESI-MS analysis on high-mass clusters.5.2 Structural determination of Aun(SR)m clusters
With regard to the size evolution behavior of gold clusters, an interesting question is: at what size will the cluster structure transit to an fcc crystalline structure. From the reported Au25 and Au102 structures, it seems that the icosahedral motif should phase out with increasing cluster size and close-packed layer structures should start to emerge with fewer than 100 atoms in the cluster. However, it is interesting to notice that phosphine-capped palladium clusters as large as Pd145 still adopt an icosahedral structure.375.3 The origin of surface plasmon in Au nanoparticles
With increasing cluster size, the valence electron energy levels will evolve into a quansicontinuous band. At what size does the plasmon excitation occur? How many valence electrons are indeed needed in order to support plasmons? And what does the nascent surface plasmon resonance look like? These fundamental questions remain to be answered. The electronic structure of Aun(SR)m clusters seems highly dependent on the geometrical structure. Would the transition from the molecular orbital picture (e.g. for Au25 clusters) to the free-electron picture occur smoothly (as discussed in section 2) or abruptly? Does this transition accompany the structural transition from non-fcc to fcc structure? To answer these questions, it is of critical importance to prepare a series of size discrete Aun(SR)m clusters spanning from a few dozen to a few hundred atoms and to determine their crystal structures. This is expected to be achieved in future research.5.4 What determines the stability of Aun(SR)m clusters?
This remains a particularly interesting topic in gold thiolate cluster research, and our current understanding is still limited. Generally speaking, there are two factors that should contribute to the stability of clusters, that is, geometric shell closing and electronic shell closing.For electronic shell closing, experimental support come from early work on gas-phase metal clusters (e.g. Nan, Aun), which revealed pronounced discontinuities in cluster abundance as a function of cluster size (n). For geometric shell closing, Au13 is a particular example since 12 gold atoms form a geometrically closed shell (i.e. an icosahedron), hence, rendering the structure particularly stable. However, the two-shell case (i.e. Au55) reported by Schmid (phosphine-capped Au55)15 and Tsukuda (thiolate=capped Au55)120 has not been confirmed by X-ray crystallography, nor by ESI-MS.
Herein we provide a further comment on the electronic and geometric shell closing of [Au25(SC6)18]q. Tsukuda et al.144 discussed this case in detail and concluded that electronic shell closing is not a crucial factor for the stability of [Au25(SC6)18]q (q = 1−, 0, 1+) since all of these charge states can be readily converted via redox reaction. Thus, the stability of [Au25(SC6)18]q is attributed to the geometric structure. This conclusion was made before the crystal structures of [Au25(SR)18]q (q = −1, 0) were revealed. With the crystal structures, one sees that the Au25(SR)18 structures are indeed open structures (i.e., the second shell is incomplete; eight of the twenty triangular faces of the Au13 icosahedron are left uncapped). On the other hand, from the view point of the electronic shell, the number of valence electrons for the Au25(SR)−18 cluster (that is, 25–18 + 1 = 8e) seems consistent with the superatom model and seems to explain the native state and high stability of Au25(SR)−18. However, we found that the charge-neutral [Au25(SR)18]0 cluster (7 e) is indeed more stable than the 8 e anions.26 Overall, the contributing factors for the stability of Aun(SR)m need further investigations in future work.
5.5 Photoluminescence of gold clusters
The fluorescence of gold clusters is an intriguing issue163–168 but not quite clear yet with respect to the origin of the fluorescence, in particular in the case of Au8 clusters.166,167 Zhou et al. reported a conversion of Au nanoparticles and nanorods into fluorescent sub-nanometre gold clusters through a biomolecule-assisted etching process.169 Xie et al.170 recently reported the observation of red fluorescence from bovine serum albumin (BSA)-coated gold clusters and the analytical data suggests the cluster could possibly be Au25. Shibu et al.98 observed fluorescence at ∼700 nm from Au25(SG)18 when excited at 514 nm. They also performed a study on the temperature-dependent solid-state emission of the Au25(SG)18 clusters. The same 700-nm emission band was found to slightly increase in intensity with increasing temperature from 80 to 160 K, but pronounced enhancement was observed after 160 K. Link et al.171 reported that the photoluminescence of Au25(SG)18 (corrected formula) can be separated into two bands with maxima around 1.5 and 1.15 eV, and that the total quantum yield at ambient temperature was about (3.5 ± 1.0) × 10−3. Bigioni and Whetten172 also observed near-infrared emission (1100–1600 nm) from various clusters (1.1–1.7 nm) using a 1064 nm excitation source. This photoluminescence was tentatively attributed to sp to sp transitions (i.e. intraband transitions). Wang et al.173 compared the luminescence of clusters ranging from Au11 to Au∼200 and found similar near-IR (700–1400 nm) spectra irrespective of the core size. The polar thiolate ligands were found to increase the fluorescence.173Overall, the reported quantum yields of photoluminescence for 1–2 nm gold clusters are quite low (typically 10−5 to 10−3), albeit it is more than 5 orders of magnitude greater than that of bulk gold (∼10−10). It would be important to develop some strategies to substantially enhance their quantum yield in order to make them appealing for practical applications in biological imaging. With respect to the fundamental aspects, several questions still remain, i) where does the fluorescence originate, from the surface gold atoms or from the inner gold kernel? ii) What is the relationship of fluorescence to energy quantization in Aun? iii) What factors influence the quantum yield? Understanding these aspects still need great efforts but is certainly well worthy of such efforts in order to put the cluster material into real-world use.
5.6 Ferromagnetism in Aun(SR)m clusters
The evolution of magnetism from paramagnetic gold atoms to nanocrystals to bulk is of fundamental interest and importance. For magnetism in small gold particles, previous work has reported observations of ferromagnetism in small gold nanoparticles,174,175 and X-ray magnetic circular dichroism (XMCD) seems to confirm the observed ferromagnetism arises from gold.176 A distinct size-dependent magnetization was found for small Au nanoparticles (∼1 to 5 nm diameter),174 albeit contradictory results exist in literature. The size distribution of the nanoparticles used in those reports and ill-defined surface properties complicate the data interpretation, and the fundamental origin of ferromagnetism still remains vague. For future work, well-defined nanoparticle systems should be created and a precise structure-property correlation study should be pursued to eventually reveal the origin of ferromagnetism in gold nanoparticles.5.7 Catalytic properties of Aun(SR)m clusters
Since Haruta's early work,177 catalysis by gold has become a very active topic in recent years.178–180 One of the major goals is to understand the origin of the catalytic performance of gold. An interesting observation was made by Goodman and coworkers, who found the onset of catalytic activity of (bare) gold clusters on titania is accompanied by the appearance of nonmetallic properties.180 Lopez et al. discussed several factors responsible for the origin of the catalytic activity of gold nanoparticles for low-temperature CO oxidation.181 Yoon et al. reported the charging effects on bonding and catalyzed oxidation of CO on Au8 clusters on MgO.182 Recently, Herzing et al. identified active gold nanoclusters on iron oxide supports for CO oxidation.183 Turner et al. also demonstrated the high catalytic activity of gold catalysts derived from Au55.184Tsunoyama et al. demonstrated that ligand-capped gold clusters are quite active in aerobic oxidation process.185,186 For example, they recently observed that ∼1.5 nm gold clusters stabilized by PVP showed higher activity for aerobic oxidation of alcohol than that of larger size clusters or clusters stabilized by poly(allylamine) (PAA). The enhanced catalytic activity is attributed to the negatively charged Au clusters with electron donated by PVP, similar to the observations of small bare Aun− cluster anions in the gas phase used for catalysis. In another study, Rodriguez-Vazquez et al. prepared TOAB-stabilized small Au clusters in the range Au3–11 (detected by MALDI-TOF) and found that these clusters show extraordinarily high electrocatalytic activity toward the O2 reduction reaction in acid solutions.187
In all of these studies, however, a precise structure–property correlation has not been achieved because the clusters used are not truly monodisperse and/or the crystal structure is not available. Catalysis by well-defined, atomically precise Aun(SR)m clusters remains to explored in future work. This special system of Aun(SR)m clusters may offer an opportunity to achieve a deeper understanding of the fundamental origin of gold catalysis, in particular, regarding how the electronic properties of Aun(SR)m clusters affect the cluster's catalytic properties. Future work on correlating crystal structure and catalytic properties is anticipated to ultimately unravel the mechanism of gold catalysis.
5.8 Thiolated silver nanoclusters
Toward the end of this review, it is worthy of a brief discussion on thiolated silver clusters. Despite the tremendous research on gold thiolate clusters, reports on silver thiolate clusters are surprisingly scarce. This is due primarily to the oxidation problem of silver nanoclusters, which is also a concern in making larger crystalline Ag nanoparticles (e.g. ∼10 nm).188 Nevertheless, there have been several notable recent studies. Very small Agn clusters (such as dimers, trimers, etc.) stabilized by DNA have received particular attention due to their strong fluorescence.189–191Thiolate Agn clusters (n> 10 atoms) have been reported with a focus on their chiroptical (e.g. circular dichroism, CD) properties.192 Cathcart et al.193 reported an interesting cyclic reduction in oxidative condition (CTOC) method to prepare silver nanoclusters and a well-defined optical spectrum was obtained for the as-prepared silver cluster. An interesting silver thiolate species with eight absorption bands was identified by Bakr et al.194 In another study, a 7 kDa silver cluster species was reported.195 In these reports the exact formulae of the nanoclusters were not obtained in MS analyses. Very recently, Wu et al.196 reported the synthesis of thiolated Ag7(DMSA)4 clusters (where, DMSA = meso-2,3-dimercaptosuccinic acid). This is the first report that achieved a precise ESI-MS determination of the composition of silver thiolate clusters. Overall, the synthesis, isolation, and precise composition determination still remain a huge challenge in silver nanocluster research.The above list is certainly not intended to be complete. Other issues such as the origin of chirality in Aun(SR)m, the ultra-fast electron dynamics, electrochemical and charge transport properties also deserve further systematic investigations in future work when more Aun(SR)m clusters with molecular purity become available. In addition to thiolate-protected Au and Ag nanoclusters, iron-carbonyl protected gold clusters have also been reported.197,198
6. Conclusion
In summary, metal nanoclusters (Mn(SR)m, M = Au, Ag, etc.) constitute a very important intermediate size regime between localized atomic states and delocalized band structure (Scheme 2), and merit systematic in-depth studies. The recent major advances in the synthesis and characterization of gold thiolate clusters has opened an avenue to making truly monodisperse Aun(SR)m clusters and attaining the precise control of these ultra-small nanoparticles at the ultimate atomic level. Structural determination of Aun(SR)m clusters will significantly promote our understanding of the underlying physics and the important structure-property relationships. The correlation of electronic properties of the nanoclusters with their atomic packing structure determined by X-ray crystallography will significantly expand our understanding of the evolution of the electronic properties as they evolve from the atomic state to nanoclusters to fcc-structured nanocrystals. The evolution behavior across length scales is of major importance and will lead to fundamental insights into structure-property correlation and new principles for design of novel functional metal nanomaterials for energy conversion, chemo- and biosensing, and many others. One can anticipate that major advances and exciting research into the fundamental science of this interesting type of nanomaterial will take place in the next few years and will stimulate long-lasting scientific and technological interests.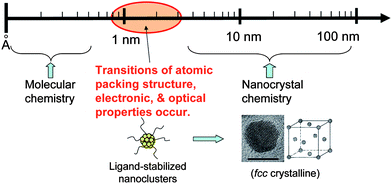 | ||
| Scheme 2 Metal nanoclusters, bridge organometallic complexes and nanocrystals. Scale bar = 5 nm. | ||
Acknowledgements
I owe great gratitude to Prof. Richard McCullough, Dr Frederick J. Hollander, Prof. Christine Aikens, Prof. George Schatz, Prof. Nathaniel Rosi, Prof. Tomislav Pintauer, William Eckenhoff, Prof. Mark Bier, Eric Lanni, Prof. Roberto Gil, Dr Gayathri Withers, Dr Ulla N. Andersen, and Dr Zhongrui Zhou, who collaborated with my group or provided great assistance in our research. I am also grateful to my group members, including Dr Manzhou Zhu, Huifeng Qian, Dr Zhikun Wu, Dr Yan Zhu, and Dr Ashok Mahanty, who significantly contributed to the cluster research. Also, our research is largely built upon my colleagues' prior/current work on clusters, from their work I have learned a lot and all of their work has greatly benefited and stimulated my group's research on gold thiolate clusters. Our research is financially supported by CMU, AFOSR and NIOSH.Reference
- M. Faraday, Philos. Trans. R. Soc. London, 1857, 147, 145–181 CrossRef.
- R. Zsigmondy, Colloids and the Ultramicroscope: A Manual of Colloid Chemistry and Ultramicroscopy, WileyNew York, 1909 Search PubMed.
- G. Mie, Ann. Phys., 1908, 330, 377 CrossRef.
- J. Turkevich, P. C. Stevenson and J. Hiller, Discuss. Faraday Soc., 1951, 11, 55 RSC.
- G. Frens, Nature: Phys. Sci., 1973, 241, 20–22.
- J. Turkevich, Gold Bull., 1985, 18, 86 CAS.
- M. Kerker, The Scattering of Light and Other Electromagnetic Radiation, Academic, New York, 1969 Search PubMed.
- U. Kreibig and M. Vollmer, Optical Properties of Metal Clusters, Springer-Verlag: New York, 1995 Search PubMed.
- M. C. Daniel and D. Astruc, Chem. Rev., 2004, 104, 293–346 CrossRef CAS.
- C. Burda, X. Chen, R. Narayanan and M. A. El-Sayed, Chem. Rev., 2005, 105, 1025–1102 CrossRef CAS.
- C. J. Murphy, A. M. Gole, S. E. Hunyadi and C. J. Orendorff, Inorg. Chem., 2006, 45, 7544–7554 CrossRef CAS.
- Y. Xia, P. D. Yang, Y. G. Sun, Y. Y. Wu, B. Mayers, B. Gates, Y. D. Yin, F. Kim and Y. Q. Yan, Adv. Mater., 2003, 15, 353–389 CrossRef CAS.
- P. Bellon, M. Sansoni and M. Manasser, J. Chem. Soc., Dalton Trans., 1972, 1481 RSC.
- P. A. Bartlett, B. Bauer and S. J. Singer, J. Am. Chem. Soc., 1978, 100, 5085–5089 CrossRef CAS.
- G. Schmid, R. Pfeil, R. Boese, F. Bandermann, S. Meyer, G. H. M. Calis and J. A. W. van der Velden, Chem. Ber., 1981, 114, 3634–3642 CrossRef CAS.
- B. K. Teo and H. Zhang, J. Cluster Sci., 1990, 1, 155–187 CrossRef.
- J. W. A. van der Velden, J. J. Bour, W. P. Bosman and J. H. Hoordik, J. Chem. Soc., Chem. Commun., 1981, 1218 RSC.
- J. W. A. van der Velden, F. A. Vollenbroek, J. J. Bour, P. I. Beurskens, J. M. M. Smits and W. P. Bosman, Recl.: J.R. Neth. Chem. Soc., 1981, 100, 148–152 Search PubMed.
- K. P. Hall, B. R. C. Theobald, D. I. Gilmour, D. M. P. Mingos and A. J. Welch, J. Chem. Soc., Chem. Commun., 1982, 528 RSC.
- D. Safer, J. Hainfeld, J. S. Wall and J. E. Reardon, Science, 1982, 218, 290–291 CrossRef CAS.
- C. E. Briant, B. R. C. Theobald, J. W. White, L. K. Bell, D. M. P. Mingos and A. J. Welch, J. Chem. Soc., Chem. Commun., 1981, 201 RSC.
- B. K. Teo, X. B. Shi and H. Zhang, J. Am. Chem. Soc., 1992, 114, 2743–2745 CrossRef CAS.
- P. D. Jadzinsky, G. Calero, C. J. Ackerson, D. A. Bushnell and R. D. Kornberg, Science, 2007, 318, 430–433 CrossRef CAS.
- M. W. Heaven, A. Dass, P. S. White, K. M. Holt and R. W. Murray, J. Am. Chem. Soc., 2008, 130, 3754 CrossRef CAS.
- M. Zhu, C. M. Aikens, F. J. Hollander, G. C. Schatz and R. Jin, J. Am. Chem. Soc., 2008, 130, 5883–5885 CrossRef CAS.
- M. Zhu, W. T. Eckenhoff, T. Pintauer and R. Jin, J. Phys. Chem. C, 2008, 112, 14221–14224 CrossRef CAS.
- R. Kubo, A. Kawayashi and S.-I. Kobayashi, Annu. Rev. Mater. Sci., 1984, 14, 49–66 CrossRef CAS.
- M. G. Ramchandani, J. Phys. C: Solid State Physics, 170, 1, S1 Search PubMed.
- K. J. Taylor, C. L. Pettiette-Hall, O. Cheshnovsky and R. E. Smalley, J. Chem. Phys., 1992, 96, 3319–3329 CrossRef CAS.
- K. Nunokawa, S. Onaka, M. Ito, M. Horibe, T. Yonezawa, H. Nishihara, T. Ozeki, H. Chiba, S. Watase and M. Nakamoto, J. Organomet. Chem., 2006, 691, 638–642 CrossRef CAS.
- G. Schmid, Struct. Bonding, 1985, 62, 51–58 CAS; G. Schmid, Chem. Soc. Rev., 2008, 37, 1909–1930 RSC.
- B. K. Teo, H. Zhang, Y. Kean, H. Dang and X. Shi, J. Chem. Phys., 1993, 99, 2929–2941 CrossRef CAS.
- B. K. Teo, X. Shi and H. Zhang, J. Am. Chem. Soc., 1991, 113, 4329–4331 CrossRef CAS.
- B. K. Teo, M. C. Hong, H. Zhang and D. B. Huang, Angew. Chem., Int. Ed. Engl., 1987, 26, 897–900 CrossRef.
- B. K. Teo, X. Shi and H. Zhang, Inorg. Chem., 1993, 32, 3987–3988 CrossRef CAS.
- D. M. Washecheck, E. J. Wucherer, L. F. Dahl, A. Ceriotti, G. Longoni, M. Manassero, M. Sansoni and P. Chini, J. Am. Chem. Soc., 1979, 101, 6110 CrossRef CAS.
- N. T. Tran, D. R. Powell and L. F. Dahl, Angew. Chem., Int. Ed., 2000, 39, 4121–4125 CrossRef CAS.
- N. T. Tran and L. F. Dahl, Angew. Chem., Int. Ed., 2003, 42, 3533–3537 CrossRef CAS.
- E. G. Mednikov, S. A. Ivanov and L. F. Dahl, Angew. Chem., Int. Ed., 2003, 42, 323–327 CrossRef CAS.
- E. G. Mednikov, S. A. Ivanov, I. V. Slovokhotova and L. F. Dahl, Angew. Chem., Int. Ed., 2005, 44, 6848–6854 CrossRef CAS.
- L. S. Ott and R. G. Finke, Inorg. Chem., 2006, 45, 8382–8393 CrossRef.
- D. Fenske, J. Ohmer, J. Hachgenei and K. Merzweiler, Angew. Chem., Int. Ed. Engl., 1988, 27, 1277 CrossRef.
- S. Paloma, F. Olaf, H. Oliver, L. Sergej, N. Christian, A. Reinhart, F. Dieter and M. K. Manfred, Eur. J. Inorg. Chem., 2007,(Issue 33), 5163–5167 CrossRef CAS.
- G. Schmid, Chem. Rev., 1992, 92, 1709–1727 CrossRef CAS.
- C. D. Bain and G. M. Whitesides, Angew. Chem., Int. Ed. Engl., 1989, 28, 506–512 CrossRef.
- L. H. Dubois and R. G. Nuzzo, Annu. Rev. Phys. Chem., 1992, 43, 437–463 CrossRef CAS.
- A. Ulman, An Introduction to Ultrathin Organic Films, Academic, New York, 1991 Search PubMed.
- M. Brust, M. Walker, D. Bethell, D. J. Schiffrin and R. Whyman, J. Chem. Soc., Chem. Commun., 1994, 801–802 RSC.
- M. Brust, J. Fink, D. Bethell, D. J. Schiffrin and C. Kiely, J. Chem. Soc., Chem. Commun., 1995, 1655–1656 RSC.
- M. Brust, D. Bethell, D. J. Schiffrin and C. J. Kiely, Adv. Mater., 1995, 7, 795–797 CAS.
- R. H. Terrill, T. A. Postlethwaite, C.-h. Chen, C.-D. Poon, A. Terzis, A. Chen, J. E. Hutchison, M. R. Clark and G. Wignall, J. Am. Chem. Soc., 1995, 117, 12537–12548 CrossRef CAS.
- M. J. Hostetler, S. J. Green, J. J. Stokes and R. W. Murray, J. Am. Chem. Soc., 1996, 118, 4212–4213 CrossRef CAS.
- M. M. Alvarez, J. T. Khoury, T. G. Schaaff, M. Shafigullin, I. Vezmar and R. L. Whetten, Chem. Phys. Lett., 1997, 266, 91–98 CrossRef CAS.
- M. J. Hostetler, J. E. Wingate, C.-J. Zhong, J. E. Harris, R. W. Vachet, M. R. Clark, J. D. Londono, S. J. Green, J. J. Stokes, G. D. Wignall, G. L. Glish, M. D. Porter, N. D. Evans and R. W. Murray, Langmuir, 1998, 14, 17–30 CrossRef CAS.
- S. Chen and R. W. Murray, Langmuir, 1999, 15, 682–689 CrossRef CAS.
- C. J. Ackerson, P. D. Jadzinsky and R. D. Kornberg, J. Am. Chem. Soc., 2005, 127, 6550–6551 CrossRef CAS.
- J. P. Wilcoxon and P. Provencio, J. Phys. Chem. B, 2003, 107, 12949–12957 CrossRef CAS.
- J. P. Wilcoxon, J. E. Martin and P. Provencio, Langmuir, 2000, 16, 9912–9920 CrossRef CAS.
- Y. Song, V. Jimenez, C. McKinney, R. Donkers and R. W. Murray, Anal. Chem., 2003, 75, 5088–5096 CrossRef CAS.
- V. L. Jimenez, M. C. Leopold, C. Mazzitelli, J. W. Jorgenson and R. W. Murray, Anal. Chem., 2003, 75, 199–206 CrossRef CAS.
- C. J. Zhong, W. X. Zhang, F. L. Leibowitz and H. H. Eichelberger, Chem. Commun., 1999, 1211–1212 RSC.
- X. M. Lin, G. M. Wang, C. M. Sorensen and K. J. Klabunde, J. Phys. Chem. B, 1999, 103, 5488–5492 CrossRef CAS.
- S. Stoeva, K. J. Klabunde, C. M. Sorensen and I. Dragieva, J. Am. Chem. Soc., 2002, 124, 2305–2311 CrossRef CAS.
- B. L. V. Prasad, S. I. Stoeva, C. M. Sorensen and K. J. Klabunde, Langmuir, 2002, 18, 7515–7520 CrossRef CAS.
- T. Shimizu, T. Teranishi, S. Hasegawa and M. Miyake, J. Phys. Chem. B, 2003, 107, 2719–2724 CrossRef CAS.
- I. Hussain, S. Graham, Z. X. Wang, B. Tan, D. C. Sherrington, S. P. Rannard, A. I. Cooper and M. Brust, J. Am. Chem. Soc., 2005, 127, 16398–16399 CrossRef CAS.
- Z. Wang, B. Tan, I. Hussain, N. Schaeffer, M. F. Wyatt, M. Brust and A. I. Cooper, Langmuir, 2007, 23, 885–895 CrossRef CAS.
- H. Yao, H. Kojima, S. Sato and K. Kimura, Langmuir, 2004, 20, 10317–10323 CrossRef CAS.
- H. Yao, T. Minami, A. Hori, M. Koma and K. Kimura, J. Phys. Chem. B, 2006, 110, 14040–14045 CrossRef CAS.
- H. Wu, H. Zhu, J. Zhuang, S. Yang, C. Liu and Y. C. Cao, Angew. Chem., Int. Ed., 2008, 47, 3730–3734 CrossRef CAS.
- R. Jin, Angew. Chem., Int. Ed., 2008, 47, 6750 CrossRef CAS.
- R. L. Whetten, J. T. Khoury, M. M. Alvarez, S. Murthy, I. Vezmar, Z. L. Wang, P. W. Stephen, C. L. Cleveland, W. D. Luedtke and U. Landman, Adv. Mater., 1996, 8, 428–433 CAS.
- M. M. Alvarez, J. T. Khoury, T. G. Schaaff, M. N. Shafigullin, I. Vezmar and R. L. Whetten, J. Phys. Chem. B, 1997, 101, 3706–3712 CrossRef CAS.
- R. L. Whetten, M. N. Shafigullin, J. T. Khoury, T. G. Schaaff, I. Vezmar, M. M. Alvarez and A. Wilkinson, Acc. Chem. Res., 1999, 32, 397–406 CrossRef CAS.
- C. L. Cleveland, U. Landman, T. G. Schaaff, M. N. Shafigullin, P. W. Stephens and R. L. Whetten, Phys. Rev. Lett., 1997, 79, 1873 CrossRef CAS.
- T. G. Schaaff, M. N. Shafigullin, J. T. Khoury, I. Vezmar, R. L. Whetten, W. G. Cullen, P. N. First, C. GutierrezWing, J. Ascensio and M. J. JoseYacaman, J. Phys. Chem. B, 1997, 101, 7885–7891 CrossRef.
- The 22 kDa species should be related to Au102(SR)44.
- S. W. Chen, R. S. Ingram, M. J. Hostetler, J. J. Pietron, R. W. Murray, T. G. Schaaff, J. T. Khoury, M. M. Alvarez and R. L. Whetten, Science, 1998, 280, 2098–2101 CrossRef CAS.
- J. F. Hicks, A. C. Templeton, S. Chen, K. M. Sheran, R. Jasti, R. W. Murray, J. Debord, T. G. Schaaff and R. L. Whetten, Anal. Chem., 1999, 71, 3703–3711 CrossRef CAS.
- T. G. Schaaff, M. N. Shafigullin, J. T. Khoury, I. Vezmar and R. L. Whetten, J. Phys. Chem. B, 2001, 105, 8785–8796 CrossRef CAS.
- R. S. Ingram, M. J. Hostetler, R. W. Murray, T. G. Schaaff, J. T. Khoury, R. L. Whetten, T. P. Bigioni, D. K. Guthrie and P. N. First, J. Am. Chem. Soc., 1997, 119, 9279–9280 CrossRef CAS.
- J. F. Hicks, D. T. Miles and R. W. Murray, J. Am. Chem. Soc., 2002, 124, 13322–13328 CrossRef CAS.
- B. M. Quinn, P. Liljeroth, V. Ruiz, T. Laaksonen and K. Kontturi, J. Am. Chem. Soc., 2003, 125, 6644–6645 CrossRef CAS.
- T. G. Schaaff and R. L. Whetten, J. Phys. Chem. B, 1999, 103, 9394–9396 CrossRef CAS.
- R. J. Arnold and J. P. Reilly, J. Am. Chem. Soc., 1998, 120, 1528–1532 CrossRef CAS.
- T. G. Schaaff, Anal. Chem., 2004, 76, 6187–6196 CrossRef CAS.
- T. G. Schaaff, G. Knight, M. N. Shafigullin, R. F. Borkman and R. L. Whetten, J. Phys. Chem. B, 1998, 102, 10643–10646 CrossRef CAS.
- T. G. Schaaff and R. L. Whetten, J. Phys. Chem. B, 2000, 104, 2630–2641 CrossRef CAS.
- R. L. Donkers, D. Lee and R. W. Murray, Langmuir, 2004, 20, 1945–1952 CrossRef CAS.
- V. L. Jimenez, D. G. Georganopoulou, R. J. White, A. S. Harper, A. J. Mills, D. Lee and R. W. Murray, Langmuir, 2004, 20, 6864–6870 CrossRef.
- D. Lee, R. L. Donkers, J. M. DeSimone and R. W. Murray, J. Am. Chem. Soc., 2003, 125, 1182–1183 CrossRef.
- D. Lee, R. L. Donkers, G. L. Wang, A. S. Harper and R. W. Murray, J. Am. Chem. Soc., 2004, 126, 6193–6199 CrossRef CAS.
- J. M. Abad, I. E. Sendroiu, M. Gass, A. Bleloch, A. J. Mills and D. J. Schiffrin, J. Am. Chem. Soc., 2007, 129, 12932–12933 CrossRef CAS.
- Y. Negishi, Y. Takasugi, S. Sato, H. Yao, K. Kimura and T. Tsukuda, J. Am. Chem. Soc., 2004, 126, 6518–6519 CrossRef CAS.
- Y. Negishi, K. Nobusada and T. Tsukuda, J. Am. Chem. Soc., 2005, 127, 5261–5270 CrossRef CAS.
- Y. Shichibu, Y. Negishi, H. Tsunoyama, M. Kanehara, T. Teranishi and T. Tsukuda, Small, 2007, 3, 835–839 CrossRef CAS.
- M. A. Habeeb Muhammed and T. Pradeep, Chem. Phys. Lett., 2007, 449, 186–190 CrossRef CAS.
- E. S. Shibu, M. A. H. Muhammed, T. Tsukuda and T. Pradeep, J. Phys. Chem. C, 2008, 112, 12168–12176 CrossRef CAS.
- M. Zhu, E. Lanni, N. Garg, M. E. Bier and R. Jin, J. Am. Chem. Soc., 2008, 130, 1138–1139 CrossRef CAS.
- Z. Wu, J. Suhan and R. Jin, J. Mater. Chem., 2009, 19, 622–626 RSC.
- M. Zhu, H. Qian and R. Jin, J. Am. Chem. Soc., 2009, 131, 7220–7221 CrossRef CAS.
- M. G. Warner, S. M. Reed and J. E. Hutchison, Chem. Mater., 2000, 12, 3316–3320 CrossRef CAS.
- G. H. Woehrle, M. G. Warner and J. E. Hutchison, J. Phys. Chem. B, 2002, 106, 9979–9981 CrossRef CAS.
- G. H. Woehrle and J. E. Hutchison, Inorg. Chem., 2005, 44, 6149–6158 CrossRef CAS.
- G. H. Woehrle, L. O. Brown and J. E. Hutchison, J. Am. Chem. Soc., 2005, 127, 2172–2183 CrossRef CAS.
- R. Balasubramanian, R. Guo, A. J. Mills and R. W. Murray, J. Am. Chem. Soc., 2005, 127, 8126–8132 CrossRef CAS.
- Y. Shichibu, Y. Negishi, T. Tsukuda and T. Teranishi, J. Am. Chem. Soc., 2005, 127, 13464–13465 CrossRef CAS.
- R. C. Price and R. L. Whetten, J. Am. Chem. Soc., 2005, 127, 13750–13751 CrossRef.
- H. Qian, M. Zhu, E. Lanni, Y. Zhu, M. E. Bier and R. Jin, J. Phys. Chem. C, 2009, 113, 17599 CrossRef CAS.
- H. Tsunoyama, P. Nickut, Y. Negishi, K. Al-Shamery, Y. Matsumoto and T. Tsukuda, J. Phys. Chem. C, 2007, 111, 4153–4158 CrossRef CAS.
- N. K. Chaki, Y. Negishi, H. Tsunoyama, Y. Shichibu and T. Tsukuda, J. Am. Chem. Soc., 2008, 130, 8608–8610 CrossRef CAS.
- O. Toikkanen, V. Ruiz, G. Ronholm, N. Kalkkinen, P. Liljeroth and B. M. Quinn, J. Am. Chem. Soc., 2008, 130, 11049–11055 CrossRef CAS.
- H. Qian, M. Zhu, U. N. Andersen and R. Jin, J. Phys. Chem. A, 2009, 113, 4281–4284 CrossRef CAS.
- H. Qian, Y. Zhu and R. Jin, ACS Nano, 2009, 3, 3795, DOI:10.1021/nn901137h.
- O. Lopez-Acevedo, J. Akola, R. L. Whetten, H. Grönbeck and H. Hakkinen, J. Phys. Chem. C, 2009, 113, 5035–5038 CrossRef CAS.
- H. Qian and R. Jin, Nano Lett., 2009 DOI:10.1021/nl902300y.
- T. Inomata and K. Konishi, Chem. Commun., 2003, 1282–1283 RSC.
- G. Schmid, R. Pugin, J. O. Malm and J. O. Bovin, Eur. J. Inorg. Chem., 1998, 813–817 CrossRef CAS.
- G. Schmid, R. Pugin, W. Meyer-Zaika and U. Simon, Eur. J. Inorg. Chem., 1999, 2051–2055 CrossRef CAS.
- H. Tsunoyama, Y. Negishi and T. Tsukuda, J. Am. Chem. Soc., 2006, 128, 6036–6037 CrossRef CAS.
- Y. Negishi, Y. Takasugi, S. Sato, H. Yao, K. Kimura and T. Tsukuda, J. Phys. Chem. B, 2006, 110, 12218–12221 CrossRef CAS.
- Y. Zhang, S. Shuang, C. Dong, C. K. Lo, M. C. Paau and M. M. F. Choi, Anal. Chem., 2009, 81, 1676–1685 CrossRef CAS.
- H. Yao, T. Fukui and K. Kimura, J. Phys. Chem. C, 2007, 111, 14968–14976 CrossRef CAS.
- K. Kimura, N. Sugimoto, S. Sato, H. Yao, Y. Negishi and T. Tsukuda, J. Phys. Chem. C, 2009, 113, 14076–14082 CrossRef CAS.
- J. B. Tracy, M. C. Crowe, J. F. Parker, O. Hampe, C. A. Fields-Zinna, A. Dass and R. W. Murray, J. Am. Chem. Soc., 2007, 129, 16209–16215 CrossRef CAS.
- A. Dass, A. Stevenson, G. R. Dubay, J. B. Tracy and R. W. Murray, J. Am. Chem. Soc., 2008, 130, 5940–5946 CrossRef CAS.
- A. Dass, K. Holt, J. F. Parker, S. W. Feldberg and R. W. Murray, J. Phys. Chem. C, 2008, 112, 20276–20283 CrossRef CAS.
- R. W. Murray, Chem. Rev., 2008, 108, 2688–2720 CrossRef CAS.
- T. Laaksonen, V. Ruiz, P. Lijeroth and B. M. Quinn, Chem. Soc. Rev., 2008, 37, 1836–1846 RSC.
- R. L. Whetten and R. C. Price, Science, 2007, 318, 407–408 CrossRef CAS.
- H. S. Kato, J. Noh, M. Hara and M. Kawai, J. Phys. Chem. B, 2002, 106, 9655–9658 CrossRef CAS.
- J. Petroski, M. Chou and C. Creutz, J. Organomet. Chem., 2009, 694, 1138–1143 CrossRef CAS.
- E. G. Mednikov and L. F. Dahl, Small, 2008, 4, 534–537 CrossRef CAS.
- J. Akola, M. Walter, R. L. Whetten, H. Hakkinen and H. Grönbeck, J. Am. Chem. Soc., 2008, 130, 3756 CrossRef CAS.
- N. Shao, Y. Pei, Y. Gao and X. C. Zeng, J. Phys. Chem. A, 2009, 113, 629–632 CrossRef CAS.
- M. Walter, J. Akola, O. Lopez-Acevedo, P. D. Jadzinsky, G. Calero, C. J. Ackerson, R. L. Whetten, H. Grönbeck and H. Hakkinen, Proc. Natl. Acad. Sci. U. S. A., 2008, 105, 9157–9162.
- H. Häkkinen, M. Walter and H. Grönbeck, J. Phys. Chem. B, 2006, 110, 9927 CrossRef.
- Y. Gao, N. Shao and X. C. Zeng, ACS Nano, 2008, 2, 1497–1503 CrossRef CAS.
- Y. Li, G. Galli and F. Gygi, ACS Nano, 2008, 2, 1896–1902 CrossRef CAS.
- Y. Shichibu, Y. Negishi, T. Watanabe, N. K. Chaki, H. Kawaguchi and T. Tsukuda, J. Phys. Chem. C, 2007, 111, 7845–7847 CrossRef CAS.
- T. Iwasa and K. Nobusada, J. Phys. Chem. C, 2007, 111, 45–49 CrossRef CAS.
- T. Iwasa and K. Nobusada, Chem. Phys. Lett., 2007, 441, 268–272 CrossRef CAS.
- C. M. Aikens, J. Phys. Chem. C, 2008, 112, 19797–19800 CrossRef CAS.
- Y. Negishi, N. K. Chaki, Y. Shichibu, R. L. Whetten and T. Tsukuda, J. Am. Chem. Soc., 2007, 129, 11322 CrossRef CAS.
- G. Ramakrishna, O. Varnavski, J. Kim, D. Lee and T. Goodson, J. Am. Chem. Soc., 2008, 130, 5032–5033 CrossRef CAS.
- S. A. Miller, J. M. Womick, J. F. Parker, R. W. Murray and A. M. Moran, J. Phys. Chem. C, 2009, 113, 9440–9444 CrossRef CAS.
- D.-E. Jiang and S. Dai, Inorg. Chem., 2009, 48, 2720–2722 CrossRef CAS.
- C. Gautier, R. Taras, S. Gladiali and T. Bürgi, Chirality, 2008, 20, 486–493 CrossRef CAS.
- H. Yao, K. Miki, N. Nishida, A. Sasaki and K. Kimura, J. Am. Chem. Soc., 2005, 127, 15536–15543 CrossRef CAS.
- H. Yao, T. Fukui and K. Kimura, J. Phys. Chem. C, 2008, 112, 16281–16285 CrossRef CAS.
- C. Gautier and T. Burgi, J. Am. Chem. Soc., 2006, 128, 11079–11087 CrossRef CAS.
- Y. Yanagimoto, Y. Negishi, H. Fujihara and T. Tsukuda, J. Phys. Chem. B, 2006, 110, 11611–11614 CrossRef CAS.
- Z. Wu, C. Gayathri, R. R. Gil and R. Jin, J. Am. Chem. Soc., 2009, 131, 6535–6542 CrossRef CAS.
- I. L. Garzón, J. A. Reyes-Nava, J. I. Rodríguez-Hernández, I. Sigal, M. R. Beltrán and K. Michaelian1, Phys. Rev. B: Condens. Matter Mater. Phys., 2002, 66, 073403–073407 CrossRef.
- C. E. Román-Velázquez, C. Noguez and I. L. Garzón, J. Phys. Chem. B, 2003, 107, 12035 CrossRef CAS.
- C. Gautier and T. Burgi, ChemPhysChem, 2009, 10, 483–492 CrossRef CAS.
- R. M. White, Quantum Theory of Magnetism, Springer, New York, 2007 Search PubMed.
- J. Wang, J. Bai, J. Jellinek and X. C. Zeng, J. Am. Chem. Soc., 2007, 129, 4110–4111 CrossRef CAS.
- Y. Negishi, H. Tsunoyama, M. Suzuki, N. Kawamura, M. M. Matsushita, K. Maruyama, T. Sugawara, T. Yokoyama and T. Tsukuda, J. Am. Chem. Soc., 2006, 128, 12034–12035 CrossRef CAS.
- M. Zhu, C. M. Aikens, M. P. Hendrich, R. Gupta, H. Qian, G. C. Schatz and R. Jin, J. Am. Chem. Soc., 2009, 131, 2490–2492 CrossRef CAS.
- W. D. Knight, K. Clemenger, W. A. de Heer, W. A. Saunders, M. Y. Chou and M. L. Cohen, Phys. Rev. Lett., 1984, 52, 2141 CrossRef CAS.
- W. Luo, S. J. Pennycook and S. T. Pantelides, Nano Lett., 2007, 7, 3134–3137 CrossRef.
- J. Zheng, P. R. Nicovich and R. M. Dickson, Annu. Rev. Phys. Chem., 2007, 58, 409–431 CrossRef CAS.
- J. Zheng, C. W. Zhang and R. M. Dickson, Phys. Rev. Lett., 2004, 93, 077402 CrossRef.
- C. A. Lin, T. Y. Yang, C. H. Lee, S. H. Huang, R. A. Sperling, M. Zanella, J. K. Li, J. L. Shen, H. H. Wang, H. I. Yeh, W. J. Parak and W. H. Chang, ACS Nano, 2009, 3, 395–401 CrossRef CAS.
- J. Zheng, J. T. Petty and R. M. Dickson, J. Am. Chem. Soc., 2003, 125, 7780–7781 CrossRef CAS.
- W. I. Lee, Y. Bae and A. J. Bard, J. Am. Chem. Soc., 2004, 126, 8358–8359 CrossRef CAS.
- H. W. Duan and S. M. Nie, J. Am. Chem. Soc., 2007, 129, 2412–2413 CrossRef.
- R. J. Zhou, M. M. Shi, X. Q. Chen, M. Wang and H. Z. Chen, Chem.–Eur. J., 2009, 15, 4944–4951 CrossRef CAS.
- J. Xie, Y. Zheng and J. Y. Ying, J. Am. Chem. Soc., 2009, 131, 888–889 CrossRef CAS.
- S. Link, A. Beeby, S. FitzGerald, M. A. El-Sayed, T. G. Schaaff and R. L. Whetten, J. Phys. Chem. B, 2002, 106, 3410–3415 CrossRef CAS.
- T. P. Bigioni, R. L. Whetten and Ö. Dag, J. Phys. Chem. B, 2000, 104, 6983–6986 CrossRef CAS.
- G. Wang, T. Huang, R. W. Murray, L. Menard and R. G. Nuzzo, J. Am. Chem. Soc., 2005, 127, 812–813 CrossRef CAS.
- H. Hori, Y. Yamamoto, T. Iwamoto, T. Miura, T. Teranishi and M. Miyake, Phys. Rev. B: Condens. Matter Mater. Phys., 2004, 69, 174411 CrossRef.
- P. Crespo, R. Litrán, T. C. Rojas, M. Multigner, J. M. de la Fuente, J. C. Sánchez-Lopez, M. A. García, A. Hernando, S. Penadés and A. Fernández, Phys. Rev. Lett., 2004, 93, 087204 CrossRef CAS.
- H. Hori, T. Teranishi, Y. Nakae, Y. Seino, M. Miyake and S. Yamada, Phys. Lett. A, 1999, 263, 406–410 CrossRef CAS.
- M. Haruta, T. Kobayashi, H. Sano and N. Yamada, Chem. Lett., 1987, 405–408 CAS.
- M. Haruta, Chem. Rec., 2003, 3, 75–87 CrossRef.
- A. S. K. Hashmi and J. H. Graham, Angew. Chem., Int. Ed., 2006, 45, 7896–7936 CrossRef.
- M. Valden, X. Lai and D. W. Goodman, Science, 1998, 281, 1647–1650 CrossRef CAS.
- N. Lopez, T. V. W. Janssens, B. S. Clausen, Y. Xu, M. Mavrikakis, T. Bligaard and J. K. Norskov, J. Catal., 2004, 223, 232–235 CrossRef CAS.
- B. Yoon, H. Hakkinen, U. Landman, A. S. Worz, J. M. Antonietti, S. Abbet, K. Judai and U. Heiz, Science, 2005, 307, 403–407 CrossRef CAS.
- A. A. Herzing, C. J. Kiely, A. F. Carley, P. Landon and G. J. Hutchings, Science, 2008, 321, 1331–1335 CrossRef CAS.
- M. Turner, V. B. Golovko, O. P. H. Vaughan, P. Abdulkin, A. Berenguer-Murcia, M. S. Tikhov, B. F. G. Johnson and R. M. Lambert, Nature, 2008, 454, 981–984 CrossRef CAS.
- H. Tsunoyama, N. Ichikuni, H. Sakurai and T. Tsukuda, J. Am. Chem. Soc., 2009, 131, 7086–7093 CrossRef CAS.
- H. Tsunoyama, H. Sakurai, Y. Negishi and T. Tsukuda, J. Am. Chem. Soc., 2005, 127, 9374–9375 CrossRef CAS.
- M. J. Rodríguez-Vázquez, M. C. Blanco, R. Lourido, C. Vázquez-Vázquez, E. Pastor, G. A. Planes, J. Rivas and M. A. López-Quintela, Langmuir, 2008, 24, 12690–12694 CrossRef CAS.
- Y. W. Cao, R. Jin and C. A. Mirkin, J. Am. Chem. Soc., 2001, 123, 7961–7962 CrossRef CAS.
- J. Yu, S. Choi and R. M. Dickson, Angew. Chem., Int. Ed., 2009, 48, 318 CrossRef CAS.
- C. M. Ritchie, K. R. Johnsen, J. R. Kiser, Y. Antoku, R. M. Dickson and J. T. Petty, J. Phys. Chem. C, 2007, 111, 175 CrossRef CAS.
- I. Díez, M. Pusa, S. Kulmala, H. Jiang, A. Walther, A. S. Goldmann, A. H. E. Müller, O. Ikkala and R. H. A. Ras, Angew. Chem., Int. Ed., 2009, 48, 2122 CrossRef CAS.
- N. Nishida, H. Yao and K. Kimura, Langmuir, 2008, 24, 2759 CrossRef CAS.
- N. Cathcart, P. Mistry, C. Makra, B. Pietrobon, N. Coombs, M. Jelokhani-Niaraki and V. Kitaev, Langmuir, 2009, 25, 5840 CrossRef CAS.
- O. M. Bakr, V. Amendola, C. M. Aikens, W. Wenselers, R. Li, L. D. Negro, G. C. Schatz and F. Stellacci, Angew. Chem., Int. Ed., 2009, 48, 5921 CrossRef CAS.
- K. V. Mrudula, T. U. B. Rao and T. Pradeep, J. Mater. Chem., 2009, 19, 4335 RSC.
- Z. Wu, E. Lanni, W. Chen, M. E. Bier, D. Ly and R. Jin, J. Am. Chem. Soc., 2009, 131, 16672, DOI:10.1021/ja907627f.
- C. Femoni, M. C. Iapalucci, G. Longoni, C. Tiozzo and S. Zacchini, Angew. Chem., Int. Ed., 2008, 47, 6666 CrossRef CAS.
- O. Lopez-Acevedo, J. Rintala, S. Virtanen, C. Femoni, C. Tiozzo, H. Gronbeck, M. Pettersson and H. Hakkinen, J. Am. Chem. Soc., 2009, 131, 12573 CrossRef CAS.
Footnote |
| † Private communication with Jadzinsky and Kornberg. |
| This journal is © The Royal Society of Chemistry 2010 |