Cytotoxic copper(II) salicylaldehyde semicarbazone complexes: Mode of action and proteomic analysis†
Wan Yen
Lee
a,
Peter Peng Foo
Lee
*a,
Yaw Kai
Yan
a and
Mathew
Lau
b
aNatural Sciences & Science Education, National Institute of Education, Nanyang Technological University, 1 Nanyang Walk, Singapore 637616, Republic of Singapore. E-mail: peter.lee@nie.edu.sg; Fax: +65-6896-9414; Tel: +65-6790-3844
bSchool of Chemical and Life Sciences, Nanyang Polytechnic, 180 Ang Mo Kio Avenue 8, Singapore 569830
First published on 31st August 2010
Abstract
The in vitro cytotoxic studies of a series of salicylaldehyde semicarbazones, HOC6H4CH![[double bond, length as m-dash]](https://www.rsc.org/images/entities/char_e001.gif) N–NHCONR2 (H2R2) and their Cu(II) complexes on a number of human tumor cell lines were conducted and it was observed that their cytotoxicities were enhanced following complexation to copper. These copper(II) complexes also demonstrated higher in vitro activities than the reference drug, cisplatin, on the tumor cell lines at micro molar range. Apoptotic assays and cell cycle analysis of the copper complexes, [Cu(HBnz2)Cl] and [Cu(HBu2)Cl] revealed that they mediated cytotoxicity in MOLT-4 cells via apoptosis. Further proteomic investigation of [Cu(HBnz2)Cl] and [Cu(HBu2)Cl] with respect to their protein expression profiles associated with their mode of action was conducted. By comparing the expression levels of 33 identified protein spots amongst the respective compound-treated profiles, we identified similarities in protein expression patterns between the two copper(II) complexes. The possible roles of the identified proteins in the execution of apoptosis by these copper(II) complexes are discussed.
N–NHCONR2 (H2R2) and their Cu(II) complexes on a number of human tumor cell lines were conducted and it was observed that their cytotoxicities were enhanced following complexation to copper. These copper(II) complexes also demonstrated higher in vitro activities than the reference drug, cisplatin, on the tumor cell lines at micro molar range. Apoptotic assays and cell cycle analysis of the copper complexes, [Cu(HBnz2)Cl] and [Cu(HBu2)Cl] revealed that they mediated cytotoxicity in MOLT-4 cells via apoptosis. Further proteomic investigation of [Cu(HBnz2)Cl] and [Cu(HBu2)Cl] with respect to their protein expression profiles associated with their mode of action was conducted. By comparing the expression levels of 33 identified protein spots amongst the respective compound-treated profiles, we identified similarities in protein expression patterns between the two copper(II) complexes. The possible roles of the identified proteins in the execution of apoptosis by these copper(II) complexes are discussed.
Introduction
Despite the clinical success of cisplatin (cis-[PtCl2(NH3)2]), accompanying limitations such as acquired resistance and host toxicity have driven the search for novel metal-based compounds with improved antitumor properties.1 Metal complexes have been shown to have improved in bioactivity compared to the free ligand.2,3 The enhanced efficacy may be attributed to the use of metal complex as a vehicle for the therapeutic ligand in vivo which could effect the slow release of the therapeutic ligand leading to selectivity and longer acting toxicity.4 Apart from research into platinum based complexes, efforts are now directed towards investigation into complexes that contain other transition metals.5–7Copper complexes of thiosemicarbazones were among the first non-platinum compounds that were reported for their antitumor potential.8–10 In contrast to thiosemicarbazones, the literature records fewer examples of the structurally similar semicarbazones being evaluated for their antitumor activity. Recently, a group of vanadium complexes of salicylaldehyde semicarbazone derivatives were reported for their selective potency on human kidney TK 10 tumour cells.11 Among the five vanadium complexes tested, vanadium(V) complex with N4-(2-naphthyl)semicarbazone displayed the highest cytotoxic activity on TK 10 tumor cells. The results obtained with this study showed that modification of the semicarbazone backbone could have a significant effect on the cytotoxicity of the complexes.11
In this work, we used the 3-(4,5-dimethylthiazol-2-yl)-2,5-diphenyltetrazolium bromide (MTT) assay to evaluate the cytotoxicities of five novel salicylaldehyde N,N-disubstituted semicarbazone derivatives and their respective Cu(II) complexes (Fig. 1) against five human cancer cell lines, MOLT-4 (leukemia), MCF-7 (mammary adenocarcinoma), A-549 (lung carcinoma), SK-II (skin carcinoma) as well as on benign fibroblasts derived from human foreskin. Cisplatin was included as a control drug for screening due to its well-documented mode of action 12 and reported potency on MOLT-4 cells.13,14
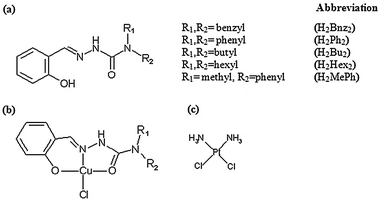 | ||
| Fig. 1 Structure of compounds used in the study. (a) Generic structure of salicylaldehyde-N,N-disubstituted semicarbazones, (b) generic structure of Cu(II) complexes and (c) cisplatin. | ||
In recent years, more mechanistic studies have been developed to extend understanding into the mode of action of promising compounds from in vitro screening.15–17 Functional genomics and proteomic characterization were among the techniques which were effectively used to identify the molecular drug targets of existing and potential compounds. Many of the compounds, which possess antitumor activity, were reported to trigger cell death via apoptosis. The evasion of apoptosis has been established to be a hallmark of cancer.18 Thus, drugs which induce or restore apoptosis in cancer cells can play a potential role in chemotherapy. In this present study, our aim is to characterize the apoptotic effect of two copper(II) complexes, [Cu(HBnz2)Cl] and [Cu(HBu2)Cl] (Fig. 1) on MOLT-4 cells by cell cycle studies, annexin V staining and caspase apoptotic assays. We have also applied the proteomic approach to determine the quantitative changes in protein composition after incubation of MOLT-4 cells with the respective compounds.
Materials and methods
In our earlier work, the synthesis and characterisation of the salicylaldehyde semicarbazones H2Bnz2, H2Ph2 and their respective copper(II) complexes have already been reported.19 In this paper, the synthesis and characterisation of H2Hex2, H2Bu2 and H2MePh and their respective copper(II) complexes were adapted from our earlier report19 as well as from Noblía et al.11 and is briefly outlined as below. All reactions involving air and/or moisture sensitive compounds were routinely performed under nitrogen atmosphere using standard Schlenk techniques. Solvents used were of reagent grade and were distilled under nitrogen and vacuum degassed before use. Chemical reagents, unless otherwise stated, were used directly from commercial sources without any pre-treatment. Elemental analyses (C, H and N) were conducted using a Euro Vector EA 3000 elemental analyzer. The 2,5-bis(5′-tert-butyl-2-benzoxazolyl)thiophene (BBOT) standard was used for calibration. Solid-state IR absorption spectra were recorded in KBr pellets with a Perkin-Elmer Spectrum 100 FTIR spectrometer of operating region 4000 to 400 cm−1. Proton NMR spectra were recorded at room temperature on a Bruker DRX400 spectrometer at 400 MHz, using (CD3)2CO as solvent. Chemical shifts are quoted in ppm downfield of internal standard tetramethylsilane (TMS).Syntheses
H2Hex2. Yield: 65%. Anal. Calcd. for C20H33N3O2: C, 69.1; H, 9.5; N, 12.1. Found: C, 68.8; H, 8.8; N, 12.1. 1H NMR (DMSO-d6): δ 11.63 (s, 1H), 10.35 (s, 1H), 8.36 (s, 1H), 6.85–7.37 (m, 4H), 3.24 (t, 2H), 1.50 (quin, 2H), 1.27 (m, 6H), 0.87 (t, 3H). IR (KBr, cm−1): ν(C=O) 1637.
H2Bu2. Yield: 76%. Anal. Calcd. for C16H25N3O2: C, 65.9; H, 8.7; N, 14.4. Found: C, 65.0; H, 9.6; N, 14.0. 1H NMR [(CD3)2CO]: δ 11.80 (s, 1H), 9.65 (s, 1H), 8.28 (s, 1H), 6.84–7.26 (m, 4H), 3.37 (t, 4H), 1.61 (m, 4H), 1.35 (m, 4H), 0.95 (t, 6H). IR (KBr, cm−1): ν(C
O) 1640.
H2MePh. Yield: 60%. Anal. Calcd. for C15H15N3O2: C, 66.9; H, 5.6; N, 15.6. Found: C, 66.2; H, 5.8; N, 15.3. 1H NMR [(CD3)2CO]: δ 11.65 (s, 1H), 9.35 (s, 1H), 8.10 (s, 1H), 6.80–7.50 (m, 9H), 3.31 (s, 3H). IR (KBr, cm−1): ν(C
O) 1661.
{Cu(HHex2)Cl}2·2H2O. Light green colour. Yield: 79%. Anal. Calcd. for C40H68N6O6Cl2Cu2: C, 51.9; H, 7.4; N, 9.1. Found: C, 51.6; H, 7.3; N, 9.1. IR (KBr, cm−1): ν(C
O) 1605.
{Cu(HBu2)Cl}·0.5H2O. Brown colour. Yield: 72%. Anal. Calcd. for C16H25N3O2.5ClCu: C, 48.2; H, 6.3; N, 10.5. Found: C, 48.7; H, 6.9; N, 10.5. IR (KBr, cm−1): ν(C
O) 1611.
{Cu(HMePh)Cl}·0.5H2O. Green colour. Yield: 52%. Anal. Calcd. for C15H15N3O2.5ClCu: C, 47.8; H, 4.0; N, 11.2. Found: C, 48.2; H, 4.8; N, 11.0. IR (KBr, cm−1): ν(C
O) 1610.
X-Ray crystallography
Dark brown crystals of [Cu(HBu2)Cl]2·CH3OH were grown by slow evaporation of a methanol solution of the complex at 4 °C. A suitable crystal was mounted on a glass fibre for data collection at 298(2) K. The data were collected in the θ/2θ mode using a Siemens P4 diffractometer with Mo-Kα radiation (λ = 0.71073 Å), and were corrected for absorption effects using ψ-scan data. The structures were solved by direct methods and refined by full-matrix least-squares on F2. All non-hydrogen atoms were refined anisotropically, with the C15′–C16′ distance being restrained to be 1.540 ± 0.001 Å. Refinement without the restraint led to an unreasonably short C15′–C16′ bond length of ca. 1.3 Å. Hydrogen atoms of the [Cu(HBu2)Cl]2 molecule were introduced in calculated positions while those of the solvent molecule were located in difference maps. All hydrogen atoms were allowed to ride on their carrier atoms with idealized bond lengths and angles. Crystal and refinement data are given in Table 1, and selected bond lengths and angles in Table 2.| Empirical formula | C33H52Cl2Cu2N6O5 |
| Formula weight | 810.79 |
| Crystal system | Triclinic |
| Space group | P![[1 with combining macron]](https://www.rsc.org/images/entities/char_0031_0304.gif) |
| a/Å | 11.830(2) |
| b/Å | 12.567(1) |
| c/Å | 13.948(5) |
| α (°) | 90.41(2) |
| β (°) | 107.95(2) |
| γ (°) | 96.696(8) |
| V/Å3 | 1957.1(7) |
| Z | 2 |
| Crystal size/mm | 0.3 × 0.2 × 0.1 |
| Theta range (°) | 1.82 to 25.00 |
| Max. and min. transmission | 0.5610 and 0.5141 |
| μ/mm−1 | 1.268 |
| Reflns. collected | 7960 |
| Independent reflns. (Rint) | 6869 (0.0227) |
| R 1, wR2 [I > 2σ(I)] | 0.0413, 0.1011 |
| Bond lengths | |||
| Cu(1)–O(1) | 1.943(2) | Cu(2)–O(1) | 1.970(2) |
| Cu(1)–O(2) | 1.968(2) | O(2)–C(8) | 1.262(4) |
| Cu(1)–N(1) | 1.965(2) | N(1)–C(7) | 1.282(4) |
| Cu(1)–Cl(1) | 2.238(1) | N(2)–C(8) | 1.367(4) |
| Cu(1)–O(1′) | 2.318(2) | N(3)–C(8) | 1.329(4) |
| Cu(2)–O(1′) | 1.913(2) | O(2′)–C(8′) | 1.262(4) |
| Cu(2)–O(2′) | 1.973(2) | N(1′)–C(7′) | 1.276(4) |
| Cu(2)–N(1′) | 1.944(3) | N(2′)–C(8′) | 1.365(4) |
| Cu(2)–Cl(2) | 2.640(1) | N(3′)–C(8′) | 1.328(4) |
| Bond angles | |||
| O(1)–Cu(1)–N(1) | 89.92(9) | N(1′)–Cu(2)–O(2′) | 80.7(1) |
| O(1)–Cu(1)–O(2) | 163.9(1) | O(1)–Cu(2)–O(2′) | 100.18(9) |
| N(1)–Cu(1)–O(2) | 80.51(9) | O(1′)–Cu(2)–Cl(2) | 101.24(8) |
| O(1)–Cu(1)–Cl(1) | 96.03(7) | N(1′)–Cu(2)–Cl(2) | 95.82(9) |
| N(1)–Cu(1)–Cl(1) | 144.52(9) | O(1)–Cu(2)–Cl(2) | 96.40(7) |
| O(2)–Cu(1)–Cl(1) | 99.29(7) | O(2′)–Cu(2)–Cl(2) | 89.91(8) |
| O(1)–Cu(1)–O(1′) | 74.30(8) | Cu(1)–O(1)–Cu(2) | 100.06(9) |
| N(1)–Cu(1)–O(1′) | 121.8(1) | Cu(1)–O(1′)–Cu(2) | 89.78(9) |
| O(2)–Cu(1)–O(1′) | 99.70(8) | C(8)–N(3)–C(9) | 123.6(3) |
| Cl(1)–Cu(1)–O(1′) | 93.39(7) | C(8)–N(3)–C(13) | 118.8(3) |
| O(1′)–Cu(2)–N(1′) | 93.1(1) | C(9)–N(3)–C(13) | 117.2(2) |
| O(1′)–Cu(2)–O(1) | 83.68(9) | C(8′)–N(3′)–C(13′) | 124.3(3) |
| N(1′)–Cu(2)–O(1) | 167.8(1) | C(8′)–N(3′)–C(9′) | 117.9(3) |
| O(1′)–Cu(2)–O(2′) | 167.8(1) | C(13′)–N(3′)–C(9′) | 117.8(3) |
Cell types and culture conditions
MCF-7, MOLT-4, A-549 and SK-II cell lines were obtained from the American Type Culture Collection (ATCC). Benign human foreskin fibroblasts (as a passage 1 culture) were a generous gift from Dr Gan Shu Uin (Department of Surgery, National University of Singapore). Growth of the fibroblasts was subsequently expanded and passage 4 culture was used for compound testing by MTT assay. The media for culture of all cell lines were obtained from Invitrogen. MCF 7 adherent cells were cultured in Dulbecco's Minimal Essential Medium/Ham's F12 medium (1![[thin space (1/6-em)]](https://www.rsc.org/images/entities/char_2009.gif) :1). A 549 and SK II adherent cells were cultured in Dulbecco's Minimal Essential Medium. All media were supplemented with 10% fetal bovine serum, 100 units/ml of penicillin, and 100 μg ml−1 of streptomycin. Human fibroblasts (adherent) were cultured in Dulbecco's Minimal Essential Medium supplemented with 20% fetal bovine serum, 100 units/ml of penicillin and 100 μg ml−1 of streptomycin. All cells were maintained at 37 °C in a 5% CO2 incubator.
:1). A 549 and SK II adherent cells were cultured in Dulbecco's Minimal Essential Medium. All media were supplemented with 10% fetal bovine serum, 100 units/ml of penicillin, and 100 μg ml−1 of streptomycin. Human fibroblasts (adherent) were cultured in Dulbecco's Minimal Essential Medium supplemented with 20% fetal bovine serum, 100 units/ml of penicillin and 100 μg ml−1 of streptomycin. All cells were maintained at 37 °C in a 5% CO2 incubator.
MTT assay for cytotoxicity
The cytotoxicity of compounds was determined by MTT staining assay, according to a procedure reported previously.20 All compounds were dissolved in 100% DMSO at 10 mM stock concentration. In the MTT, the compound stock solutions were diluted freshly in a 10% solution of DMSO in cell culture medium and added to cell culture wells. The final DMSO concentration was 1.25% in each well. A standard plating format was used on each microtitre plate. Six serial dilutions were made for each compound in order to generate a dose-response curve. Each plate contained a blank well (cell-free medium-only well), solvent control wells which contained cells and 1.25% DMSO, drug control wells which contained drug and medium only and growth control wells which contained only cells in medium. There were three replicate wells for each compound dilution.MCF-7, A-549, SK-II and fibroblasts adherent cells were seeded at 20000 cells per well and cultured for 24 h before exposure to compounds for 24 h. MOLT-4 suspension cells were seeded at 40000 cells per well and exposed to compounds on the same day. After incubation, cell viability was determined by the MTT dye reduction method20 and measured at 570 nm using a microtitre plate reader (Biorad, 168-1000EDU).
The inhibitory concentration, IC50, was defined as the effective concentration of compounds that caused 50% reduction of cell growth relative to solvent controls. Each IC50 value was calculated based on dose response curve by non-linear regression and sigmoidal analysis function in the GraphPad Prism data analysis software (by GraphPad software, USA).
Flow cytometric analysis of cell cycle
One million MOLT-4 cells were cultivated in 5 cm2 sterile petri dishes and treated with 2 μM [Cu(HBnz2)Cl] and 2.5 μM [Cu(HBu2)Cl] respectively or solvent control (1% DMSO) at 37 °C, 5% CO2 for 3, 6, 12 and 24 h. After treatment, the cells were collected by centrifugation at 200 g for 5 min and washed twice with 5 ml PBS. The cells were fixed in 50% ethanol on ice for 30 min, spun down and the cell pellets were resuspended in 1 ml of freshly prepared staining solution containing 10 mg l−1 RNAse (Sigma, R5503) for RNA digestion and 1 mg ml−1 propidium iodide (PI) (Sigma, P4170) for DNA staining. The samples were analyzed with a Dako Cytomation Cyan LX flow cytometer with 488 nm laser excitation, and data from detection of 10000 cells per sample was acquired. The data was plotted as number of events versus propidium iodide intensity using the Summit version 4.3 software. Apoptotic cells were presented as the percentage of hypodiploid cells.
Assessment of apoptosis
One million MOLT-4 cells were grown in 5 cm2 sterile petri dishes and treated with 2 μM [Cu(HBnz2)Cl] and 2.5 μM [Cu(HBu2)Cl] respectively or solvent control (1% DMSO) at 37 °C, 5% CO2 for 3, 6, 12 and 24 h. Apoptotic cell death was determined by staining treated cells with annexin-V-FITC and counterstaining with propidium iodide. Annexin-V-FITC binds to the exposed phosphatidylserine (PS) on the outer plasma membrane of apoptotic cells. PI is excluded by viable cells with intact membranes. Cells positive for annexin-V-FITC but negative for PI are defined as apoptotic.21 Treated cells were washed twice with PBS and stained with annexin-V-FITC (BD Pharmingen, 51-65874X) and PI (Sigma, 20 μg ml−1). Cells were analysed on a Dako Cytomation Cyan LX flow cytometer with 488 nm laser excitation, 525 nm emission for FITC and 575 nm emission for PI, and cross-examined on a Olympus BX41 microscope equipped with a filter set for fluorescein and PI under 20× magnification.Sample preparation for two-dimensional gel electrophoresis
Ten million MOLT-4 cells were incubated with 2 μM [Cu(HBnz2)Cl] and 2.5 μM [Cu(HBu2)Cl] respectively at 37 °C, 5% CO2 for 24 h. After which, the cells were lysed by resuspension in lysis solution (7 M urea, 2 M thiourea, 4% CHAPS, 30 mM Tris, pH 9.0) and briefly sonicated on ice for 2 min at 30% amplitude, 30 s interval. Protein samples were prepared using the 2-D cleanup kit (GE Healthcare, 80-6484-51) and the amount of protein was quantified using the 2-D Quant kit (GE Healthcare, 80-6483-56).Two-dimensional electrophoresis (2-DE) conditions for separation of proteins
Protein samples (500 μg) were loaded by cup-loading onto rehydrated IPG strips (24 cm, NL 3-10, GE Healthcare, 17-6002-45). Isoelectric focusing was performed at 50 μA/IPG strip, 64 kVh for 16 h. After focusing, IPG strips were equilibrated in 50 mM Tris-HCl (pH 8.8)/6 M urea/30% glycerol/2% SDS/1% bromophenol blue/2% DTT for 15 min and then equilibrated in 50 mM Tris-HCl (pH 8.8)/6 M urea/30% glycerol/2% SDS/1% bromophenol blue/2.5% iodoacetamide. In the second dimension, 12.5% separating SDS-PAGE gel was used. SDS-PAGE gels for comparison were run simultaneously in an Ettan™ DALTtwelve electrophoresis unit (GE Healthcare, 80-6466-27) at 2 watts per gel overnight. Proteins were visualized by Coomassie blue staining (0.5% Coomassie brilliant blue, 40% methanol, 10% acetic acid). Stained gels were scanned using LabScan™ (GE Healthcare, 28-9076-07).Analysis of gel images and in-gel tryptic digestion
Image analysis was carried out using the REDFIN software (Ludesi Software, Switzerland). Proteins separated by 2-DE were evaluated in terms of their relative spot staining intensities against the background. Comparisons were made between gel images of protein profiles obtained from cells respectively treated with [Cu(HBnz2)Cl] and [Cu(HBu2)Cl] against the image from untreated control cells. Triplicate runs were conducted to ensure consistency. Protein spots with at least two-fold difference in expression intensity were manually excised from the gel and subjected to in-gel trypsin digestion.22 The proteins were analysed by matrix assisted laser desorption/ionization- time of flight mass spectrometry (MALDI-TOF MS, ABI 4800) using Swiss-Prot database matching. Proteins with significant protein scores (p < 0.05) and mass error tolerance of 50 ppm are considered to be confidently identified.Detection of caspase 3 activity
The caspase 3 activity was quantified according to instructions of the colorimetric assay kit (Clontech 636217). One million MOLT-4 cells were incubated with 2 μM [Cu(HBnz2)Cl] and 2.5 μM [Cu(HBu2)Cl] respectively for 24 h and after which, the cell pellets were collected by centrifugation at 200 g for 5 min. The cell pellets were lysed in 50 μl cell lysis buffer. Aliquots of 50 μg of cell lysate were mixed with 50 μl of reaction buffer and incubated with the caspase 3 substrate Ac-DEVD-pNA (50 μM) at 37 °C for 1 h. The caspase 3 activity was determined spectrophotometrically at 405 nm.Western blot analysis
One million MOLT-4 cells were incubated with 2 μM [Cu(HBnz2)Cl] and 2.5 μM [Cu(HBu2)Cl] respectively for 24 h. The cell pellets were collected by centrifugation at 200 g for 5 min at 4 °C and lysed by resuspension in lysis solution (7 M urea, 2 M thiourea, 4% CHAPS, 30 mM Tris, pH 9.0) and brief sonication on ice for 2 min at 30% amplitude, 30 s interval. The cell lysates were centrifuged at 12000 rpm for 5 min. The protein-containing supernatants from the control untreated MOLT-4 and treated cell lysates were quantified using Bradford protein assay reagent (Biorad, 500-0201). Equal amounts of proteins (20 μg) were boiled at 100 °C with 10 μl of 2 × laemmli sample buffer (Biorad, 161-0737) for 2 min, and loaded into each lane of a SDS-PAGE gel (5% stacking, 10% resolving). After electrophoresis, the separated proteins were transferred to a nitrocellulose membrane (GE Healthcare, RPN2020D). The blots were blocked in PBS containing 0.05% Tween 20 and 5% non-fat milk for 1 h at room temperature. After blocking, the blots were probed with primary respective antibodies at their respective dilutions: rabbit polyclonal caspase 3 antibody (1:2500, USBiological, C2087-16), goat polyclonal glyceraldehyde-3-phosphate dehydrogenase (GAPDH) antibody (1:5000, Abcam, ab9483), rabbit polyclonal PABP1 antibody (1:5000, Abcam, ab21060), rabbit polyclonal RBP 4 antibody (1:5000, Abcam, ab64194), rabbit polyclonal RhoGDP dissociation inhibitor (RhoGDI) (1:5000, USBiological, R1998-20), and goat polyclonal actin (1:5000, USBiological, A0759-11G) at 4 °C overnight. After washing twice with PBS Tween (PBS containing 0.05% Tween 20), the blots were incubated with horseradish peroxidase-conjugated polyclonal goat anti-rabbit secondary antibody (HRP), (1:5000, USBiological, 11904-39) or horseradish peroxidase-conjugated polyclonal rabbit anti-goat secondary antibody (1:5000, USBiological, I1904-28V) (according to primary antibody used) for 1 h at room temperature. Blots were washed again 3 × 5 min in PBS Tween and visualized using an enhanced chemiluminescence (ECL) kit (GE healthcare, RPN2124), in accordance with the manufacturer's recommendations.
Results and discussion
Crystal structure of [Cu(HBu2)Cl]2
The molecule of [Cu(HBu2Cl)]2 contains two copper atoms [2.9991(9) Å apart] bridged by the phenoxo oxygen atoms of the [HBu2]− ligands (Fig. 2). Each semicarbazone ligand adopts a tridentate coordination mode involving its phenoxo oxygen, imino nitrogen and carbonyl oxygen atoms. Both copper atoms are also bound to a chloride ligand each. While Cu(2) clearly adopts a square pyramidal geometry, with Cl(2) being the apical ligand, the geometry about Cu(1) is intermediate between square pyramidal [with O(1′) being the apical ligand] and trigonal bipyramidal [with O(1) and O(2) being the axial ligands]. The asymmetry of the dimer is also reflected by the drastic difference between the Cu(2)–O(1′) and Cu(1)–O(1′) distances [1.913(2) and 2.318(2) Å respectively]. These distances are within the range of reported data for normal Cu–O bonds and weak Cu–O interactions, respectively.23 Similarly, there is a large difference between the Cu(1)–Cl(1) [2.238(1) Å (normal)] and Cu(2)–Cl(2) [2.640(1) Å (weak interaction)] bond lengths. It is noteworthy that dimeric structures were proposed for several salicylaldehyde semicarbazone copper(II) complexes based on magnetic susceptibility data but no crystal structure determination was carried out.19![Crystal structure of [Cu(HBu2)Cl]2 (40% probability ellipsoids); hydrogen atoms are omitted for clarity.](/image/article/2010/MT/c0mt00016g/c0mt00016g-f2.gif) | ||
| Fig. 2 Crystal structure of [Cu(HBu2)Cl]2 (40% probability ellipsoids); hydrogen atoms are omitted for clarity. | ||
The lengths of the CO, CN and C–N bonds within the [HBu2]− ligands (Table 2) are similar to those observed in the parent salicylaldehyde semicarbazone, HOC6H4CHN–NHCONH2.24 The three angles about the terminal nitrogen atom of both ligands [N(3) and N(3′)] sum up to 360°, indicating a trigonal planar geometry for the nitrogen atoms. This implies that the terminal nitrogen is sp2 hybridised and conjugated with the carbonyl group. The coordination plane of each terminal nitrogen is nearly parallel to the mean plane of the chelate ring to which the nitrogen is attached (angles of deviation are 3 and 8° respectively), providing further evidence for the conjugation of the nitrogen lone pair with the CO double bond.
Interestingly, the solid-state structure of the analogous [Cu(HBnz2)Cl] has been proven to be monomeric by X-ray crystallography.19 This complex is green in colour both in solution and as a solid. On the other hand, [Cu(HBu2)Cl] is brown as a solid but green in solution, suggesting that the dimers dissociate to form monomers in solution. This is consistent with the presence of a very long (weak) Cu–O bridging bond in the crystal structure of the dimer.
The Cu(II) complexes are more cytotoxic on cancer cells than their respective ligand counterparts.
The cytotoxicity of the series of salicylaldehyde semicarbazone derivatives and their corresponding Cu(II) complexes, as well as cisplatin, against the MOLT-4, MCF-7, A-549, SK-II, and benign fibroblasts from human foreskin were determined using the MTT assay (Table 3). All the Cu(II) complexes showed strong cytotoxic activity on all the tested cancer cell lines (IC50 values of 2–15 μM), and are more active than the uncomplexed ligands and cisplatin.| Cell lines | |||||
|---|---|---|---|---|---|
| Compounds | MOLT-4 | A-549 | MCF-7 | SK-II | Benign fibroblasts |
| H2Bnz2 | 11 (1) | >125 | 8 (3) | 10 (4) | 100 (4) |
| H2Ph2 | >63 | 63 (4) | >62.5 | >62.5 | >62.5 |
| H2MePh | 56 (1) | >125 | >125 | >125 | >125 |
| H2Bu2 | 4.9 (3) | 53 (8) | 5 (4) | 8 (0.2) | >125 |
| H2Hex2 | 56 (5) | 5 (2) | 8 (4) | >125 | >125 |
| [Cu(HBnz2)Cl] | 2 (0.3) | 4 (2) | 5 (0.3) | 3 (0.6) | 32 (0.2) |
| [Cu(HPh2)Cl] | 4 (0.2) | 1 (0.3) | 2.5 (0.3) | 1 (0.3) | 28.9 (0.4) |
| [Cu(HMePh)Cl] | 6.5 (0.1) | 10 (0.4) | 10 (2) | 15 (3) | 21 (0.7) |
| [Cu(HBu2)Cl] | 2.5 (0.3) | 6 (0.9) | 10 (1) | 6.7 (0.2) | 40 (5) |
| [Cu(HHex2)Cl] | 5 (0.5) | 5 (0.7) | 3 (1) | 10 (2) | 17.8 (0.3) |
| Cisplatin | 18 (0.6) | 79 (1) | 71 (5) | >125 | 28 (0.3) |
The toxicity of the compounds towards the benign human fibroblasts was also assessed. Results showed that all the uncomplexed ligands (IC50 > 62.5 μM) displayed low toxicity, whilst the Cu(II) complexes and cisplatin are more toxic with IC50 values of 18–40 μM. It is also noteworthy that the Cu(II) complexes are less toxic towards the benign fibroblasts. This is important because specificity of potential antitumor compounds toward malignant cells will determine how useful they will be as drugs with minimal side effects. Among the copper compounds, [Cu(HBu2)Cl] showed a good activity profile with low activity on the benign fibroblasts accompanying its considerable cytotoxicity towards the cancer cell lines that were tested.
The biological effects of the complexes [Cu(HBnz2)Cl] and [Cu(HBu2)Cl] on MOLT-4 cells were further investigated, as discussed below. For these studies, the concentrations of [Cu(HBnz2)Cl] and [Cu(HBu2)Cl] used were 2 and 2.5 μM respectively. These concentrations correspond to the IC50 values of the compounds on MOLT-4 cells.
The Cu(II) complexes induce apoptosis in MOLT-4 cells
MOLT-4 cells were exposed to [Cu(HBnz2)Cl] and [Cu(HBu2)Cl] for 24 h. The apoptotic activity of the compounds is highlighted by the results of the annexin-V-FITC and propidium iodide (PI) staining depicted in Fig. 3a. Cells following treatments with the Cu(II) complexes showed an increasing degree of annexin-V-FITC positivity over time, indicative of cells undergoing apoptosis (Fig. 3b).![Assessment of apoptosis in MOLT-4 cells treated with Cu(ii) complexes. (a) Depiction of MOLT-4 cells exposed to [Cu(HBnz2)Cl] and [Cu(HBu2)Cl] over 24 h with annexin-V-FITC and propidium iodide staining. Cells were viewed under fluorescence microscopy using a 20× objective. (b) Flow cytometric assessment of apoptosis. MOLT-4 cells were treated with [Cu(HBnz2)Cl] and [Cu(HBu2)Cl] for 3, 6, 12, 24 h. Cell death was measured by labeling with annexin-V-FITC and counterstaining with propidium iodide. (i) apoptosis, (ii) necrosis-like cell death. Mean value ± standard deviation are shown. Cells stained with annexin-V-FITC only is characteristic for apoptosis (Fig. 3b(i)), while cells stained with PI alone is indicative of necrosis (Fig. 3b(ii)).25](/image/article/2010/MT/c0mt00016g/c0mt00016g-f3.gif) | ||
| Fig. 3 Assessment of apoptosis in MOLT-4 cells treated with Cu(II) complexes. (a) Depiction of MOLT-4 cells exposed to [Cu(HBnz2)Cl] and [Cu(HBu2)Cl] over 24 h with annexin-V-FITC and propidium iodide staining. Cells were viewed under fluorescence microscopy using a 20× objective. (b) Flow cytometric assessment of apoptosis. MOLT-4 cells were treated with [Cu(HBnz2)Cl] and [Cu(HBu2)Cl] for 3, 6, 12, 24 h. Cell death was measured by labeling with annexin-V-FITC and counterstaining with propidium iodide. (i) apoptosis, (ii) necrosis-like cell death. Mean value ± standard deviation are shown. Cells stained with annexin-V-FITC only is characteristic for apoptosis (Fig. 3b(i)), while cells stained with PI alone is indicative of necrosis (Fig. 3b(ii)).25 | ||
Apart from assessing cell death by detecting annexin/PI inclusion, we measured the caspase 3 activity as an alternative indicator of apoptotic cell death. Activation of caspase 3 activity is integral to the initiation of apoptosis.26,27 MOLT-4 cells treated with the respective compounds had an increased caspase 3 activity over 24 h of treatment (Fig. 4a). Following treatments of [Cu(HBnz2)Cl] and [Cu(HBu2)Cl] in MOLT-4 cells, caspase 3 activity is detected after 1 h of treatment and peaking at 6–12 h. Correspondingly, Western blotting with antibodies against caspase 3 also revealed the presence of an active cleaved 17 kDa caspase 3 subunit (Fig. 4b).
![Detection of caspase 3 activity using MOLT-4 cells treated with [Cu(HBnz2)Cl] and [Cu(HBu2)Cl] respectively. Protein lysates prepared from MOLT-4 cells treated with the respective compounds were collected at 1 h intervals. (a) Caspase 3 activity was determined by the measurement of caspase-specific cleavage of the colorimetric substrate Ac-DEVD-pNA. The caspase 3 activity experienced with compound treatments over time is presented as a graph. (b) Separation of protein on SDS-PAGE gels, blots were probed with antibodies against procaspase 3, cleaved caspase 3 product and actin. Each lane contains 20 μg of protein. The blot from [Cu(HBnz2)Cl]-treated protein lysate is shown as a representative result of the study: experiment with [Cu(HBu2)Cl] treatment yielded similar results.](/image/article/2010/MT/c0mt00016g/c0mt00016g-f4.gif) | ||
| Fig. 4 Detection of caspase 3 activity using MOLT-4 cells treated with [Cu(HBnz2)Cl] and [Cu(HBu2)Cl] respectively. Protein lysates prepared from MOLT-4 cells treated with the respective compounds were collected at 1 h intervals. (a) Caspase 3 activity was determined by the measurement of caspase-specific cleavage of the colorimetric substrate Ac-DEVD-pNA. The caspase 3 activity experienced with compound treatments over time is presented as a graph. (b) Separation of protein on SDS-PAGE gels, blots were probed with antibodies against procaspase 3, cleaved caspase 3 product and actin. Each lane contains 20 μg of protein. The blot from [Cu(HBnz2)Cl]-treated protein lysate is shown as a representative result of the study: experiment with [Cu(HBu2)Cl] treatment yielded similar results. | ||
Cell cycle studies
Many chemotherapeutics interfere with important steps in cell cycle progression such as DNA replication and repair.28 To assess this property, we performed a DNA content analysis of MOLT-4 cells treated with the test compounds for 24 h. In comparison to untreated cells, cells treated with [Cu(HBnz2)Cl] showed an increase in the percentage of G0 cells (apoptotic cells harboring hypodiploid content of chromosomes) and an accumulation of diploid cells, suggesting apoptosis and G1-phase cell cycle arrest (Fig. 5b). [Cu(HBu2)Cl] also induced an increase in percentage of G0 cells and is G1 phase specific thus retarding the entry of cells into both the S and G2/M phase. (Fig. 5c).![Effect of test compounds on cell cycle in MOLT-4 cells. MOLT-4 cells were treated with respective compounds for 24 h at the indicated concentration and fixed with ethanol. The cells were stained with propidium iodide to detect DNA content by flow cytometry analysis. (a) Solvent control, (b) [Cu(HBnz2)Cl] and (c) [Cu(HBu2)Cl].](/image/article/2010/MT/c0mt00016g/c0mt00016g-f5.gif) | ||
| Fig. 5 Effect of test compounds on cell cycle in MOLT-4 cells. MOLT-4 cells were treated with respective compounds for 24 h at the indicated concentration and fixed with ethanol. The cells were stained with propidium iodide to detect DNA content by flow cytometry analysis. (a) Solvent control, (b) [Cu(HBnz2)Cl] and (c) [Cu(HBu2)Cl]. | ||
Proteome profiles of control and drug-treated cancer cells
To further investigate the mode of action of the compounds, the 2-DE separated protein profiles of the drug-treated cell lysates were studied. Gel protein images for control, [Cu(HBnz2)Cl] and [Cu(HBu2)Cl] treated MOLT-4 cells are shown in Fig. 6 and 7. Over 300 protein spots were separated on the gels. Out of these 300 protein spots in control gel profile, 33 spots were identified successfully by MALDI-TOF MS. All proteins are identified by matching against the Swiss-Prot database. The proteins ID identified are shown in Table 4. The identified proteins are mainly heat shock, apoptotic-related, cell cycle-related, metabolic, transcription, translation and stress response proteins. Among this list, proteins with changes in expression levels in compound-treated cells as compared to control are shown in Table 5. [Cu(HBnz2)Cl] and [Cu(HBu2)Cl] induced ten and eleven proteins respectively with significant two-fold change in expression. This list of protein ID is almost identical. In this regard, the two complexes may experience similar mechanism in the metabolism of their uptake and cytotoxicity.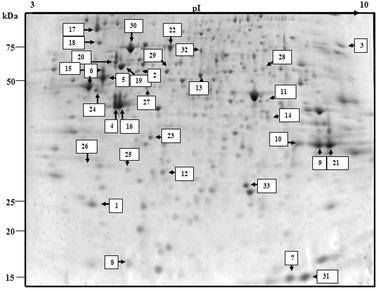 | ||
| Fig. 6 Protein profile of untreated control using MOLT-4 cells. Identified protein spots are indicated with spot numbers corresponding to those in Tables 2 and 3. | ||
![Coomassie blue-stained protein profiles of treated MOLT-4 cell lysates. 2-D protein pattern of (a) [Cu(HBnz2)Cl]-treated and (b) [Cu(HBu2)Cl]-treated. Only the spot numbers of identified proteins with at least two-fold level of differential expression are indicated. Down-regulation (↓) and up-regulation (↑).](/image/article/2010/MT/c0mt00016g/c0mt00016g-f7.gif) | ||
| Fig. 7 Coomassie blue-stained protein profiles of treated MOLT-4 cell lysates. 2-D protein pattern of (a) [Cu(HBnz2)Cl]-treated and (b) [Cu(HBu2)Cl]-treated. Only the spot numbers of identified proteins with at least two-fold level of differential expression are indicated. Down-regulation (↓) and up-regulation (↑). | ||
| Major function | Spot No. | Protein ID | Accession number | Molecular weight/pI | Sequence coverage (%) |
|---|---|---|---|---|---|
| Apoptosis-related | 1 | RhoGDP dissociation inhibitor, beta (RhoGDI) | P52566 | 23 kDa/5.10 | 61 |
| Apoptosis-related | 2 | ER-60 protease | P30101 | 57 kDa/5.98 | 24 |
| PDI (protein disulfide isomerase) | |||||
| Translation | 3 | PABP 1 (polyadenylate-binding protein 1) | P11940 | 71 kDa/9.52 | 18 |
| Cytoskeletal | 4 | Actin | P63261 | 42 kDa/5.29 | 20 |
| Cytoskeletal | 5 | Tubulin alpha 6 | Q9BQE3 | 50 kDa/4.96 | 41 |
| Cytoskeletal | 6 | Tubulin, beta | P07437 | 49 kDa/4.78 | 35 |
| Cytoskeletal | 7 | Profilin 1 | P07737 | 15 kDa/8.44 | 31 |
| Apoptosis-related | 8 | Stathmin/Op18 (leukemia-associated phosphoprotein p18) | P16949 | 17 kDa/5.76 | 18 |
| Glucose metabolism | 9 | Malate dehydrogenase | P40925 | 36 kDa/8.92 | 19 |
| Glucose metabolism | 10 | Glyceraldehyde-3-phosphate dehydrogenase (GADPH) | P04406 | 36 kDa/8.57 | 37 |
| Glucose metabolism | 11 | Phosphoglycerate kinase 1 | P00558 | 45 kDa/8.3 | 35 |
| Glucose metabolism | 12 | Triosephosphate isomerase | P60174 | 27 kDa/6.45 | 44 |
| Glucose metabolism | 13 | Alpha enolase | P06733 | 47 kDa/7.01 | 45 |
| Glucose metabolism | 14 | Fructose-bisphosphate adolase A (adolase A) | P04075 | 40 kDa/8.3 | 32 |
| ATP production | 15 | ATP synthase, H+ transporting, mitochondrial F1 complex, beta subunit precursor | P06576 | 56 kDa/5.26 | 35 |
| Purine metabolism | 16 | Adenosine deaminase | P00813 | 41 kDa/5.63 | 30 |
| Molecular chaperone | 17 | Heat shock Gp96 protein | Q16251 | 93 kDa/4.77 | 57 |
| Molecular chaperone | 18 | 90 kDa heat shock protein 1 | P14625 | 84 kDa/4.97 | 43 |
| Molecular chaperone | 19 | 60 kDa heat shock protein | P10809 | 61 kDa/5.7 | 24 |
| Molecular chaperone | 20 | TCP-1 epsilon (T-complex protein 1 subunit epsilon) | P48643 | 60 kDa/5.45 | 25 |
| Transcription | 21 | Heterogeneous nuclear ribonucleoprotein (hnRNP A2/hnRNP B1) | P22626 | 37 kDa/8.97 | 30 |
| Transcription | 22 | Heterogeneous nuclear ribonucleoprotein L (hnRNP L) | P14866 | 61 kDa/6.65 | 8 |
| Transcription | 23 | Heterogeneous nuclear ribonucleoprotein H3 (hnRNP H3) | P31942 | 37 kDa/6.37 | 9 |
| Cell cycle-related | 24 | Retinoblastoma-binding protein 4 (RBP 4) | Q09028 | 48 kDa/4.74 | 49 |
| Transcription | 25 | Prohibitin | P35232 | 30 kDa/5.57 | 44 |
| Cell cycle-related | 26 | PCNA cyclin (proliferating cell nuclear antigen) | P12004 | 29 kDa/4.57 | 18 |
| Cell cycle-related | 27 | Cell cycle p38-2G4 homolog (Erbp 1) Proliferation-associated protein 2G4 (hG4-1) | Q9UQ80 | 44 kDa/6.13 | 19 |
| Transcription | 28 | TBP (TATA-binding protein-associated factor 2N) (RNA-binding protein 56) | Q92804 | 62 kDa/8.04 | 7 |
| Stress response proteins | 29 | Stress-induced phosphoprotein (STI1) | P31948 | 63 kDa/6.4 | 22 |
| Stress response proteins | 30 | Stress 70 protein, mitochondrial precursor (75 kDa glucose-regulated protein) (GRP 75) | P38646 | 74 kDa/5.87 | 8 |
| Cell Proliferation and differentiation | 31 | NDP Kinase B/Nm 23 (nucleotide diphosphate kinase) | P22392 | 17 kDa/8.52 | 25 |
| RNA replication (ATP-dependent DNA helicase) | 32 | Far upstream element-binding protein 1 (FUSE-binding protein 1) | Q96AE4 | 68 kDa/7.18 | 25 |
| tRNA processing | 33 | 3-Hydroxylacyl-CoA dehydrogenase type 2 | Q99714 | 27 kDa/7.66 | 22 |
| Major function | Spot No. | Protein ID | [Cu(HBnz2)Cl] | [Cu(HBu2)Cl] |
|---|---|---|---|---|
| Apoptosis-related | 1 | RhoGDP dissociation inhibitor, beta (RhoGDI) | −2.1 | −2.0 |
| Apoptosis-related | 2 | ER-60 protease | −2.1 | −2.2 |
| Translation | 3 | PABP 1 (polyadenylate-binding-protein 1) | −3.75 | −3.0 |
| Cytoskeletal | 4 | Actin | — | — |
| Cytoskeletal | 5 | Tubulin alpha 6 | — | — |
| Cytoskeletal | 6 | Tubulin, beta | — | — |
| Cytoskeletal | 7 | Profilin 1 | −1.9 | |
| Cytoskeletal/apoptosis-related | 8 | Stathmin/Op18 | −2.0 | −2.1 |
| Glucose metabolism | 9 | Malate dehydrogenase | −1.64 | −1.9 |
| Glucose metabolism | 10 | Glyceraldehyde-3-phosphate dehydrogenase (GADPH) | −2.2 | −2.1 |
| Glucose metabolism | 11 | Phosphoglycerate kinase 1 | — | — |
| Glucose metabolism | 12 | Triosephosphate isomerase | −1.3 | −1.5 |
| Glucose metabolism | 13 | Alpha enolase | −1.4 | −1.7 |
| Glucose metabolism | 14 | Fructose-bisphosphate adolase A (adolase A) | −2.1 | −2.0 |
| ATP production | 15 | ATP synthase, beta | +1.1 | +1.0 |
| Purine metabolism | 16 | Adenosine deaminase | — | — |
| Molecular chaperones | 17 | Heat shock Gp96 protein | −2.0 | −2.1 |
| Molecular chaperones | 18 | 90 kDa heat shock protein 1 | +1.4 | +1.2 |
| Molecular chaperones | 19 | 60 kDa heat shock protein | −1.1 | −1.3 |
| Molecular chaperones | 20 | TCP-1 epsilon (T-complex protein 1 subunit epsilon) | −1.6 | −1.6 |
| Transcription | 21 | Heterogeneous nuclear ribonucleoprotein hnRNP A2/hnRNP B1 | −1.2 | −1.1 |
| Transcription | 22 | Heterogeneous nuclear ribonucleoprotein L (hnRNP L) | −1.3 | −1.5 |
| Transcription | 23 | Heterogeneous nuclear ribonucleoprotein H3 (hnRNP H3) | −1.4 | −1.4 |
| Cell cycle-related | 24 | Retinoblastoma binding protein 4 (RBP 4) | +1.7 | −2.0 |
| Transcription | 25 | Prohibitin | −1.6 | −1.3 |
| Cell cycle-related | 26 | PCNA cyclin (proliferating cell nuclear antigen) | — | — |
| Transcription | 27 | Cell cycle p38-2G4 homolog (Erbp 1) | −3.0 | −3.1 |
| Proliferation-associated protein 2G4 (hG4-1) | ||||
| Transcription | 28 | TBP (TATA-binding protein-associated factor 2N) (RNA-binding protein 56) | −3.0 | −3.2 |
| Stress responsive | 29 | Stress-induced phosphoprotein (STI 1) | −1.2 | −1.4 |
| Stress responsive | 30 | Stress 70 protein, mitochondrial precursor (75 kDa glucose-regulated protein) (GRP 75) | −1.3 | −1.2 |
| Transcription | 31 | NDP Kinase B (nucleotide diphosphate kinase) | +2.1 | +2.0 |
| DNA replication (ATP-dependent DNA helicase) | 32 | Far upstream element-binding protein 1 (FUSE-binding protein 1) | −1.3 | −1.4 |
| tRNA processing | 33 | 3-Hydroxylacyl-CoA dehydrogenase type 2 | −1.9 | −1.5 |
Hence, we will only be discussing briefly, the identified functions of the eleven individual proteins and the possible effects of their modified expression towards the antitumor activity of [Cu(HBnz2)Cl] and [Cu(HBu2)Cl]. Interestingly, we discovered that eight out of these eleven proteins might affect MOLT-4 cell proliferation via dysregulation of cellular events important for cancer cell survival (depicted in Fig. 8).
![A summary of cellular events that may be inhibited in MOLT-4 cells treated with [Cu(HBnz2)Cl] or [Cu(HBu2)Cl]. The potential associated drug targets are the following: 1. TBP (transcription); 2. PABP 1 (translation); 3. Hsp 96 (protein folding); 4. Adolase A, GAPDH (glucose metabolism); 5. RhoGDI (signal transduction); 6. Stathmin (mitosis).](/image/article/2010/MT/c0mt00016g/c0mt00016g-f8.gif) | ||
| Fig. 8 A summary of cellular events that may be inhibited in MOLT-4 cells treated with [Cu(HBnz2)Cl] or [Cu(HBu2)Cl]. The potential associated drug targets are the following: 1. TBP (transcription); 2. PABP 1 (translation); 3. Hsp 96 (protein folding); 4. Adolase A, GAPDH (glucose metabolism); 5. RhoGDI (signal transduction); 6. Stathmin (mitosis). | ||
Metabolic proteins
We found that the metabolic proteins glyceraldehyde-3-phosphate dehydrogenase and fructose-bisphosphate adolase A were down regulated after post-treatment with [Cu(HBnz2)Cl] or [Cu(HBu2)Cl]. Genes of glucose metabolism have been reported to be ubiquitously over expressed in cancer cells.29,30 Therefore, drugs have been developed to target glucose metabolic enzymes in order to deprive cancer cells of glucose, leading to metabolic oxidative stress and eventual cell death. In a similar fashion, the ability of [Cu(HBnz2)Cl] and [Cu(HBu2)Cl] to induce down-regulation of metabolic proteins in MOLT-4 cells could lead to a reduction in aerobic glycolysis rate and limit cancer cell growth.Apoptosis-related proteins
Three apoptotic-related proteins were down-regulated in MOLT-4 cells following [Cu(HBnz2)Cl] or [Cu(HBu2)Cl] treatment:Cell cycle-related proteins
Two cell cycle-related proteins were down-regulated in MOLT-4 cells following [Cu(HBnz2)Cl] or [Cu(HBu2)Cl] treatment.Transcription
TATA-box-binding protein (TBP) is a key component of the general transcription machinery used by all three eukaryotic RNA polymerases I, II and III (Pol I, II and III).64,65 Despite the central role of TBP in transcription, changes in its expression had been reported to affect cellular gene activity with severe downstream consequences. Enhanced TBP expression in tumorigenesis was seen in clinical screenings of human colon carcinomas.66 Quantitative real-time reverse transcription-PCR (RT-PCR) analysis of the samples revealed that TBP mRNA was elevated in the colon carcinomas.66 Although the specific changes in gene expression leading to TBP overexpression and mediation in tumorigenesis is yet to be revealed, its overexpression has been established to contribute to oncogenesis and therefore, down-regulation of TBP by [Cu(HBnz2)Cl] and [Cu(HBu2)Cl] is a promising chemotherapeutic effect that can inhibit the oncogenesis effect of TBP, rendering cells to undergo apoptosis.Translation
Poly-adenylate binding protein (PABP 1) is an RNA-binding protein and functions in post-translational regulation, e.g. splicing, mRNA transport, mRNA stabilization and translation.67–69 In particular, the role of PABP 1 in translational initiation has been extensively studied.70Lack in PABP 1 expression was found to reduce efficiency of 48S and 80S ribosome initiation complex formation, and reduced rates of translation, which is restored by addition of recombinant PABP 1. From this basis, it is possible that the downregulation of PABP 1 with treatments with [Cu(HBnz2)Cl] and [Cu(HBu2)Cl] could have led to reduced efficiency of translation in MOLT-4 cells, which correlated to an overall reduced level of protein expression.
Molecular chaperone
Heat shock protein 96 (Hsp 96) belongs to the heat shock protein family (Hsps). Hsps are molecular chaperones that assist with protein folding of nascent polypeptides and degradation of misfolded proteins.71 They are ubiquitously expressed in different cellular locations e.g. mitochondria, ER and cytosol and they prevent protein misfolding by binding to nascent polypeptide chains or partially folded intermediates of proteins via their well conserved peptide-binding domain. Hsps are over expressed in a wide variety of cancer cells 72,73 in which they have been proposed to participate in oncogenesis and limit the action of cancer drugs.74–76 Enhanced expression of Hsp 96 has been reported to be related to the growth of cancer cells.77,78 Therefore, inhibiting the function of these chaperones is essential to controlling cancer cells. A therapeutic vaccine against Hsp 96, vitespen is currently in its clinical trial.79 Similarly, the down regulation of Hsp 96 expression by [Cu(HBnz2)Cl] and [Cu(HBu2)Cl] may contribute to impairment of protein folding machinery, resulting in apoptosis of MOLT-4 cells.Cell proliferation and differentiation
Nucleoside diphosphate kinase (NDP Kinase/Nm23) was first described as a housekeeping enzyme responsible for synthesizing nucleoside triphosphates.80,81 Over the years, the role of NDP kinase has been further extended to a series of regulatory activities e.g. cell growth, differentiation and metastasis suppression.82 One of the intriguing biological features of NDP kinase/Nm23 is its metastasis-suppressor activity, which was discovered by Steeg and coworkers.83 Along with the implications of enhanced NDP kinase in leukemia cell lines, the upregulation of NDP kinase B by [Cu(HBnz2)Cl] and [Cu(HBu2)Cl] is consistent with a suppression of MOLT-4 cell growth.Western blot verification of identified proteins
To validate the identification of the proteins by MALDI-TOF MS, four out of 33 proteins (PABP 1, RBP 4, RhoGDI, and GAPDH) were selected for Western blotting. As observed in Fig. 9, the immunoblots detected the presence of the four proteins in control and [Cu(HBnz2)Cl] and [Cu(HBu2)Cl]-treated cell MOLT-4 cell lysates. This evidence indicates accuracy in the proteomic identification results.![Western blot validation of the differentially expressed proteins in the compound treated MOLT-4 cells. Western blots of (a) PABP 1, (b) RBP 4, (c) RhoGDPi, (d) GADPH, (e) actin, 1: Untreated control, 2: [Cu(HBnz2)Cl], 3: [Cu(HBu2)Cl].](/image/article/2010/MT/c0mt00016g/c0mt00016g-f9.gif) | ||
| Fig. 9 Western blot validation of the differentially expressed proteins in the compound treated MOLT-4 cells. Western blots of (a) PABP 1, (b) RBP 4, (c) RhoGDPi, (d) GADPH, (e) actin, 1: Untreated control, 2: [Cu(HBnz2)Cl], 3: [Cu(HBu2)Cl]. | ||
Possible interaction of [Cu(HBnz2)Cl] and [Cu(HBu2)Cl] with DNA
It is likely that the cytotoxic copper(II) semicarbazone complexes exert their biological effects via interaction with DNA. The planar structures of [Cu(HBnz2)Cl] and [Cu(HBu2)Cl] (monomers) would allow for intercalation with the DNA bases. Conductivity measurements on a series of copper(II) salicylaldehyde semicarbazones in DMSO suggest that the chloride ligands remain bound to the copper,19 indicating that the chloride ligands are not readily displaced by DMSO. Given that DMSO is a strong donor solvent, the lack of chloride displacement in DMSO suggests that [Cu(HBnz2)Cl] and [Cu(HBu2)Cl] also do not undergo aquation in vivo (cf. cisplatin) before interacting with DNA.Conclusions
The cytotoxicities of our series of salicylaldehyde semicarbazones and their respective Cu(II) complexes revealed the antitumour potential of this class of compounds. All the Cu(II) complexes showed enhanced cytotoxic levels as compared to their respective ligands. Moreover, the copper complexes were also more active than cisplatin on tumor cells as well as the benign fibroblasts. In order to explain these cytotoxicities, we have further investigated the biochemical mechanism of apoptosis induced by [Cu(HBnz2)Cl] and [Cu(HBu2)Cl]. By characterizing the differential expression levels of proteins in MOLT-4 cells in response to treatment with [Cu(HBnz2)Cl] and [Cu(HBu2)Cl], it is quite clear that the two Cu(II) complexes affect protein expression in MOLT-4 cells in very similar ways. The protein ID list of differential expression is almost identical between these two Cu(II) complexes hence we deduced that they may share similar uptake and cytotoxicity mechanisms in MOLT-4 cells. Ten and eleven out of the 33 identified proteins were found to display apparent modified expression in [Cu(HBnz2)Cl] and [Cu(HBu2)Cl] treated cells respectively. The identified proteins were grouped functionally into cytoskeletal, molecular chaperones, apoptosis-related, glucose metabolic, cell cycle-related, stress-responsive, RNA replication and processing, transcription and translation proteins. By down-regulating TBP, PABP 1, Hsp 96, metabolic proteins, RhoGDI and Stathmin/Op18, these Cu(II) complexes may induce apoptotic cell death in MOLT-4 cells as a consequence of deregulating transcription, translation, protein folding, glucose metabolism, signal transduction or mitosis.Acknowledgements
This research was supported by Grant RI 4/05 LPF from the National Institute of Education, Nanyang Technological University, Singapore. The authors gratefully acknowledge the technical assistance of Ms Shannie Tay in the School of Biological Sciences, Nanyang Technological University, for assisting us with the use of the protein mass spectrometry. We would also like to thank Dr Cherine Tan for assisting us with use of the various proteomics facilities in Nanyang Polytechnic.Notes and references
- E. R. Jamieson and S. J. Lippard, Chem. Rev., 1999, 99, 2467–2498 CrossRef CAS.
- Z. Iakovidou, A. Papageorgiou, M. A. Demertzis, E. Mioglou, D. Mourelatos, A. Kotsis, P. N. Yadav and D. Kovala-Demertzi, Anti-Cancer Drugs, 2001, 12, 65–70 CrossRef CAS.
- D. Kovala-Demertzi, M. A. Demertzis, J. R. Miller, C. Papadopoulou, C. Dodorou and G. Filousis, J. Inorg. Biochem., 2001, 86, 555–563 CrossRef CAS.
- H. Beraldo and D. Gambino, Mini-Rev. Med. Chem., 2004, 4, 31–39 CrossRef CAS.
- L. Giovagnini, S. Sitran, M. Montopoli, L. Caparrotta, M. Corsini, C. Rosani, P. Zanello, Q. P. Dou and D. Fregona, Inorg. Chem., 2008, 47, 6336–6343 CrossRef CAS.
- U. Schatzschneider, J. Niesel, I. Ott, R. Gust, H. Alborzinia and S. Wölfl, ChemMedChem, 2008, 3, 1104–1109 CrossRef CAS.
- L. Messori, F. Abbate, G. Marcon, P. Orioli, M. Fontani, E. Mini, T. Mazzei, S. Carotti, T. O'Connell and P. Zanello, J. Med. Chem., 2000, 43, 3541–3548 CrossRef CAS.
- E. W. Ainscough, A. M. Brodie, W. A. Denny, G. J. Finlay and J. D. Ranford, Journal of Inorganic Biochemistry, 1998, 70, 175–185 CrossRef CAS.
- D. X. West, A. E. Liberta, K. G. Rajendran and I. H. Hall, Anticancer Drugs, 1993, 4, 241–249 CrossRef CAS.
- M. B. Ferrari, F. Bisceglie, G. Pelosi, P. Tarasconi, R. Albertini, P. P. Dall'Aglio, S. Pinelli, A. Bergamo and G. Sava, J. Inorg. Biochem., 2004, 98, 301–312 CrossRef CAS.
- P. Noblía, M. Vieites, B. S. Parajón-Costa, E. J. Baran, H. Cerecetto, P. Draper, M. González, O. E. Piro, E. E. Castellano, A. Azqueta, A. L. d. Ceráin, A. Monge-Vega and D. D. Gambino, J. Inorg. Biochem., 2005, 99, 443–451 CrossRef CAS.
- D. B. Zamble and S. J. Lippard, Trends Biochem. Sci., 1995, 20, 435–439 CrossRef CAS.
- M. Dabholkar, R. Parker and E. Reed, Mutat. Res., DNA Repair, 1992, 274, 45–56 CrossRef CAS.
- X. Zhao, P. P. Lee, Y. K. Yan and C. K. Chu, J. Inorg. Biochem., 2007, 101, 321–328 CrossRef CAS.
- R. Simon, Clin. Cancer Res., 2008, 14, 5984–5993 CrossRef.
- Y. Wang, J. F. Chiu and Q. Y. He, Curr. Drug Discovery Technol., 2006, 3, 199–209 Search PubMed.
- H. Luesch, S. K. Chanda, R. M. Raya, P. D. DeJesus, A. P. Orth, J. R. Walker, J. C. I. Belmonte and P. G. Schultz, Nat. Chem. Biol., 2006, 2, 158–167 CrossRef CAS.
- D. Hanahan and R. A. Weinberg, Cell, 2000, 100, 57–70 CAS.
- P. F. Lee, C.-T. Yang, D. Fan, J. Vittal and J. D. Ranford, Polyhedron, 2003, 22, 2781–2786 CrossRef CAS.
- M. B. Hansen, S. E. Nielson and K. Berg, J. Immunol. Methods, 1989, 119, 203–210 CrossRef CAS.
- J. F. Kerr, A. H. Wyllie and A. R. Currie, Br. J. Cancer, 1972, 26, 239–257 CAS.
- A. Shevchenko, H. Tomas, J. Havlis, J. V. Olsen and M. Mann, Nat. Protoc., 2007, 1, 2856–2860 Search PubMed.
- B. J. Hathaway, Comprehensive Coordination Chemistry, Pergamon, 1987 Search PubMed.
- J. Valdés-Martínez, R. A. Toscano, R. Salcedo, R. Cea-Olivares and A. Meléndez, Monatsh. Chem., 1990, 121, 641–647 CrossRef CAS.
- I. Vermes, C. Haanen, H. Steffens-Nakken and C. Reutelingsperger, J. Immunol. Methods, 1995, 184, 39–51 CrossRef CAS.
- Z. Tao, J. Goodisman, H. S. Penefsky and A. K. Souid, Mol. Pharmaceutics, 2007, 4, 583–595 CrossRef CAS.
- N. A. Thornberry and Y. Lazebnik, Science, 1998, 281, 1312–1316 CrossRef CAS.
- B. R. Chaudhari, R. F. Murphy and D. K. Agrawal, Immunol. Res., 2006, 35, 249–262 Search PubMed.
- K. Mikuriya, Y. Kuramitsu, S. Ryozawa, M. Fujimoto, S. Mori, M. Oka, K. Hamano, K. Okita, I. Sakaida and K. Nakamura, Int. J. Oncol., 2007, 30, 849–855 CAS.
- B. Altenberg and K. O. Greulich, Genomics, 2004, 84, 1014–1020 CrossRef CAS.
- B. Olofsson, Cell. Signalling, 1999, 11, 545–554 CrossRef CAS.
- T. Sasaki and Y. Takai, Biochem. Biophys. Res. Commun., 1998, 245, 641–645 CrossRef CAS.
- C. N. Adra, D. Manor, J. L. Ko, S. Zhu, T. Horiuchi, L. V. Aelst, R. A. Cerione and B. Lim, Proc. Natl. Acad. Sci. U. S. A., 1997, 94, 4279–4284 CrossRef CAS.
- A. P. Golovanov, T. H. Chuang, C. DerMardirossian, I. Barsukov, D. Hawkins, R. Badii, G. M. Bokoch, L. Y. Lian and G. C. Roberts, J. Mol. Biol., 2001, 305, 121–135 CrossRef CAS.
- J. Poland, D. Schadendorf, H. Lage, M. Schnölzer, J. E. Celis and P. Sinha, Clin. Chem. Lab. Med., 2002, 40, 221–234 CrossRef CAS.
- P. Sinha, S. Kohl, J. Fischer, G. Hütter, M. Kern, E. Köttgen, M. Dietel, H. Lage, M. Schnölzer and D. Schadendorf, Electrophoresis, 2000, 21, 3048–3057 CrossRef CAS.
- B. Zhang, Y. Zhang, M. C. Dagher and E. Shacter, Cancer Res., 2005, 65, 6054–6062 CrossRef CAS.
- L. Beretta, M. F. Dubois, A. Sobel and O. Bensaude, Eur. J. Biochem., 1995, 227, 388–395 CrossRef CAS.
- I. A. Leighton, P. Curmi, D. G. Campbell, P. Cohen and A. Sobel, Mol. Cell. Biochem., 1993, 127–128, 151–156 CrossRef CAS.
- L. Beretta, T. Dobransky and A. Sobel, J. Biol. Chem., 1993, 268, 20076–20084 CAS.
- R. Melhem, N. Hailat, R. Kuick and S. M. Hanash, Leukemia, 1997, 11, 1690–1695 CrossRef CAS.
- K. Nylander, U. Marklund, G. Brattsand, M. Gullberg and G. Roos, The Histochemical Journal, 1995, 27, 155–160 Search PubMed.
- B. Friedrich, H. Grönberg, M. Landström, M. Gullberg and A. Bergh, Prostate, 1995, 27, 102–109 CrossRef CAS.
- N. Hailat, J. Strahler, R. Melhem, X. X. Zhu, G. Brodeur, R. C. Seeger, C. P. Reynolds and S. Hanash, Oncogene, 1990, 5, 1615–1618 CAS.
- S. J. Mistry and G. F. Atweh, Anticancer Drugs, 1999, 19, 573–577 CAS.
- S. Jeha, X. N. Luo, M. Beran, H. Kantarjian and G. F. Atweh, Cancer Res., 1996, 56, 1445–1450 CAS.
- R. Urade, M. Nasu, T. Moriyama, K. Wada and M. Kito, J. Biol. Chem., 1992, 267, 15152–15159 CAS.
- J. Lippincott-Schwartz, J. S. Bonifacino, L. C. Yuan and R. D. Klausner, Cell, 1988, 54, 209–229 CrossRef CAS.
- J. Y. Yoo, X. W. Wang, A. K. Rishi, T. Lessor, X. M. Xia, T. A. Gustafson and A. W. Hamburger, Br. J. Cancer, 2000, 82, 683–690 CrossRef CAS.
- N. E. Hynes and H. A. Lane, Nat. Rev. Cancer, 2005, 5, 341–354 CrossRef CAS.
- X. Xia, A. Cheng, T. Lessor, Y. Zhang and A. W. Hamburger, J. Cell. Physiol., 2001, 187, 209–217 CrossRef CAS.
- Y. Zhang and A. W. Hamburger, Br. J. Cancer, 2005, 92, 140–146 CrossRef CAS.
- Y. W. Zhang, X. W. D. Jelovac, T. Nakanishi, M. H. Yu, D. Akinmade, O. Goloubeva, D. D. Ross, A. Brodie and A. W. Hamburger, Proc. Natl. Acad. Sci. U. S. A., 2005, 102, 9890–9895 CrossRef CAS.
- G. A. Otterson, R. A. Kratzke, A. Y. Lin, P. G. Johnston and F. J. Kaye, Oncogene, 1993, 8, 3149–3156.
- A. R. Fattaey, K. Helin, M. S. Dembski, N. Dyson, K. M. Haskell, A. Oliff, D. DefeoJones and R. E. Jones, Oncogene, 1993, 8, 3149–3156.
- Y. W. Kim, A. O. Gregory, R. A. Kratzke, A. B. Coxon and F. J. Kaye, Mol. Cell. Biol., 1994, 14, 7256–7264 CAS.
- S. Mao, G. A. Neale and R. M. Goorha, Oncogene, 1997, 14, 1531–1539 CrossRef CAS.
- J. O. Lee, A. A. Russo and N. P. Pavletich, Nature, 1998, 391, 859–865 CrossRef CAS.
- H. Wen and S. Ao, Gene, 2001, 263, 85–92 CrossRef CAS.
- J. Bartkova, J. Lukas, P. Guldberg, J. Alsner, A. F. Kirkin, J. Zeuthen and J. Bartek, Cancer Res., 1996, 56, 5475–5483 CAS.
- R. Halaban, M. R. Miglarese, Y. Smicun and S. Puig, Int. J. Mol. Med., 1998, 1, 419–425 Search PubMed.
- A. Roesch, B. Becker, S. Meyer, C. Hafner, P. J. Wild, M. Landthaler and T. Vogt, Mod. Pathol., 2005, 18, 565–572 Search PubMed.
- A. Roesch, B. Becker, S. Meyer, P. Wild, C. Hafner, M. Landthaler and T. Vogt, Mod. Pathol., 2005, 18, 1249–1257 Search PubMed.
- G. Orphanides, T. Lagrange and D. Reinberg, Genes Dev., 1996, 10, 2657–2683 CrossRef CAS.
- S. K. Burley and R. G. Roeder, Annu. Rev. Biochem., 1996, 65, 769–799 CrossRef CAS.
- S. A. Johnson, L. Dubeau, M. Kawalek, A. Dervan, A. H. Schönthal, C. V. Dang and D. L. Johnson, Mol. Cell. Biol., 2003, 23, 3043–3051 CrossRef CAS.
- N. K. Gray, J. M. Coller, K. S. Dickson and M. Wickens, EMBO J., 2000, 19, 4723–4733 CrossRef CAS.
- C. Grosset, C. Y. Chen, N. Xu, N. Sonenberg, H. Jacquemin-Sablon and A. B. Shyu, Cell, 2000, 103, 29–40 CrossRef CAS.
- P. R. Copeland and M. Wormington, RNA, 2001, 7, 875–886 CrossRef CAS.
- S. E. Wells, P. E. Hillner, R. D. Vale and A. B. Sachs, Mol. Cell, 1998, 2, 135–140 CrossRef CAS.
- J. Höhfeld, D. M. Cyr and C. Patterson, EMBO Rep., 2001, 2, 885–890 CrossRef CAS.
- Y. J. Hwang, S. P. Lee, S. Y. Kim, Y. H. Choi, M. J. Kim, C. H. Lee, J. Y. Lee and D. Y. Kim, Yonsei Medical Journal, 2009, 50, 399–406 Search PubMed.
- I. D. Chant, P. E. Rose and A. G. Morris, Br. J. Haematol., 1995, 90, 163–168 CrossRef CAS.
- P. Pandey, A. Saleh, A. Nakazawa, S. Kumar, S. M. Srinivasula, V. Kumar, R. Weichselbaum, C. Nalin, E. S. Alnemri, D. Kufe and S. Kharbanda, EMBO J., 2000, 19, 4310–4322 CrossRef CAS.
- S. R. Kirchhoff, S. Gupta and A. A. Knowlton, Circulation, 2002, 105, 2899–2904 CrossRef CAS.
- S. Gupta and A. A. Knowlton, Circulation, 2002, 106, 2727–2733 CrossRef CAS.
- Q. Wang, L. An, Y. Chen and S. Yue, Chin. Med. J., 2002, 115, 1615–1619 Search PubMed.
- Q. Wang, Z. He, J. Zhang, Y. Wang, T. Wang, S. Tong, L. Wang, S. Wang and Y. Chen, Cancer Detect. Prev., 2005, 29, 544–551 Search PubMed.
- R. J. Amato, Expert Opin. Biol. Ther., 2007, 7, 1267–1273 Search PubMed.
- E. H. Postel, Int. J. Biochem. Cell Biol., 1998, 30, 1291–1295 CrossRef CAS.
- I. Lascu, J. Bioenerg. Biomembr., 2000, 32, 213–214 CAS.
- E. H. Postel, S. J. Berberich, J. W. Rooney and D. M. Kaetzel, J. Bioenerg. Biomembr., 2000, 32, 277–284 CrossRef CAS.
- P. S. Steeg, G. Bevilacqua, L. Kopper, U. P. Thogeirsson, J. E. T. madge, L. A. Liotta and M. E. Sobel, J. Natl. Cancer Inst., 1988, 80, 200–204 CrossRef CAS.
Footnote |
| † CCDC reference numbers 777767. For crystallographic data in CIF or other electronic format see DOI: 10.1039/c0mt00016g |
| This journal is © The Royal Society of Chemistry 2010 |