Identification and characterization of gadolinium(III) complexes in biological tissue extracts†
Chethaka L.
Kahakachchi
* and
Dennis A.
Moore
Covidien, Imaging Solutions, 675 McDonnell Blvd, Hazelwood, MO 63042, USA. E-mail: chethaka.kahakachchi@covidien.com
First published on 4th June 2010
Abstract
The gadolinium species present in a rat kidney following intravenous administration of a gadolinium-based magnetic resonance contrast agent (Optimark™, Gadoversetamide injection) to a rat was examined in the present study. The major gadolinium species in the supernatant of the rat kidney tissue extracts was determined by reversed-phase liquid chromatography with online inductively coupled plasma optical emission spectrometry (HPLC-ICP-OES). The identity of the compound was established by liquid chromatography electrospray ionization mass spectrometry (LC-ESI-MS) detection. The principal gadolinium(III) complex in a rat kidney tissue extract was identified as Gd-DTPA-BMEA 24 Hrs and 7 days after a single intravenous injection of Optimark™ (gadoversetamide; Gd-DTPA-BMEA) at a dose of 5 mmol Gd/kg body weight. The study demonstrated for the first time the feasibility of the use of two complementary techniques, HPLC-ICP-OES and HPLC-ESI-MS to study the in vivo behavior of gadolinium-based magnetic resonance contrast media.
Introduction
Gadolinium(III) complexes incorporating polyaminopolycarboxylic acids are commonly used as contrast agents in magnetic resonance imaging (MRI).1 In recent years a great deal of information on the properties of currently marketed magnetic resonance contrast media (MRCM) and their contrast enhancement ability have been published.2–4 Six of the gadolinium(III) complexes currently available for clinical studies are shown in Fig. 1.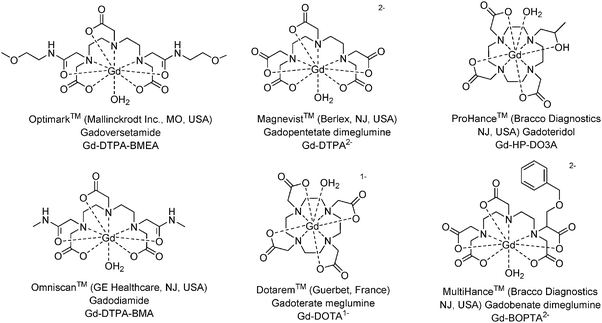 | ||
| Fig. 1 Structures, names and abbreviations of gadolinium(III) complexes.‡ | ||
Several in vivo studies have shown gadolinium deposition in various organs of animals5–8 and humans9,10 following intravenous administration of these MRCM. Though these studies describe the distribution of the gadolinium, in vivo, they have not determined the form of the gadolinium measured in the various tissues analyzed. Deposited gadolinium could be present in a variety of forms such as a phosphate salt or a complex with endogenous potential ligands such as proteins or carbohydrates. Indeed, the deposited gadolinium may be the sequestered form of the original complex present in the MRCM due to ultrastructural changes associated with vacuolization in the kidney.11,12 Recently several publications have suggested a potential association between gadolinium-based MRCM and nephrogenic systemic fibrosis (NSF), although the exact cause of NSF or mechanisms are yet to be established.13–16 At present NSF is considered as a serious late adverse reaction in patients with severe to terminal renal insufficiency.17 Since the mechanism by which some gadolinium-based MRCM might trigger NSF has not yet been elucidated several researchers have attempted to identify presence of gadolinium in tissue biopsies of patients with NSF. Thus, the biological fate of systemically distributed gadolinium could be of relevance to elucidate a potential link with NSF.
One major limitation with these studies and all others looking at the biodistribution of Gd in tissues is the difficulty of identifying the form of the Gd present. For example, scanning electron microscopy/energy dispersive X-ray spectroscopy (SEM/EDS) has been used for the identification and determination of deposits of Gd and co-precipitated elements in tissue biopsies of patients with NSF.18,19 However, this procedure detected only insoluble elements in the tissues and was reported that any water soluble forms of gadolinium may not be detected due to the sample preparation procedure used by the technique. Bussi et al. have reported the distributed gadolinium content of rat tissues after a single intravenous administration of 1 mmol kg−1 of MRCM (MultiHance, Omniscan and Gadovist), following sacrifice after 24 h post injection. The total gadolinium content after microwave digestion of tissues varied considerably with higher concentrations found in the kidneys, liver, spleen and bone.7 In several of these studies, including this study, researchers have determined the total gadolinium content present in the tissues examined as Gd3+ using inductively coupled plasma optical emission spectrometry (ICP-OES) or inductively coupled plasma mass spectrometry (ICP-MS), these techniques by themselves cannot reveal the form of the gadolinium measured.7–10,20,21 Radiochemical detection and quantification using radioactive 153Gd has also been used to observe the biodistribution of 153Gd-DTPA.6 A dual labeling study of 153Gd-DTPA and Gd-[14C]-DTPA in rats suggested that the gadolinium present in liver, spleen and bone was no longer associated with the original 14C-labeled ligand. Once again, the actual form of the gadolinium was not determined by this approach.22 Behra-Miellet et al. published a procedure for identifying gadolinium(III) complexes in blood samples to study the interaction of contrast agents with neutrophils in blood by HPLC-electro spray ionization mass spectrometry (ESI-MS) based on the gadolinium isotopic distribution.23
Since none of these techniques have been able to determine the form of the gadolinium species present in biological tissues after injection, the present study set out to determine if the form of gadolinium species present in biological tissue is that of the original complex found in the MRCM injected. This technique relies on analyzing tissue extracts allowing determination of the gadolinium(III) complex identity by observation of it's retention time on reversed-phase high-performance liquid chromatography. To enable the sensitive detection of the eluting gadolinium complex, this technique utilizes inductively coupled plasma optical emission spectrometry (HPLC-ICP-OES).24
The importance of the extraction technique employed must be noted. The technique must be one which does not alter the retained gadolinium species in tissues. But rather, merely releases it from the biological sample. There are only a limited number of procedures published for gadolinium(III) complex extraction from biological specimens. Tetramethylammonium hydroxide (TMAH) was used to extract Gd-DTPA2− from a patient's hair following intravenous administration of the corresponding MRCM (Magnevist). However, this resulted in partial decomposition of the complex introducing a potential source of error in the determination of Gd-DTPA2− present in the sample.25
This report presents for the first time the identification of the form of a gadolinium species present in rat kidney extracts following intravenous administration of a MRCM (Optimark™). The water extractable gadolinium species in the tissue extracts were determined by HPLC-ICP-OES and the identity confirmed by HPLC-ESI-MS. Furthermore, in this work the extraction potential of Gd-DTPA2−, Gd-DOTA1−, Gd-HP-DO3A, Gd-DTPA-BMA, Gd-DTPA-BMEA, Gd-BOPTA2− and free Gd3+ from spiked samples of bovine muscle tissue were investigated.
Experimental
Chemicals
Ammonium acetate of analytical reagent grade and acetonitrile of HPLC grade was purchased (Fisher Scientific, NJ, USA) for liquid chromatography separation. High purity 1000 mg L−1 gadolinium in 2% nitric solution; 1000 mg L−1 yttrium in 2% nitric solution (High Purity Standards, Charleston, SC, USA) and trace metal grade nitric acid (Fisher Scientific, NJ, USA) were obtained. All solutions were prepared in 18 MΩ de-ionized water (Millipore System, MA, USA).Instrumentation
A Varian inductively coupled plasma optical emission spectrometer, ICP-OES 720 ES Axial View (Varian Inc., CA, USA) was used as the detector for the HPLC-ICP-OES system. The sample introduction system contained a pneumatic concentric nebulizer and low volume glass cyclonic spray chamber. The ICP-OES operating conditions are shown in Table 1. The chromatographic system (all from Agilent Technologies, CA, USA) consisted of an Agilent 1100 series high performance liquid chromatographic system, equipped with an isocratic pump, a syringe-loading injector (Model 9725i, Rheodyne six-port injection valve) with a 50 μL sample loop and reversed phase columns for the retention and separation of the gadolinium(III) complexes (Table 1). The chromatographic system was interfaced with the ICP-OES instrument using a 25 cm × 0.25 mm id PEEK® (polyether ether ketone) capillary tubing (Upchurch Scientific, Oak Harbor, WA, USA) by connecting the column outlet to the inlet of the nebulizer. The ICP-OES detection system consisted of an echelle polychromator and a simultaneous CCD detector. The Vista software (version 1.1.2) was used to collect data using the transient real-time signal (TRS) mode (all from Varian Inc., CA, USA). The data collected was processed with PeakFit™ (version 4.12) software and chromatograms were plotted with Microsoft Excel software (Microsoft Corporation, WA, USA).| ICP-OES Parameters | |
| Forward power | 1.20 kW |
| Plasma flow | 15.0 L min−1 |
| Auxiliary flow | 1.5 L min−1 |
| Nebulizer flow | 0.80 L min−1 |
| Analysis wavelength | Gd 342.246 nm |
| Replicates | 1 |
| Dwell time | 1000 ms |
| Acquisition mode | TRS (Transient Real time Signal) |
| HPLC Parameters | |
| (A) Gd-DTPA-BMEA, Gd-DTPA2−and Gd-HP-DO3A | |
| Column | Waters XTerraTM 5 μm RP-C18 (4.6 × 250 mm) |
| Mobile phase | 10 mM ammonium acetate in water |
| (B) Gd-DTPA-BMA and Gd-DOTA1− | |
| Column | Phenomenex SynergiTM 4 μm RP-Hydro C-18 (4.6 × 250 mm) |
| Mobile phase | 10 mM ammonium acetate in water |
| (C) Gd-BOPTA2− | |
| Column | Thermo BDS HypersilTM 3 μm RP-C18 (4.6 × 50 mm) |
| Mobile phase | 10 mM ammonium acetate in water with 5% acetonitrile |
| Flow rate | 1 mL min−1 |
| Injection volume | 50 μL |
| Column temperature | Ambient |
An Agilent 6130 single quadrupole HPLC-MS equipped with an API-electrospray interface controlled by ChemStation software (version B.02) was used for data acquisition and processing. The ESI-MS was connected to an Agilent 1200 series High Performance Liquid Chromatographic system (all from Agilent Technologies, CA, USA), consisting of a G1322A degasser, a G1312A quaternary pump, a G1315B diode array detector, a G1316A column compartment, a G1313A autosampler and a variable injector (capable of injecting 1 to 100 μL volumes) for mass spectrometry analysis of the gadolinium(III) complexes. The mass spectrometer was operated in the full scan mode with positive ion polarity, with the following settings: mass range 120 to 1000 m/z, drying temperature 350 °C, nebulizer pressure 35 psi, drying gas flow 10 L min−1, fragmentor 70 and capillary potential 3000 V.
A CEM MARS Xpress closed vessel digestion system with 55 mL PFA vessels (all from CEM Corporation, NC, USA), a VirTis bench top 4.0 K ZL freeze dryer (SP Industries, NY, USA), LABQUAKE® shaker & rotator (Barnstead/Thermolyne, IA, USA), ultrasonic bath (Branson Ultrasonic Corp., CT, USA) and a Centrific® bench top centrifuge (Fisher Scientific, NJ, USA) were used for biological sample preparation.
Samples and standards
The 0.5 M gadolinium-based MRCM solutions studied: Optimark (Mallinckrodt Inc., MO, USA); Omniscan (GE Healthcare, NJ, USA); Magnevist (Berlex Laboratories, NJ, USA); ProHance (Bracco Diagnostics Inc., NJ, USA); MultiHance (Bracco Diagnostics Inc., NJ, USA) and Dotarem (Guerbet, France) were all obtained from their respective manufacturers.The standard reference material investigated for the MRCM spike study was NIST SRM 8414, Bovine Muscle Powder (National Institute of Standards and Technology, USA), a lyophilized powder with certified element content for major, minor and trace constituents.
The 1000 mg L−1 gadolinium certified standard was diluted appropriately to prepare calibration working standards for Gd (0.1 to 25 μg mL−1). Yttrium was used as an internal standard for the analysis. Individual working standard stock solutions of gadolinium(III) complexes were prepared by appropriately diluting the 0.5 M gadolinium-based MRCM solutions with de-ionized water in volumetric glassware for HPLC-ICP-OES analysis. For the bovine muscle powder spike recovery study 5 mM of the gadolinium(III) complexes were prepared by diluting 1 mL of the 0.5 M MRCM solution in 100 mL volumetric flasks with de-ionized water.
Procedures
Preparation of bovine muscle tissue spiked with MRCM and Gd3+
The NIST SRM 8414, bovine muscle powder (0.5 g) was accurately weighed into 15 mL centrifuge tubes. To each centrifuge tube 0.2 mL of the individual 5 mM MRCM solution was added and 10 mL of deionized water with continuous constant stirring. Similarly a bovine muscle powder sample spiked with 0.2 mL of 1000 mg L−1 gadolinium standard, Gd3+ as nitrate and a “reagent blank” bovine muscle powder was prepared. Next the samples were freeze dried for 48 Hrs and oven dried at 40 °C for 24 Hrs to remove any moisture. The theoretical Gd concentrations added to the bovine muscle powder were 157.25 μg for each MRCM and 200 μg for the Gd3+ as nitrate.In vivo studies
A total of six healthy male rats received a single intravenous injection of Optimark (gadoversetamide; Gd-DTPA-BMEA) at a dose of 5 mmol Gd/kg body weight and sacrificed after 24 Hrs (n = 3) and 7 days (n = 3) after injection. A separate group of six healthy male rats received only physiological saline (10 mL/kg) and were sacrificed after 24 Hrs (n = 3) and 7 days (n = 3) after injection. Depending on the treatment group the rats were euthanized 24 Hrs and 7 days post dose and the kidney tissues placed in labeled 15 mL centrifuge tubes. The kidney tissues were freeze dried for 48 Hrs. All animals were treated in compliance with guidelines set forth by the Association for Assessment and Accreditation of Laboratory Animal Care and the U.S. Department of Agriculture. The protocol was reviewed by the institutional animal care and use committee.Extraction of MRCM and Gd3+ from biological tissues
Spiked bovine muscle tissue—MRCM and Gd3+ spiked bovine muscle powder samples (0.1 g) were accurately weighed into 15 mL centrifuge tubes for the water extraction, 5 mL of de-ionized water was added and then sonicated for 60 min. The homogenate was then centrifuged at 1500 × g for 5 min at room temperature and the supernatant was recovered and used for total gadolinium determination by ICP-OES. The samples were diluted with water and filtered through a PTFE 0.45 μm filter (Phenomenex, CA, USA) prior to Gd speciation analysis by HPLC-ICP-OES.Rat kidney tissue—the freeze dried rat kidney tissue samples were placed in pyrex glass containers and mechanically crushed by grinding with a glass rod until a fine powder was obtained. The powdered rat kidney tissue samples (0.05 g) were accurately weighed into 15 mL centrifuge tubes for the water extraction, 3 mL of de-ionized water was added and then sonicated for 60 min. The homogenate was then centrifuged at 1500 × g for 5 min at room temperature and the supernatant was recovered and used for total gadolinium determination by ICP-OES. The samples were diluted with water and filtered through a PTFE 0.45 μm filter (Phenomenex, CA, USA) prior to Gd speciation analysis by HPLC-ICP-OES. The sample extracts were stored in the dark at 0–4 °C until analysis.
Determination of total gadolinium concentrations in biological tissues
Spiked bovine muscle tissue—for total gadolinium determination in the spiked bovine muscle powder, 0.1 g of the samples was placed in the microwave vessels with 2 mL of HNO3 acid and 1 mL of de-ionized water. The samples were subjected to microwave assisted acid digestion by operating the microwave at 1600 W (100% power) ramping to 180 °C over 15 min and then holding at 180 °C for 15 min. The clear solutions were transferred and made up to volume with de-ionized water in 10 mL volumetric flasks with Y3+ as an internal standard.Rat kidney tissue—for total gadolinium determination 0.05 to 0.1 g of the samples were accurately weighed into the microwave vessels with 2 mL of HNO3 acid and 1 mL of de-ionized water. The samples were subjected to microwave assisted acid digestion by operating the microwave at 1600 W (100% power) ramping to 180 °C over 15 min and then holding at 180 °C for 15 min. The clear solutions were transferred and made up to volume with de-ionized water in 5 mL volumetric flasks with Y3+ as an internal standard.
Results and discussion
Recovery of MRCM and Gd3+ content in the spiked bovine muscle tissue extracts
Due to the complex matrix of biological tissues and low gadolinium concentrations present there has been no studies reported for the individual gadolinium(III) complex extraction from tissues such as muscle, kidney and liver. Currently there are no standard reference materials available that allow such study for gadolinium. Therefore, the extraction ability of water to recover six gadolinium(III) complexes (Gd-DTPA2−, Gd-DOTA1−, Gd-HP-DO3A, Gd-DTPA-BMA, Gd-DTPA-BMEA and Gd-BOPTA2−) and free Gd3+ from spiked bovine muscle tissue was investigated. To determine the water extractable bioavailable gadolinium initial extraction studies were performed by placing samples in capped tubes and shaking vigorously for a few minutes and also placing samples on a rotator for 24 h at room temperature. The resulting homogenates were centrifuged at 1500 × g for 5 min at room temperature and the supernatant analyzed for total gadolinium by ICP-OES before and after filtration through a 0.45 μm filter.The total gadolinium concentrations of these samples after microwave assisted acid digestion of samples and after water extractions were measured by ICP-OES are given in Table 2. Microwave assisted acid digestion completely destroys the matrix allowing quantitative determination of total gadolinium content. A mild extraction would preserve the species of interest while allowing the identification of the form of the gadolinium species by HPLC. The spike recoveries for the six gadolinium(III) complexes and free Gd3+ after microwave digestion and total Gd determination were between 96 and 106%. The water extractable gadolinium accounted for about 48–70% of total gadolinium for the different gadolinium(III) complexes. However, only 5% gadolinium was water extractable as free Gd3+. The results for the MRCM and Gd3+ extraction from bovine muscle tissue are shown in Fig. 2. Additional extraction for 24 h on a rotator at room temperature did not improve the extraction efficiency. Filtration through a 0.45 μm filter also did not change the total gadolinium content in the supernatant. Extraction with a solvent like water should release free or loosely bound gadolinium species, however if the gadolinium species is present as a Gd3+ salt or tightly bound to proteins for example its release would be more difficult. The variations in extractability of the different MRCM under similar extraction conditions do not appear to be related to the charge of the complex and is not fully understood presently. Ultrasonic extractions with water and enzymes have been used to extract a variety of elements from biological samples.26,27 Further study of extraction conditions for Gd-DTPA-BMEA from spiked bovine muscle tissue using water and ultrasonic energy is needed to optimize the extraction procedure.
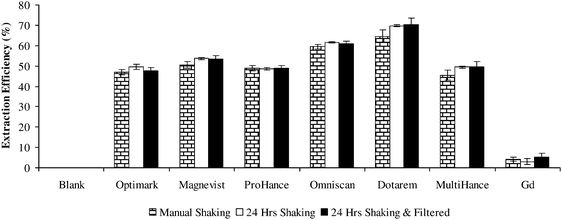 | ||
| Fig. 2 Gadolinium extraction from MRCM spiked bovine muscle powder using water as an extractant, % of water extractable gadolinium based on total gadolinium content after microwave assisted acid digestion; error bars ± S.D. (n = 3). | ||
| Spiked sample | Quantity of Gd added (μg) | Total Gd (μg g−1)a | % Recovery | ||
|---|---|---|---|---|---|
| Microwave digestion | Extraction | Microwave digestionc | Extractiond | ||
| a The total Gd content mean ± standard error (n = 3), where the μg g−1 results are based on dry tissue weight. b The limit of detection (LOD) was calculated to be 0.5 μg g−1. c % Recovery based on the theoretical total Gd concentration 314.5 μg g−1 spiked for the different MRCM and 400 μg g−1 for the spiked Gd3+. d % Recovery extraction = (total Gd from extraction)/(total Gd from microwave digestion) × 100. | |||||
| Blank | 0 | <LODb | <LODb | — | — |
| Optimark™ | 157.25 | 333.7 ± 14.5 | 149.5 ± 10.4 | 106 | 48 |
| Magnevist™ | 157.25 | 336.0 ± 2.3 | 169.7 ± 13.6 | 107 | 51 |
| ProHance™ | 157.25 | 320.3 ± 11.5 | 154.3 ± 1.4 | 102 | 48 |
| Omniscan™ | 157.25 | 304.0 ± 3.2 | 188.9 ± 8.3 | 97 | 62 |
| Dotarem™ | 157.25 | 302.1 ± 14.9 | 210.5 ± 24.1 | 96 | 70 |
| MultiHance™ | 157.25 | 310.3 ± 13.3 | 151.1 ± 18.2 | 99 | 49 |
| Gd3+ | 200 | 397.3 ± 8.3 | 19.2 ± 10.3 | 99 | 5 |
Optimization of ultrasonic water extraction procedure
Several factors affecting the extraction efficiency investigated include sample mass, solvent volume and sonication time for Gd-DTPA-BMEA extraction from spiked bovine muscle tissue. The total gadolinium content in the Gd-DTPA-BMEA spiked bovine muscle tissue extracts were determined by ICP-OES after various sonication times (0 to 105 min). Three replicates were analyzed for each sampling time point, the gadolinium content before sonication (0 min) was 95 μg g−1 and increased by 10–15% after 105 min of sonication (Fig. S1, ESI†). Therefore the biological tissue samples were sonicated for 60 min in conjunction with water extraction. After 60 min of sonication, the water extract contained ca. 100 μg g−1 of gadolinium, corresponding to approximately 40% extraction efficiency for the Gd-DTPA-BMEA spiked tissues. A solvent volume of 5 mL produced the highest extraction efficiency for 0.05 to 0.2 g when samples were sonicated for 60 min (Table S1, ESI†).Total gadolinium content in rat kidney tissues and mass balance study
The total gadolinium concentrations measured by ICP-OES in the microwave assisted acid digests of the rat kidney tissues after Optimark injection and saline injection are shown in Table 3. The gadolinium content in the saline group rats were below the detection limit of the method, which was about 0.5 μg g−1 based on dry weight of tissues. As expected, the total gadolinium concentrations determined in the rat kidney tissues 24 Hrs after Optimark injection were higher (1310–1884 μg g−1) than in the rat kidney tissues 7 days post injection (404–924 μg g−1). This is in agreement with previously reported data, where the highest gadolinium content was found in the rat kidney tissue 24 Hrs post-dosing of 1 mmol/kg MRCM (Omniscan, Gadovist and MultiHance) as a single intravenous dose.7 The total gadolinium concentration in the rat kidney tissues (Rat Kidney 9 and Rat Kidney 18) after microwave assisted acid digestion as well as the percentage amounts of gadolinium in the sonication extracts and residues (after microwave assisted digestion of freeze dried residue) are given in Table 4. Following water extraction in conjunction with sonication, approximately 80% of total gadolinium from the rat kidney tissues was extracted while approximately 20% remained in the residue showing good mass balance. The reason for the higher extraction efficiency for the Gd-DTPA-BMEA extraction from rat kidney tissues in comparison to Gd-DTPA-BMEA extraction from the spiked bovine muscle tissues may be due to the difference in tissue matrix and also the slight difference in sample handling procedure used for the spiked bovine muscle tissues, where the samples were stored at 40 °C for 24 Hrs.| Treatment | Time pointa | Sample | Gd content (μg g−1) | Average Gd content (μg g−1)b |
|---|---|---|---|---|
| a Post injection tissue collection time point. b Mean ± standard error (n = 3), where the μg g−1 results are based on dry tissue weight, the limit of detection (LOD) was calculated to be 0.5 μg g−1. | ||||
| 10.0 mL/kg saline injection | 24 Hrs | Rat Kidney 1 | <LOD | <LOD |
| Rat Kidney 5 | <LOD | |||
| Rat Kidney 8 | <LOD | |||
| 7 days | Rat Kidney 11 | <LOD | <LOD | |
| Rat Kidney 13 | <LOD | |||
| Rat Kidney 16 | <LOD | |||
| 5 mmol/kg Optimark injection | 24 Hrs | Rat Kidney 2 | 1884 | 1600 ± 166 |
| Rat Kidney 4 | 1605 | |||
| Rat Kidney 9 | 1310 | |||
| 7 days | Rat Kidney 10 | 687 | 673 ± 151 | |
| Rat Kidney 15 | 404 | |||
| Rat Kidney 18 | 927 |
| Rat Kidney 9 | Rat Kidney 18 | |
|---|---|---|
| a Mean ± standard error for Rat Kidney 9 (n = 2) and Rat Kidney 18 (n = 4) total Gd content, where the μg g−1 results are based on dry tissue weight. b Mean ± standard error (n = 3) for the % amounts in the water extracts, residues and sum. | ||
| Post injection tissue collection time point | 24 Hrs | 7 days |
| Total Gd content in tissue (μg g−1)a | 1351 ± 41 | 970 ± 31 |
| Extracted amount (%)b | 81 ± 5 | 77 ± 2 |
| Residual amount (%)b | 21 ± 2 | 30 ± 7 |
| Sum of extracted and residual amounts (%)b | 102 ± 5 | 107 ± 8 |
Identification of the gadolinium species in the extracts by HPLC-ICP-OES
A detailed description of the HPLC separation conditions and the HPLC columns used to analyze the gadolinium(III) complexes are published elsewhere.24 In Fig. 3A and B typical HPLC-ICP-OES chromatograms of the MRCM spiked bovine muscle tissue extracts are shown for Gd-DTPA-BMEA and Gd-HP-DO3A. In Fig. 4A the HPLC-ICP-OES chromatogram for the rat kidney 2 tissue extract after Optimark injection is shown. Chromatograms of 50 μM standard solutions for each MRCM prepared in water are also shown below each tissue extract chromatogram to authenticate the eluting peaks on HPLC-ICP-OES by standard retention times. A small unknown peak eluting at 3.8 min had similar retention time to the Gd-DTPA-Mono(methoxyethylamine)28 impurity which could not be detected by HPLC-ESI-MS. There was no evidence of gadolinium(III) complex modification during the water extraction based on the HPLC profiles of the analyzed supernatant solutions of the tissues.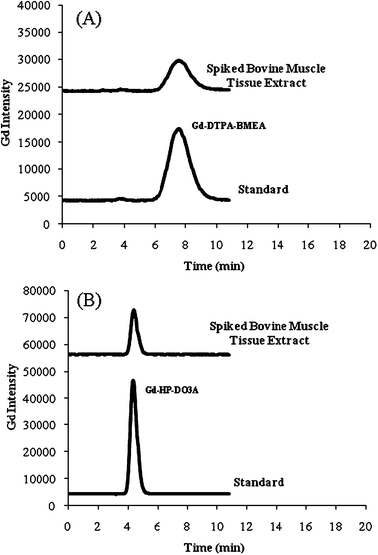 | ||
| Fig. 3 Typical HPLC-ICP-OES chromatograms for (A) spiked bovine muscle tissue water extracts and a Optimark standard and (B) spiked bovine muscle tissue water extract and a ProHance standard (seeTable 1for separation conditions). | ||
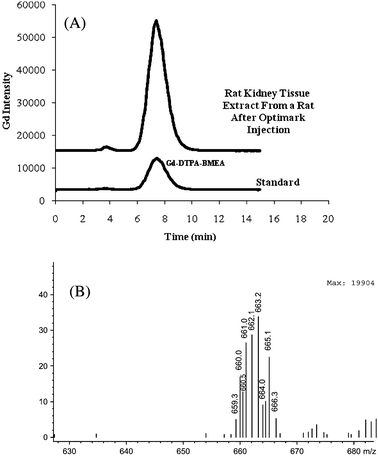 | ||
| Fig. 4 (A) HPLC-ICP-OES chromatogram from a rat kidney tissue (Rat Kidney 2) extract after a single intravenous injection of 5 mmol/kg Optimark injection and a Optimark standard (seeTable 1for separation conditions) (B) Mass spectra extracted at the retention time of the (A) peak. | ||
As shown in Fig. 5, similar gadolinium HPLC-ICP-OES elution profiles were obtained for the rat kidney tissue extracts (water extraction using sonication) 24 Hrs and 7 days post injection of Optimark. Retention times were matched with the Optimark standard HPLC retention time. In the water extracts of rat kidney tissue after Optimark injection, Gd-DTPA-BMEA appeared as the major gadolinium compound (Table 5). The Gd-DTPA-BMEA content in the water extracts were determined by external calibration of 0 to 500 μM of Gd-DTPA-BMEA using the peak area mode and linear regression analysis (correlation coefficients greater than 0.995 and %RSD for standards and samples less than 5%). The Gd-DTPA-BMEA content in the rat kidney tissues 24 Hrs after Optimark injection was higher than the Gd-DTPA-BMEA content present 7 days post injection, consistent with the total Gd results determined above. Again, approximately 80% of total gadolinium from the rat kidney tissues extracted was present as Gd-DTPA-BMEA. These results indicate that gadolinium in the rat kidney tissues is primarily present as the original gadolinium(III) complex and is consistent with vacuolization of the contrast agent in the kidney.29 Extraction and determination of gadolinium(III) complexes quantitatively from a wide range of rat tissue samples after different MRCM dosing regiments may provide valuable information for in vivo bio-distribution studies, therefore future studies will focus on further development of this analytical methodology for other tissues. For example, several recent studies have shown gadolinium retention in the skin of rats8,30 and in the skin of patients31 with NSF. Since these results are based on total gadolinium measurement alone to reveal the form of the gadolinium species it would be necessary to perform speciation studies using chromatographic separation and element specific detection methods such as HPLC-ICP-MS.
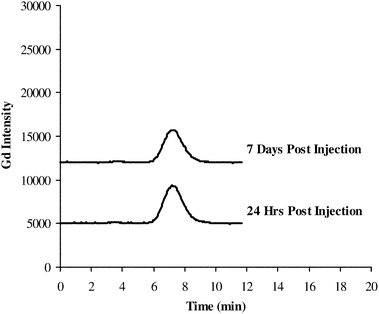 | ||
| Fig. 5 HPLC-ICP-OES chromatograms from rat kidney tissue extracts (Rat Kidney 9 and Rat Kidney 18) after a single intravenous injection of 5 mmol/kg Optimark injection (seeTable 1for separation conditions). | ||
| Sample I.D. | Time point | Total Gda (μg g−1) | Gd-DTPA-BMEAb | ||
|---|---|---|---|---|---|
| Peak area (%) | Conc. (μg g−1) | % Total Gdc | |||
| a Mean ± standard error for Rat Kidney 9 (n = 2) and Rat Kidney 18 (n = 4) total Gd content, where the μg g−1 results are based on dry tissue weight. b Mean ± standard error (n = 3), where the μg g−1 results are based on dry tissue weight. c The % total Gd in the extracts based on total Gd from microwave digestion. | |||||
| Rat Kidney 9 | 24 Hrs | 1351 ± 41 | >99 | 1163 ± 75 | 86 ± 6 |
| Rat Kidney 18 | 7 days | 970 ± 31 | >99 | 761 ± 10 | 78 ± 2 |
Identification of the gadolinium species in the extracts by HPLC-ESI-MS
The gadolinium(III) complexes identified above were further studied by molecular mass spectrometry for conclusive identification. The total ion chromatograms (TIC) of the extracts were complex with multiple peaks due to matrix effects; however selected ion monitoring (SIM) provides the gadolinium isotope pattern clearly and gave superior S/N ratios compared to the TIC. For the rat kidney tissue water extract the mass spectra obtained using the SIM mode is shown in Fig. 4B. The Gd-DTPA-BMEA has a molecular ion [M+H]+ at 663 and the gadolinium isotope pattern is observed for the peak detected by HPLC-ESI-MS.Conclusions
A simple extraction procedure has been developed to identify and characterize gadolinium species present in biological tissue extracts using reversed-phase liquid chromatography with ICP-OES detection. The combination of HPLC-ICP-OES and HPLC-ESI-MS is a powerful tool for the identification and characterization of the metal complexes in the tissue extracts. The presence of the intact gadolinium(III) complex in a rat kidney tissue has not been reported previously and we were able to detect the intact MRCM in the tissue extract after intravenous injection, sacrificing and excision from a rat. The method appears to be adaptable for the determination of gadolinium-based contrast agents which may be present in other tissues.Acknowledgements
The authors wish to acknowledge Jolette K. Wojdyla for providing tissue samples and also the reviewers whose input substantially improved the manuscript..References
- A. E. Merbach and E. Toth, The Chemistry of Contrast Agents in Medical Magnetic Resonance Imaging, John Wiley & Sons, Ltd., 2001 Search PubMed.
- P. Caravan, J. J. Ellison, T. J. McMurry and R. B. Lauffer, Chem. Rev., 1999, 99, 2293–2352 CrossRef CAS.
- Z. Zhang, S. A. Nair and T. J. McMurry, Curr. Med. Chem., 2005, 12, 751–778 CrossRef CAS.
- J. Idée, M. Port, I. Raynal, M. Schaefer, S. L. Greneur and C. Corot, Fundam. Clin. Pharmacol., 2006, 20, 563–576 CrossRef CAS.
- P. Wedeking, K. Kumar and M. F. Tweedle, Magn. Reson. Imaging, 1992, 10, 641–648 CrossRef CAS.
- M. F. Tweedle, P. Wedeking and K. Kumar, Invest. Radiol., 1995, 30, 372–380 CrossRef CAS.
- S. Bussi, X. Fouillet and A. Morisetti, Exp. Toxicol. Pathol., 2007, 58, 323–330 CrossRef CAS.
- H. Pietsch, P. Lengsfeld, G. Jost, T. Frenzel, J. Hutter and M. A. Sieber, Eur. Radiol., 2009, 19, 1417–1424 CrossRef.
- W. A. Gibby, K. A. Gibby and W. A. Gibby, Invest. Radiol., 2004, 39, 138–142 CrossRef.
- T. H. Darrah, J. J. Prutsman-Pfeiffer, R. J. Poreda, M. E. Campbell, P. V. Hauschka and R. E. Hannigan, Metallomics, 2009, 1, 479–488 RSC.
- P. Tervahartiala, L. Kivisaari, R. Kivisaari, I. Vertanen and C. S. Nordenstam, Invest. Radiol., 1991, 26, 882–887 CrossRef CAS.
- K. Andersen, E. I. Christensen and H. Vik, Invest. Radiol., 1994, 29, 955–962 CrossRef CAS.
- European Medicines Agency (EMEA), Public Assessment Report, London, U.K., June 26th, 2007.
- S. E. Cowper, H. S. Robin, S. M. Steinberg, L. D. Su, S. Gupta and P. E. LeBoit, Lancet, 2000, 356, 1000–1001 CrossRef CAS.
- T. Grobner, Nephrol., Dial., Transplant., 2006, 21, 1104–1108 CAS.
- P. Marckmann, L. Skov, K. Rossen, A. Dupont, M. B. Damholt, J. G. Heaf and H. S. Thomsen, J. Am. Soc. Nephrol., 2006, 17, 2359–2362 CrossRef.
- S. E. Cowper, L. D. Su, J. Bhawan, H. S. Robin and P. E. LeBoit, Am. J. Dermatopathol., 2001, 23, 383–393 CrossRef CAS.
- C. Thakral and J. L. Abraham, J. Electron Microsc., 2007, 56, 1–7 CrossRef.
- J. L. Abraham, C. Thakral, L. Skov, K. Rossen and P. Marckmann, Brit. J. Dermatol., 2008, 158, 273–280 CAS.
- E. M. S. Frame and E. E. Uzgirls, Analyst, 1998, 123, 675–679 RSC.
- T. N. Parac-Vogt, L. V. Elst, K. Kimpe, S. Laurent, C. Burtea, F. Chen, R. Van Deun, Y. C. Ni, R. N. Muller and K. Binnemans, Contrast Media Mol. Imaging, 2006, 1, 267–278 Search PubMed.
- T. Kasokat and K. Urich, Drug Res., 1992, 42, 869–876 Search PubMed.
- J. Behra-Miellet, G. Briand, M. Kouach, B. Gressier, M. Cazin and J. C. Cazin, Biomed. Chromatogr., 1998, 12, 21–26 CrossRef CAS.
- C. L. Kahakachchi and D. A. Moore, J. Anal. At. Spectrom., 2009, 24, 1389–1396 RSC.
- V. Loreti and J. Bettmer, Anal. Bioanal. Chem., 2004, 379, 1050–1054 CrossRef CAS.
- J. L. Capelo, P. Ximénez-Embún, Y. Madrid-Albarrán and C. Cámara, Anal. Chem., 2004, 76, 233–237 CrossRef CAS.
- S. Barton, C. Bullock and D. Weir, Enzyme Microb. Technol., 1996, 18, 190–194 CrossRef CAS.
- Unpublished result based on in-house reference standard.
- E. S. Harpur, D. Worah, P.-A. Hals, E. Holtz, K. Furuhama and H. Nomura, Invest. Radiol., 1993, 28(Supplement 1), S28–S43 CrossRef CAS.
- M. A. Sieber, H. Pietsch, J. Walter, W. Haider, T. Frenzel and H.-J. Weinmann, Invest. Radiol., 2008, 43, 65–75 CrossRef.
- A. Khurana, J. F. Greene and W. A. High, J. Am. Acad. Dermatol., 2008, 59, 218–224 CrossRef.
Footnotes |
| † Electronic supplementary information (ESI) available: Optimization of ultrasonic water extraction procedure for total gadolinium determination in Optimark™ spiked bovine muscle tissue. See DOI: 10.1039/b915806e. |
| ‡ Trademarks are the property of their respective owners. |
| This journal is © The Royal Society of Chemistry 2010 |