Photografted poly(methyl methacrylate)-based high performance protein microarray for hepatitis B virus biomarker detection in human serum†
Yingshuai
Liu
,
Weihua
Hu
,
Zhisong
Lu
and
Chang Ming
Li
*
School of Chemical & Biomedical Engineering, Center for Advanced Bionanosystems, Nanyang Technological University, 70 Nanyang Drive, Singapore. E-mail: ecmli@ntu.edu.sg; Fax: +65-67911761; Tel: +65-67904485
First published on 6th May 2010
Abstract
A robust and efficient strategy is investigated to functionalize poly(methyl methacrylate) as a superior substrate for high performance protein microarrays and utilized for sensitive detection of hepatitis B virus biomarker in human serum, demonstrating its great potential applications in proteomics and clinic diagnosis.
Protein microarrays have emerged as a powerful and promising proteomic tool due to their high-throughput, good reliability and small sample consumption. Following the success of DNA microarrays in genomics, protein microarrays have demonstrated a great potential in proteomics, especially in medicinal chemistry such as pharmaceutical and clinical applications, where protein microarrays have been employed to investigate protein expression profiling,1–3 interaction between protein and other biomolecules,4–6 drug discovery7 and clinical diagnosis.8–12 Herein, a novel polymer based high performance protein microarray is developed and used to detect hepatitis B virus surface antigen.
Protein microarrays are generally fabricated on a glass4,13 or silicon14,15 surface. Alternatively, polymeric materials such as polyethylene terephthalate (PET),16 poly(methyl methacrylate) (PMMA),17–20 polydimethylsiloxane (PDMS),21,22 polycarbonate,23 and epoxy resin24 have been utilized as good substrates for DNA/protein microarrays and microfluidic biochips. The particular advantages of these synthetic polymers are their low cost, easy process for mass production and the possibility to integrate microelectronics technology onto the surface of array chips.17,19,25 For developing a fluorescence-based protein microarray, PMMA has many additional merits including low intrinsic fluorescence (ESI Fig. S1), transparency and easy modification. Although several approaches are available to modify the PMMA surface for protein detection, they either yielded a low surface density of functional groups or involved unstable intermediates such as Schiff's base.17
In this work, an efficient surface modification strategy was investigated to functionalize PMMA as a substrate for a high performance protein microarray. Glycidyl methacrylate (GMA) with both acrylate and epoxy groups was used as a monomer for photopolymerization. The former was employed as an active site for polymerization in the presence of photoinitiator under UV irradiation, and the latter served as an anchor for covalent immobilization of proteins via secondary amine bond formation between epoxy and amino group of proteins. The amine linkage is more stable and no chemical reduction was required over aldehyde mediated protein attachment. The photografting is carried out on PMMA step-by-step via the procedure shown in Scheme 1. Through photopolymerization, a layer of GMA polymer “brushes” was produced on the PMMA surface, resulting in abundant of functional groups (epoxy) for efficient protein immobilization.
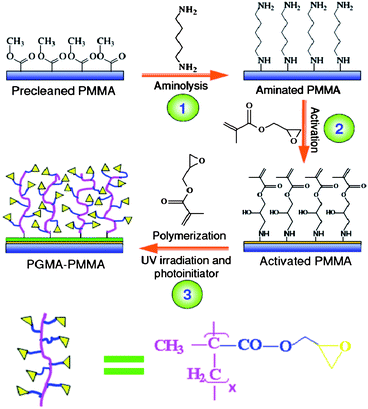 | ||
| Scheme 1 Preparation of PGMA–PMMA substrate. The dimension in the scheme is not drawn to scale. | ||
The surface morphology of poly(GMA) photografted PMMA (PGMA–PMMA) was examined by atomic force microscopy (AFM). Fig. 1A shows that the pristine PMMA exhibits a flat and featureless surface morphology, of which the root-mean-square roughness (Rq) is 3.2 ± 1.2 nm. After amination treatment, there is no significant change in surface morphology (Rq 2.5 ± 0.5 nm). The PGMA–PMMA surface (Fig. 1C), however, illustrates a drastic morphology change as compared to that of pristine and aminated PMMA, with a sharply increased Rq of 20.5 ± 1.6 nm. The results indicate that GMA photopolymers are successfully grafted, producing a homogeneous and nanostructured 3-D like functional layer on the PMMA surface. For comparison, surface topography of glutaraldehyde–PMMA (GA–PMMA) and (3-glycidyloxypropyl)trimethoxysilane–glass slide (GPTMS–glass) functionalized by the commonly used aldehyde activation and silanization methods respectively are characterized by AFM. As shown in Fig. 1D & E, GA–PMMA is quite smooth with Rq 1.7 ± 0.10 nm and GPTMS–glass is featured by small dots with Rq 3.8 ± 0.16 nm. Apparently, the obtained 3-D roughened surface can provide a larger specific surface area to improve the protein binding capacity15 as compared with GA–PMMA and GPTMS–glass. In addition, the polymer brushes can reduce steric hindrance during antibody–antigen reaction due to the flexible polymer chains. Thus the epoxy-based random immobilization can be reduced to a certain extent.
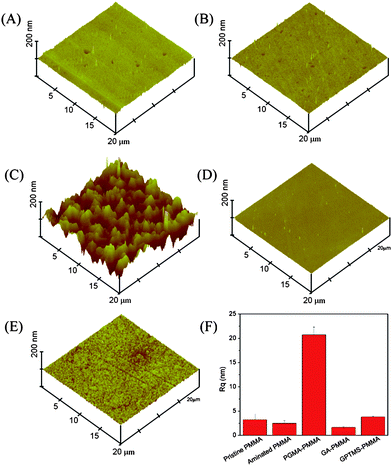 | ||
| Fig. 1 AFM topographic images (20 μm × 20 μm). (A) Pristine PMMA; (B) aminated-PMMA; (C) PGMA–PMMA; (D) GA–PMMA; (E) GPTMS–glass; (F) roughness comparison of each surface. | ||
Attenuated total reflectance Fourier transform infra-red (ATR-FTIR) spectroscopy was employed to characterize the functional groups on pristine and grafted PMMA. The typical IR spectrum of pristine PMMA with the characteristic peaks below 2000 cm−1 is shown in Fig. 2 (dotted line). The peak at 1720 cm−1 could be assigned to C![[double bond, length as m-dash]](https://www.rsc.org/images/entities/char_e001.gif) O stretching of the esters. The absorption bands at 1271, 1240 cm−1 and 1189, 1141 cm−1 could be assigned to C–O and C–O–C stretching, respectively. Because the GMA photopolymer has a similar molecular structure to PMMA, most of the characteristic peaks discussed above also appear in the spectrum of PGMA–PMMA. It can be clearly seen that a new and distinct absorption peak at 908 cm−1 appears in the spectrum of PGMA–PMMA (solid line), which could be assigned to the epoxy group stretching. However, there is no noticeable absorption peak at the same wavenumber for the pristine PMMA (dotted line). The results confirm that the GMA photopolymer is successfully grafted. In addition, the introduced epoxy groups on the PMMA surface via the photografting process can provide high protein loading capacity through covalent probe immobilization, which is one of the most important factors for high performance protein microarray.15
O stretching of the esters. The absorption bands at 1271, 1240 cm−1 and 1189, 1141 cm−1 could be assigned to C–O and C–O–C stretching, respectively. Because the GMA photopolymer has a similar molecular structure to PMMA, most of the characteristic peaks discussed above also appear in the spectrum of PGMA–PMMA. It can be clearly seen that a new and distinct absorption peak at 908 cm−1 appears in the spectrum of PGMA–PMMA (solid line), which could be assigned to the epoxy group stretching. However, there is no noticeable absorption peak at the same wavenumber for the pristine PMMA (dotted line). The results confirm that the GMA photopolymer is successfully grafted. In addition, the introduced epoxy groups on the PMMA surface via the photografting process can provide high protein loading capacity through covalent probe immobilization, which is one of the most important factors for high performance protein microarray.15
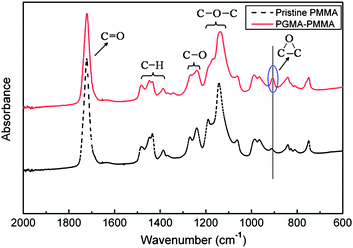 | ||
| Fig. 2 ATR-FTIR spectra of pristine PMMA (dotted line) and PGMA–PMMA (solid line). | ||
Protein binding characteristics of PGMA–PMMA were investigated by printing Alexa Fluor 546 conjugated IgG to evaluate its potential as a substrate for high performance protein microarrays. Simultaneously, the same investigation was carried out on GA–PMMA and GPTMS–glass. As shown in Fig. 3, the fluorescence intensity on PGMA–PMMA is significantly higher than that on GA–PMMA functionalized by the conventional method17,18 (P < 0.01) and on GPTMS–glass modified by the silanization strategy26 (P < 0.01). Two times and 20% improvement are achieved respectively, demonstrating a good protein binding capacity. As discussed above, the high protein binding capacity should be attributed to the large specific surface area with introduced functional groups provided by PGMA–PMMA.27
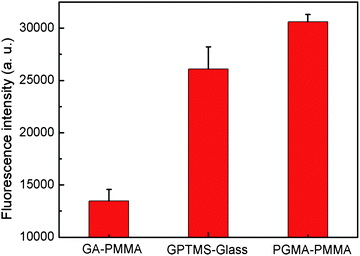 | ||
| Fig. 3 Fluorescence intensity as a function of protein binding on GA–PMMA, GPTMS–glass and PGMA–PMMA surface. | ||
To obtain best performance of the microarray, printing buffer, protein immobilization kinetics and concentration of the capture antibody are optimized systematically using fluorescent dye labelled IgG as model protein (ESI, Fig. S1, S2, S3). The optimal printing buffer and efficient concentration of capture antibody are determined to be 0.01M PBS with 2.5% glycerol + 0.003% triton X-100 and 250 μg mL−1, respectively. The optimization of capture antibody concentration is essential for both cost considerations and minimizing over-reaction between epoxy and amine group. 6–8 h is also obtained as the optimal reaction time for efficient protein immobilization.
Hepatitis viruses cause a very serious public health problem all over the world. Hepatitis B virus (HBV) and hepatitis C virus (HCV) are the two main types of hepatitis virus, which often cause persistent infection, resulting in chronic liver diseases, cirrhosis and hepatocellular carcinoma.28 For clinical diagnosis of hepatitis virus infection, the protein products (antigens) of viruses are the primary diagnostic biomarkers in the screening of potential patient blood.29 To demonstrate the high performance of PGMA–PMMA based protein microarray, sandwich immunoassay is carried out with hepatitis B surface antigen (HBsAg) as a model target.
As shown in Fig. 4A, the double logarithmic plot of fluorescence intensity as a function of HBsAg concentration was obtained. According to the typical sigmoid dose–response curve, the dynamic range for HBsAg detection on PGMA–PMMA is from 10 pg mL−1 to 1 μg mL−1 (k = 0.452). The limit of detection (LOD) is determined to be 10 pg mL−1 by three SDs.30 In comparison to LODs of 1 ng mL−1 and 100 pg mL−1 achieved with GA–PMMA and GPTMS–glass based microarrays, respectively, (Fig. 4B & C) the PGMA–PMMA microarray is one and 2 order higher than the prior arts.
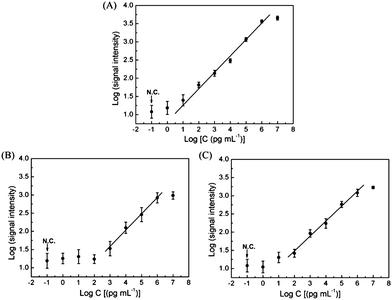 | ||
| Fig. 4 Dose–response curves of HBsAg detection in PBS with protein microarrays on PGMA–PMMA (A), GA–PMMA (B) and GPTMS–glass (C). | ||
In order to further demonstrate the potential diagnostic applications, HBsAg was detected in diluted human serum by a PGMA–PMMA based protein microarray. It is shown in Fig. 5 that the dynamic range covers five orders of magnitude in the range between 10 pg mL−1 to 1 μg mL−1 (R2 = 0.980), and LOD is determined to be 10 pg mL−1. As compared with the results obtained in PBS, the same LOD and dynamic range are achieved in the complex biological samples, while the sensitivity reflected by the slope of the linear range in the dose–response curve shows a slightly decrease (k = 0.398), demonstrating its great feasibility for clinical diagnosis. The LOD of the known and commercially available enzyme immunoassays and/or chemiluminescent immunoassays for clinical analysis of HBsAg is around 0.2–1 ng ml−1.31 Clearly, the present method offers much higher sensitivity. The microarray format can also render prominent advantages of high throughput, small sample and reagent consumption and reduced assay time in clinic diagnostics.
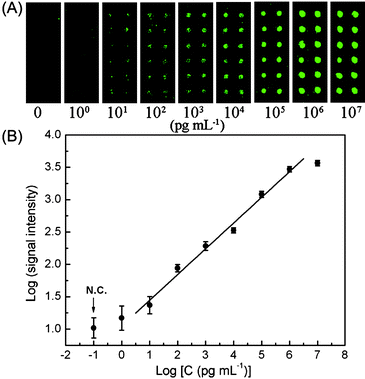 | ||
| Fig. 5 Microarray sandwich immunoassay on PGMA–PMMA for HBsAg detection in human serum. (A) Fluorescence images of protein microarrays exposed to different concentrations of HBsAg; (B) dose–response curve of HBsAg detection in human serum. | ||
In summary, a unique and efficient strategy with grafted GMA photopolymer brushes on PMMA was investigated to significantly improve the performance of protein microarrays. The low detection limit and wide dynamic range of the new protein array for HBsAg detection in 10% human serum demonstrate its great potential in clinical diagnosis. The high performance of the microarray is ascribed to the high specific surface area and introduced functional groups from the grafted GMA photopolymer brushes for highly efficient immobilization of the probe proteins.
Acknowledgements
This work is financially supported by Center for Advanced Bionanosystems, Nanyang Technological University.Notes and references
- A. Sreekumar, M. K. Nyati, S. Varambally, T. R. Barrette, D. Ghosh, T. S. Lawrence and A. M. Chinnaiyan, Cancer Res., 2001, 61, 7585 CAS.
- Y. Lin, R. C. Huang, L. P. Chen, H. Lisoukov, Z. H. Lu, S. Y. Li, C. C. Wang and R. P. Huang, Proteomics, 2003, 3, 1750 CrossRef CAS.
- Y. W. Li, R. J. Schutte, A. Abu-Shakra and W. M. Reichert, Biomaterials, 2005, 26, 1081 CrossRef CAS.
- G. MacBeath and S. L. Schreiber, Science, 2000, 289, 1760 CAS.
- Y. Sasakura, K. Kanda, T. Yoshimura-Suzuki, T. Matsui, S. Fukuzono, M. H. Han and T. Shimizu, Anal. Chem., 2004, 76, 6521 CrossRef CAS.
- H. Ge, Nucleic Acids Res., 2000, 28, 3e CrossRef.
- P. F. Predki, Functional protein microarrays in drug discovery, Taylor & Francis group, Boca Raton, 2007 Search PubMed.
- P. Pavlickova, N. M. Lensen, H. Paul, M. Schaeferling, C. Giammasi, M. Kruschina, W. D. Du, M. Theisen, M. Ibba, F. Ortigao and D. Kambhampati, J. Proteome Res., 2002, 1, 227 CrossRef CAS.
- J. S. Cannon, D. Mattoon, B. Love, G. Michaud, P. Predki, G. Ritter, R. Halaban and D. Patel, Mol. Cell. Proteomics, 2006, 5, S280.
- A. Tannapfel, K. Anhalt, P. Hausermann, F. Sommerer, M. Benicke, D. Uhlmann, H. Witzigmann, J. Hauss and C. Wittekind, J. Pathol., 2003, 201, 238 CrossRef CAS.
- A. Ressine, I. Corin, K. Jaras, G. Guanti, C. Simone, G. Marko-Varga and T. Laurell, Electrophoresis, 2007, 28, 4407 CrossRef CAS.
- U. Weissenstein, M. J. Schneider, M. Pawlak, J. Cicenas, S. Eppenberger-Castori, P. Oroszlan, S. Ehret, A. Geurts-Moespot, F. Sweep and U. Eppenberger, Proteomics, 2006, 6, 1427 CrossRef CAS.
- Y. S. Liu, C. M. Li, L. Yu and P. Chen, Front. Biosci., 2007, 12, 3768 CrossRef CAS.
- A. Ressine, S. Ekstrom, G. Marko-Varga and T. Laurell, Anal. Chem., 2003, 75, 6968 CrossRef CAS.
- A. J. Nijdam, M. M. C. Cheng, D. H. Geho, R. Fedele, P. Herrmann, K. Killian, V. Espina, E. F. Petricoin, L. A. Liotta and M. Ferrari, Biomaterials, 2007, 28, 550 CrossRef CAS.
- Y. S. Liu, C. M. Li, W. H. Hu and Z. S. Lu, Talanta, 2009, 77, 1165 CrossRef CAS.
- Y. L. Bai, C. G. Koh, M. Boreman, Y. J. Juang, I. C. Tang, L. J. Lee and S. T. Yang, Langmuir, 2006, 22, 9458 CrossRef CAS.
- F. Fixe, M. Dufva, P. Telleman and C. B. V. Christensen, Nucleic Acids Res., 2004, 32 Search PubMed.
- F. Fixe, M. Dufva, P. Telleman and C. B. V. Christensen, Lab Chip, 2004, 4, 191 RSC.
- E. Waddell, Y. Wang, W. Stryjewski, S. McWhorter, A. C. Henry, D. Evans, R. L. McCarley and S. A. Soper, Anal. Chem., 2000, 72, 5907 CrossRef CAS.
- L. Yu, C. M. Li, Y. S. Liu, J. Gao, W. Wang and Y. Gan, Lab Chip, 2009, 9, 1243 RSC.
- L. Yu, C. M. Li, Q. Zhou and J. H. T. Luong, Bioconjugate Chem., 2007, 18, 281 CrossRef CAS.
- Y. C. Li, Z. Wang, L. M. L. Ou and H. Z. Yu, Anal. Chem., 2007, 79, 426 CrossRef CAS.
- L. Yu, Y. S. Liu, Y. Gan and C. M. Li, Biosens. Bioelectron., 2009, 24, 2997 CrossRef CAS.
- H. Dong, C. M. Li, Y. F. Zhang, X. D. Cao and Y. Gan, Lab Chip, 2007, 7, 1752 RSC.
- W. Kusnezow, A. Jacob, A. Walijew, F. Diehl and J. D. Hoheisel, Proteomics, 2003, 3, 254 CrossRef CAS.
- C. A. Marquette, M. Cretich, L. J. Blum and M. Chiari, Talanta, 2007, 71, 1312 CrossRef CAS.
- L. L. Duan, Y. F. Wang, S. S. C. Li, Z. X. Wan and J. X. Zhai, BMC Infect. Dis., 2005, 5 Search PubMed.
- O. E. Tsitsilonis, A. Thrasyvoulides, A. Balafas, J. F. Voutsas, M. Papamichail and P. Lymberi, J. Pharm. Biomed. Anal., 2004, 34, 811 CrossRef CAS.
- X. C. Zhou and J. Z. Zhou, Proteomics, 2006, 6, 1415 CrossRef CAS.
- M. Deguchi, N. Yamashita, M. Kagita, S. Asari, Y. Iwatani, T. Tsuchida, K. Iinuma and I. K. Mushahwar, J. Virol. Methods, 2004, 115, 217 CrossRef CAS.
Footnote |
| † Electronic supplementary information (ESI) available: Substrate preparation, microarray fabrication, and optimization of printing buffer, immobilization time and capture antibody concentration. See DOI: 10.1039/c0md00032a |
| This journal is © The Royal Society of Chemistry 2010 |
