The unintended energy impacts of increased nitrate contamination from biofuels production
Kelly M.
Twomey
*a,
Ashlynn S.
Stillwell
b and
Michael E.
Webber
c
aDepartment of Mechanical Engineering, The University of Texas at Austin, Austin, Texas 78712, USA. E-mail: kmt@mail.utexas.edu; Fax: +1 512 471 1045
bDepartment of Civil, Architectural, and Environmental Engineering, The University of Texas at Austin, Austin, Texas 78712, USA. E-mail: ashlynn.stillwell@mail.utexas.edu; Fax: +1 512 471 5870
cDepartment of Mechanical Engineering, The University of Texas at Austin, Austin, Texas 78712, USA. E-mail: webber@mail.utexas.edu; Fax: +1 512 471 1045; Tel: +1 512 475 6867
First published on 20th October 2009
Abstract
Increases in corn cultivation for biofuels production, due to the Energy Independence and Security Act of 2007, are likely to lead to increases in nitrate concentrations in both surface and groundwater resources in the United States. These increases might trigger the requirement for additional energy consumption for water treatment to remove the nitrates. While these increasing concentrations of nitrate might pose a human health concern, most water resources were found to be within current maximum contaminant level (MCL) limits of 10 mg L−1 NO3-N. When water resources exceed this MCL, energy-intensive drinking water treatment is required to reduce nitrate levels below 10 mg L−1. Based on prior estimates of water supplies currently exceeding the nitrate MCL, we calculate that advanced drinking water treatment might require an additional 2360 million kWh annually (for nitrate affected areas only)—a 2100% increase in energy requirements for water treatment in those same areas—to mitigate nitrate contamination and meet the MCL requirement. We predict that projected increases in nitrate contamination in water may impact the energy consumed in the water treatment sector, because of the convergence of several related trends: (1) increasing cornstarch-based ethanol production, (2) increasing nutrient loading in surface water and groundwater resources as a consequence of increased corn-based ethanol production, (3) additional drinking water sources that exceed the MCL for nitrate, and (4) potentially more stringent drinking water standards for nitrate.. Based on prior estimates of water supplies currently exceeding the nitrate MCL, we calculate that advanced drinking water treatment might require an additional 2360 million kWh annually (for nitrate affected areas only)—a 2100% increase in energy requirements for water treatment in those same areas—to mitigate nitrate contamination and meet the MCL requirement. We predict that projected increases in nitrate contamination in water may impact the energy consumed in the water treatment sector, because of the convergence of several related trends: (1) increasing cornstarch-based ethanol production, (2) increasing nutrient loading in surface water and groundwater resources as a consequence of increased corn-based ethanol production, (3) additional drinking water sources that exceed the MCL for nitrate, and (4) potentially more stringent drinking water standards for nitrate.
Environmental impactThe Energy Independence and Security Act, which promotes the expansion of cornstarch-based ethanol production, is likely to degrade water quality due to runoff and subsequent leaching into nearby surface and groundwater sources of nitrogen fertilizers. This paper analyzes the potentially significant impact that anticipated increases in contamination as a result of increased corn production might have on the amount of energy required to treat polluted water sources to safe and acceptable levels for drinking water consumption. It concludes that this legislative act, designed to make the United States’ energy system more resilient, could trigger an increase in the energy consumed by the water treatment sector in order to clean up the additional pollution. |
Introduction
Recent concerns over rising fuel prices, national security, and greenhouse gas (GHG) emissions have resulted in the implementation of a nationwide Renewable Fuel Standard (RFS). The RFS has raised water quality and environmental concerns due to projected increases in the application of nitrogen-based fertilizer that might be necessary to meet future demands for agricultural feedstocks.1,2 This RFS, defined within the Energy Independence and Security Act (EISA) of 2007, incrementally increases the volume of renewable fuel required to be blended into gasoline from 9 billion gallons in 2008 to 36 billion gallons in 2022, up to 15 billion gallons of which can come from traditional first-generation biofuels sources such as cornstarch-based ethanol.3Although biofuels can advantageously reduce GHG emissions, utilize agriculture surpluses and waste products, and decrease the nation's dependence on foreign oil,4 the production of cornstarch-based ethanol has water quantity and quality consequences. While the issues related to the quantity of water required for biofuels production have been studied,5,6 and the water quality consequences due to increases in runoff and soil erosion from agricultural land have been identified,1,4,7,8 to the authors' knowledge, this is the first analysis of the energy impacts that these water quality effects will have due to the requirements for increased water treatment steps.
Background
Water quality concerns are triggered by biofuels-originated agricultural runoff, potentially laden with nitrogen and phosphorus contaminants, which can leach into surface water and groundwater and consequently degrade water bodies downstream.1,4,7,8 Since corn and other crops are unable to use organic nitrogen from fertilizer directly, they convert it to nitrate, an inorganic, plant-available form of nitrogen that is released as organic matter decomposes. Corn can only use 40–60% of the nitrate that is delivered to its roots; the rest is subject to leaching through soil to downstream water bodies by means of infiltrating water.4 Often farmers will apply excessive amounts of fertilizer to their fields, exacerbating nitrate leaching, as using too little nitrogen fertilizer will lower crop yield, but using too much will have little, if any, detrimental impact to yields.9Fig. 1a was adapted from a publication10 released by the United States Department of Agriculture and Economic Research Service, which indicates that the majority of corn acreage and ethanol processing facilities in the United States are located in the Corn Belt region. Similarly, Fig. 1b, which was adapted from a report released by the United States Geological Survey (USGS),11 indicates that shallow aquifers (less than 5 m deep) at high risk for nitrate contamination are also concentrated in this region. These risk classifications were assigned based on regional levels of nitrogen input and an aquifer's “vulnerability” to nitrate contamination. “Nitrogen input” was assigned based on agricultural land coverage and/or the application of fertilizers, as well as background nitrate concentrations in groundwater sources.12 “Aquifer vulnerability” was assigned based on soil drainage characteristics and the ratio of woodland acres to cropland acres, since these factors largely influence the rate at which nitrate percolates through soil.12
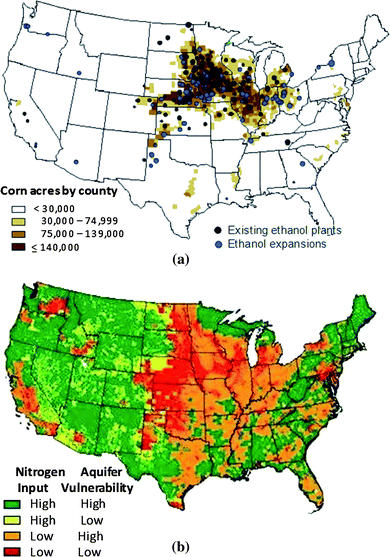 | ||
| Fig. 1 (a) The majority of corn cultivation and ethanol production is located in the Corn Belt Region,10 and (b) regions of high nitrogen input and high vulnerability are concentrated in the Corn Belt region.11 | ||
In addition to the environmental repercussions of increased nutrient loading, rising concentrations of nitrate in drinking water sources are a public health concern. The United States Environmental Protection Agency (EPA) originally adopted a maximum contaminant level (MCL) of 10 mg L−1 of nitrate-nitrogen (NO3-N) for drinking water in order to protect infants from the acute condition, methemoglobinemia, more commonly known as “blue baby syndrome.”13 This potentially fatal condition occurs when infants cannot adequately convert nitrate to nitrite, compromising the oxygen carrying capacity of their blood.13 The formation of N-nitroso compounds, as a result of nitrate digestion, has also been linked to the formation of cancerous tumors in the esophagus, stomach, colon, bladder, lymphatic, and hematopoietic system of animals; this causal link has not yet been confirmed in humans.13 Because of these health concerns, the risk of increased nitrate contamination from ramped-up biofuels production is worthy of attention. Because of these health concerns, the risk of increased nitrate contamination from ramped-up biofuels production is worthy of attention.
Several analyses have attempted to project changes in land use that may accompany the future expansion of cornstarch-based ethanol and the resulting increase in nutrient loading to downstream water bodies. Donner and Kucharik estimate that the increase in corn production necessary to meet the quantity of cornstarch-based ethanol prescribed by EISA 2007 will result in an annual increase in the average flux of dissolved inorganic nitrogen export to the Mississippi-Atchafalaya River Basin by 10–34% by the year 2022.1 An earlier analysis by Simpson et al. projected that ethanol expansion will result in a 37% increase in nitrogen loading in water nationally.4 Han et al. developed a model to predict nitrate loading to the Lake Michigan basin due to increases in anthropogenic N from agricultural and biofuels production, as well as potential climate change impacts.14 They projected riverine N exports as high as 24% based on projected cornstarch-based ethanol projections to 2017, consistent with the abovementioned analyses.14
One aspect that has not been evaluated in past analyses is the effect that increased nutrient loading will have in terms of the energy required to treat degraded surface water and groundwater downstream of agricultural land to acceptable EPA drinking water standards. This analysis seeks to determine that unintended energy impact. Currently, the majority of the nation's public surface and groundwater sources have nitrate concentrations that fall below the EPA's MCL for NO3-N of 10 mg L−1 and, therefore, do not require energy-intensive water treatment processes to remove the contaminant.15 Depending on the severity of corn ethanol expansion and the ways by which agricultural practices are managed, more water sources may require energy-intensive nitrate removal processes in the future to meet safety regulations. Depending on the severity of corn ethanol expansion and the ways by which agricultural practices are managed, more water sources may require energy-intensive nitrate removal processes in the future to meet safety regulations.
This analysis assesses how the projected increase in corn-based ethanol production might impact the energy required for surface water and groundwater treatment in the United States as a result of EISA 2007. For the purpose of this analysis we will only consider the energy costs due to the change in nitrogen loading, specifically in the form of nitrate. Other water quality consequences such as sediment and phosphorus loading are also associated with the expansion of ethanol production and should be considered in future analyses.
Methodology
The purpose of this analysis was to provide a snapshot of the current contamination level of the public water supply in the United States from nitrate loading and then to calculate the amount of energy that would be necessary to treat the current volume of contaminated water with advanced treatment processes to meet the acceptable drinking water standard of 10 mg L−1 NO3-N. This amount of energy was compared to the amount of energy that is necessary to treat the same volume of water with average surface water treatment. The percent increase from the energy consumed in the baseline treatment scenario to the energy consumed in the advanced treatment scenario was calculated. Based on this estimate, we predict how projected increases in nitrate contamination in water, due to the expansion of cornstarch-based ethanol, may impact the energy consumed in the water treatment sector.-N. This amount of energy was compared to the amount of energy that is necessary to treat the same volume of water with average surface water treatment. The percent increase from the energy consumed in the baseline treatment scenario to the energy consumed in the advanced treatment scenario was calculated. Based on this estimate, we predict how projected increases in nitrate contamination in water, due to the expansion of cornstarch-based ethanol, may impact the energy consumed in the water treatment sector.First, the volume of contaminated water distributed by public drinking water suppliers in the United States was estimated based on data from the Environmental Working Group's National Tap Water Quality Database, which quantifies the number of people who were supplied water that exceeded acceptable levels of nitrate between the years of 1998 and 2003.16 This analysis assumes that every public water supplier that reported at least one instance of nitrate contamination over the EPA's MCL in this 5 year period would use an advanced treatment process to remove nitrate contamination in the future. This assumption was made on the basis that public water suppliers only report an average of 1.0 nitrate tests per year,16 so without more frequent testing, one violation is considered to be indicative that the water supply may be of public health concern.
Based on these data, the total volume of contaminated water distributed to this population was calculated assuming an average daily water usage of 140 gallons per person per day.17 This water use represents all household water uses, not only water for drinking water purposes. This daily per capita water usage is a conservative estimate based on water conservation best management practices.18
A second scenario was included to consider the volume of water used by this population exclusively for drinking purposes. Per capita drinking water consumption is assumed to be 12.5 gallons per day according to American Water Works Association Research Foundation data.19 This calculation provides reference for a scenario in which personal water treatment systems are used to treat contaminated drinking water at the home, rather than at public facilities, so that water for non-drinking uses is not treated with costly treatment processes. Point-of-entry or point-of-use systems are types of personal water treatment systems that can be installed where water enters a household or in specific locations where water is used, respectively. Small-scale systems effective in the removal of nitrate including reverse osmosis, ion-exchange, and distillation are available, but operate at lower efficiencies in comparison to large-scale treatment facilities. Thus, the first scenario examines relatively efficient large-scale treatments of vast volumes of water, while the second scenario examines relatively inefficient small-scale treatments of smaller volumes of water.
The baseline energy consumption was calculated for each of the two scenarios assuming average energy consumption per unit volume of surface treatment in the United States as reported by the Electric Power Research Institute.20 This baseline estimate represents the annual amount of energy that would be required to treat water delivered by public water suppliers that reported nitrate concentrations exceeding the acceptable drinking water standard between the years of 1998 and 2003 without existing advanced nitrate removal processes. This calculation was repeated for the same volume of water, assuming the average energy consumption per unit volume of water for reverse osmosis treatment, a process that is effective in the removal of nitrate. Subsequently, the percent increase in energy consumption from the baseline was calculated. It is important to note that since efficiencies vary amongst different types and brands of personal treatment systems, energy consumption estimates for the second scenario are based on large-scale treatment energy consumption values reported in Table 1. Therefore, the results are likely an underestimate of actual energy consumption for home water treatment.
| Treatment process | kWh per million gallons |
|---|---|
| Average groundwater treatment (chlorine disinfection) | 10 |
| Average surface water treatment | 140–210 |
| Gravity-based treatment with chlorine disinfection | 80 |
| Electrodialysis | 2600–5000 |
| Multi-effect distillation | 7700–15300 |
| Reverse osmosis | 3900–9700 |
| Reverse osmosis | 13![[thin space (1/6-em)]](https://www.rsc.org/images/entities/char_2009.gif) 200–26500 200–26500 |
Although several water treatment options exist for the removal of nitrate, this analysis only considers reverse osmosis since it is currently the most economical, energy-efficient, and feasible option at the commercial scale. Ion-exchange methods are not always effective for nitrate removal, especially in hard water where other cations may reduce the effectiveness of ion-exchange resins.21 Disposal of highly concentrated waste is also difficult. Electrodialysis and distillation are very effective for nitrate removal, but are not economical at the commercial scale due to energy consumption and treatment efficiency.
The following subsections provide a qualitative assessment of the nation's surface water and groundwater sources, followed by a description of potential treatment processes to remove nitrate from contaminated water.
Nitrate contamination in surface water sources
Surface water sources supply 61% of the population with water.20 In 2006, the USGS released a report establishing baseline water quality conditions in 51 of the nation's major river basins and aquifer systems.22 Although the report marks a preliminary attempt to collect consistent and comprehensive national water quality data, it is limited to 300 sites that were largely inconsistent in terms of temporal and spatial distribution.22 Results indicated that watersheds downstream of agricultural land use typically had the highest nitrate concentrations because of high nitrogen inputs from fertilizers and manure.22 The Midwest was particularly susceptible to high nitrate loading because of the prevalence of subsurface drains that facilitate nitrate movement through the soil.22 This movement is accelerated by heavy use of irrigation water that carries nitrogen from the soil into surface water via runoff and groundwater via percolation.22In total, 14 of 115 sites monitored in the area had nitrate levels upwards of 10 mg L−1 NO3-N.22 However, these are not typically streams that are used for public supply. Only 3% of streams used for public supply were found to exceed drinking water standards for nitrate.22 The Heinz Center found that the average nitrate level recorded in 372 stationary sites was 2.24 mg L−1 NO3-N, with 10 of these sites exceeding 10 mg L−1 NO3-N.23 The low occurrence of contamination is partly due to the fact that large watersheds are typically used for public supply, and are not likely to have high nitrate contamination because their high volume of water effectively dilutes contaminants. The low occurrence of contamination is partly due to the fact that large watersheds are typically used for public supply, and are not likely to have high nitrate contamination because their high volume of water effectively dilutes contaminants.
Although various types of non-point sources contribute to water pollution, nutrient leaching due to high application rates of nitrogen fertilizers in agricultural areas is considered the primary cause of the nation's impaired lakes and estuaries and the second most prevalent cause of impairment in rivers.24 Other sources, such as discharge from wastewater treatment plants and runoff from animal manure, fertilized lawns, and golf courses, as well as the atmospheric disposition of nitrogen, are also smaller contributors to eutrophication.25
Nitrate contamination in groundwater sources
While contamination of surface water sources is very small, we find that the results are different for groundwater sources. Groundwater aquifers supply 39% of the nation's population with drinking water and account for 98% of the nation's total domestic withdrawals.20 Recent studies have attributed increasing nitrate concentrations in groundwater in the Great Plains and Midwest to excess nitrate leaching from agricultural areas.26 Aquifer contamination often occurs when excess nitrate from organic nitrogen fertilizers accumulates in soil and percolates downward into groundwater aquifers below.27 While public community supply wells tend to be deeper and less inclined to be contaminated, public non-community wells and privately owned groundwater wells are often vulnerable to nitrate contamination.27 These wells are typically served by their own supply of water and tend to be small and shallow, and thus, more susceptible to nitrate contamination.20 Although non-community sources are required to maintain the level of water quality defined by the federal Safe Drinking Water Act, private wells are not monitored.13The USGS recently released a report that summarizes the findings of two nonlinear models developed to predict the contamination of shallow (less than 5 m deep) groundwater aquifers from non-point sources, as well as the nitrate concentration in deeper nearby wells. The models conclude that there is a positive relationship between agricultural area and/or the application of fertilizer loading, and nitrate concentration in groundwater sources.11 Results classified groundwater aquifers by their “vulnerability” to contamination, which was determined by factors such as soil drainage characteristics and the ratio of woodland acres to cropland acres, since these factors largely influence the rate at which nitrate percolates through soil.12 Groundwater sources found to be the most vulnerable to contamination were shallow wells downstream of agricultural land.12 Similar to trends observed in surface water sources, areas downstream of the Corn Belt region had high contamination levels due to high agricultural activity, well-drained soil characteristics, high use of irrigation, and high rainfall.
Energy costs for treating contaminated water
This analysis considers the increased energy cost of the advanced treatment process, reverse osmosis, in comparison to average energy consumption of water treatment plants in the United States. Reverse osmosis separates dissolved solutes by pushing water through a semi-permeable membrane by means of a high-pressure gradient.28 The energy consumption of reverse osmosis varies a great deal depending on the quality of source water. Brackish water typically requires 3900–9700 kWh per million gallons29 to reduce dissolved solids to acceptable concentrations, while the desalination of saltwater can require as much as 37800 kWh per million gallons30 using reverse osmosis. This analysis assumes an energy consumption rate of 3900 kWh per million gallons of water treated in order to reflect the most conservative estimate of energy consumption. This value is likely to be higher for water of poor background quality.
As noted before, there are other treatment processes that are effective in the removal of nitrate but are not considered in this analysis because of shortcomings that limit their feasibility for large-scale applications. These processes include ion-exchange, electrodialysis, distillation, and biological denitrification.28
Ion-exchange processes commonly use resins to reduce nitrate by exchanging a common ion such as a sulfate radical, chloride ion, bisulfate ion, bicarbonate ion and carbonate ion for the nitrate radical.31 Ion-exchange membranes may also be used, which exchange ions in the membrane structure, similar to ion-exchange resins.30 Since these methods rely on the exchange of one contaminant ion for another regenerant ion, the exchange medium must be “regenerated” when there are no ions left to replace contaminant ions.21 The effectiveness of nitrate uptake is also compromised when water has a high level of hardness, since other ions that may compete with the ion-exchange process can be introduced.21 These characteristics make it difficult to use this process on a large-scale, as it requires careful monitoring. Electrodialysis is an ion-exchange membrane process that uses electricity to facilitate the exchange of ions, and consumes approximately 2600–5000 kWh per million gallons of water treated.30 However, electrodialysis is not reliable for large volumes of water since membranes often become obstructed by suspended particulates or salt precipitation, which limits the quantity of water that can be treated. All ion-exchange methods, including electrodialysis, also generate highly concentrated waste streams that must be carefully disposed.21
Distillation requires significantly more energy than reverse osmosis for nitrate removal, and therefore, is not a likely treatment method for this purpose. Biological denitrification, which uses bacteria to reduce nitrate to nitrogen gas, is not a viable option for surface water treatment facilities, but may be an option for treating contaminated groundwater aquifers.
Often, two or more treatment processes are used in combination in order to achieve the desired quality for end use. Since nitrate removal processes are intended to remove dissolved contaminants from water, they require much more energy than simple filtration methods because the treatment must effectively reverse the process of dilution and return contaminants back into their concentrated form.28 These processes are therefore only used when source water exceeds drinking water standards.28 Conventional water treatment methods such as boiling, filtration, disinfection, and water softening have little, if any, effect in removing nitrate from drinking water.26
Table 1 lists the energy costs of several types of water treatment technologies, both conventional treatment methods and technologies effective in the removal of nitrate such as electrodialysis and reverse osmosis. Several desalination methods for treating saltwater are included, since states such as California are already using these energy-intensive methods as their surface and groundwater sources become increasingly rare.33 Gravity-based treatment with chlorine disinfection is included for comparison since this is the conventional treatment method for surface water. The nationwide average energy consumption during surface water treatment is also shown. Since the energy consumption of these technologies is highly variable depending on initial nitrate concentration, salinity, voltage application, pH, and other water quality parameters, general ranges of typical energy consumption are provided.34
Sometimes smaller water sources that become contaminated beyond 10 mg L−1 NO3-N may utilize non-treatment options, which include blending contaminated water with uncontaminated water or retiring the contaminated source completely and pumping water from a healthier source. Non-treatment methods can be used if nitrate contamination is localized to a specific source and the surrounding supplies are not contaminated. Blending contaminated water with uncontaminated water is a convenient way to dilute water sources with high concentrations of nitrate, but is not always an option since contamination often occurs in multiple aquifers in a given region.-N may utilize non-treatment options, which include blending contaminated water with uncontaminated water or retiring the contaminated source completely and pumping water from a healthier source. Non-treatment methods can be used if nitrate contamination is localized to a specific source and the surrounding supplies are not contaminated. Blending contaminated water with uncontaminated water is a convenient way to dilute water sources with high concentrations of nitrate, but is not always an option since contamination often occurs in multiple aquifers in a given region.
Pumping water is typically the most energy-intensive aspect of the water treatment process, and therefore must be considered when selecting whether or not non-treatment methods are economical. A typical groundwater treatment plant consumes 30% more energy than a surface water treatment plant per unit water due to the increased energy cost of pumping water out of the ground.24 On average, over 99% of the energy consumed to transport, treat, and deliver groundwater occurs during well-pumping and booster pumping to and from the treatment facility.24
Results and discussion
Between the years of 1998 and 2003, 12.4 million people drank from public water supply systems that reported exceeding the EPA's MCL for NO3-N.16 If the average person used 140 gallons of potable water a day,18 then approximately 634 billion gallons of water were delivered through public supply systems without meeting acceptable drinking water standards. This volume is significantly lower (57 billion gallons) for the second scenario in which only drinking water is considered.Baseline energy consumption for the overly contaminated areas was calculated by assuming that standard surface water treatment consumes, on average, 175 kWh per million gallons (Table 1) of water treated.20 Thus, using standard treatment over a year for this quantity of water that exceeds MCL standards would consume 111 million kWh for the first scenario and 10 million kWh for the second scenario.
Increasing treatment to address the nitrate contamination would raise energy consumption dramatically in both scenarios. For example, the energy consumption required to treat the same quantity of water using reverse osmosis was calculated assuming that reverse osmosis requires 3900 kWh per million gallons (Table 1) of water treated. (Note that this calculation represents a conservative estimate, since reverse osmosis may require more energy depending on the quality of the raw source water.) Treating 634 billion gallons of water with reverse osmosis, by contrast, would consume approximately 2471 million kWh per year. Treating 57 billion gallons of water in the second scenario would consume 221 million kWh. Each scenario experiences an increase of 2100% over the baseline energy consumption for the affected areas. Also of note is the fact that treating 57 billion gallons of water with reverse osmosis in the second scenario requires approximately double the amount of energy as treating 634 billion gallons of water with standard surface water treatment in scenario 1. All results are summarized in Table 2.
| Number of people affected by nitrate contamination (1998–2005) | Daily per capita water use*/gallons | Annual energy consumption using standard surface water treatment/millions of kWh | Annual energy consumption using reverse osmosis/millions of kWh | Percent increase of reverse osmosis from baseline (%) |
|---|---|---|---|---|
| 12400000 |
140.0 | 111 | 2471 | 2129 |
| 12400000 |
12.5 | 10 | 221 | 2129 |
Properly treating this small area alone would represent a 4.2% increase in total energy consumption for the entire water treatment sector nationwide. Thus, if increased biofuels production causes even greater amounts of water to exceed acceptable contamination levels, we can expect to see significant additional energy requirements as an unexpected consequence.
Although an additional portion of the population drank water supplied from contaminated private groundwater wells in this period of time, they were not considered in this analysis since private wells are not regulated according to EPA drinking water standards. That is, while it might be wise to treat water in those wells, it is not a statutory requirement to do so, and thus the energy requirements for that treatment were excluded from this analysis.
Based on future projections, it is likely that the increase in nitrogen export to the Mississippi-Atchafalaya River Basin and in agricultural regions across the nation will be of the order of 10–37% from the control scenario depending how cropland is allocated and managed.1,4,14 Even if this increase occurred, less than 5 of the 362 sites monitored in the Heinz Center report23 that currently fall below the federal MCL for nitrate in drinking water would surpass the standard. It is also important to note that surface water treatment plants are typically supplied by large water sources that are not likely to be susceptible to nitrate contamination due to higher volumes. Of the nation's total supply of public water, 61% is supplied by surface water, yet only 8% of this volume is supplied to small, non-community systems.20 The remaining 92% is fed to community systems that tend to be much larger than non-community systems and are usually closer to towns and cities, and therefore are less likely to experience significant shifts in nitrogen loading due to the increased production of biofuels. Consequently, it is improbable that the energy consumption associated with water treatment in surface water sources will be influenced by the large shifts in corn cultivation.
However, the impacts are different for groundwater sources, which are the primary reservoirs of water to non-urban communities. While these communities typically avoid contamination risks such as urban and industrial runoff, damaged septic tanks, and wastewater treatment plants, they will be the most likely to be impacted by increased agricultural activity in the Corn Belt region.27 Although data exist on current concentrations of nitrate in groundwater wells across the United States, few studies have successfully quantified the rate of change of nitrate in groundwater wells.35 Recently, high priority has been placed on establishing trends in terms of the nitrification and denitrification in wells so that realistic methods of modeling the effect of anthropogenic influences on water bodies can be developed.35 However, considering that 24% of highly vulnerable wells are already contaminated, and a large proportion of groundwater sources in the Midwest tend to be smaller, private aquifers, it is likely that more wells may become contaminated as agricultural activity increases in the next few decades.
Groundwater treatment typically requires minimal energy for purification when below the MCL.36 In fact, much of the groundwater pumped from private wells does not receive any type of treatment.20 However, water treatment that can adequately remove contaminants is much more energy-intensive than standard gravity-based treatments with chlorination, which are typically used for groundwater treatment.20 A shift towards these advanced processes may be costly in terms of additional electricity consumption. Treating a volume of water with reverse osmosis treatment may require more than one hundred times the energy required to use gravity-based treatment with chlorine disinfection. It is difficult to quantify the number of wells that are used as drinking water sources and that have an increased risk of nitrogen contamination, but considering that approximately 83 billion gallons of groundwater are pumped per day in the United States, even a small shift in treatment methods could have large repercussions in terms of increased energy consumption.24
Quantifying the increase in energy consumption due to the expansion of ethanol is hindered because significant data gaps exist in terms of nitrate levels in current surface water and groundwater sources. Changes in nitrate concentration will vary according to the volume of the water supply, whether it is a surface or groundwater source, how far away it is from the source of contamination, as well as other characteristics such as climactic and seasonal variation. Furthermore, projected increases in nitrate contamination will not affect all drinking water sources equally, since most wells in agricultural areas are not used for public supply, and therefore are not subject to EPA regulations. Thus, private, unmonitored wells cannot be assumed to have an associated energy penalty for exceeding the MCL. Finally, water treatment facilities often rely on multiple sources of water, so it is difficult to project how contamination in individual sources may influence the net nitrate concentration of water being treated at water treatment facilities.
This analysis considered the impact that future increases in cornstarch-based ethanol will have on the energy consumed for surface and groundwater treatment based on the current MCL of nitrate in drinking water. However, growing concerns over the public health ramifications of water pollution in drinking water in the recent years may result in more stringent standard in the future.13,37 If the number of regulated contaminants in source water increases simultaneously with tightening of acceptable MCL standards, the growth in energy consumption by the water treatment sector will be compounded.
Conclusion
While this analysis is the first to explicitly consider the unexpected energy ramifications of water quality degradation from increased biofuels production, it is hindered by a lack of suitable data regarding the current state of contamination in groundwater sources. However, our analysis does identify that drinking water contamination already affects a significant amount of water that would be costly and energy-intensive to treat with processes effective in the removal of contaminants such as nitrate. In addition, prior analyses1,4,14 suggest that increases in nutrient loading due to the expansion of ethanol will be in the range of 10 to 37%. Therefore, the expansion of biofuels in the future may be accompanied with a significant energy cost for water treatment. The irony here is that policy choices to improve our energy situation, namely the Energy Independence and Security Act, would be responsible in these scenarios for inducing these increases in energy consumption.One of our conclusions, based on current concentrations of nitrate in surface water, is that projected increases in nitrate in surface water in the Mississippi-Atchafalaya River Basin are unlikely to cause a significant increase in the number of drinking water sources that exceed 10 mg L−1 NO3-N. However, our second conclusion is that it is likely that groundwater sources might become more vulnerable to nitrate contamination as a result of increased corn ethanol production. This consequence is largely due to the fact that groundwater sources, unlike surface water sources, are often small, shallow, and more vulnerable to pollutants like nitrate.-N. However, our second conclusion is that it is likely that groundwater sources might become more vulnerable to nitrate contamination as a result of increased corn ethanol production. This consequence is largely due to the fact that groundwater sources, unlike surface water sources, are often small, shallow, and more vulnerable to pollutants like nitrate.
This analysis highlights the following trends that may be exacerbated as a result of recent legislation promoting the expansion of biofuels:
• Cornstarch-based ethanol production in the United States will grow significantly due the Renewable Fuel Standard implemented through the Energy Independence and Security Act.
• Increased ethanol production will cause increased nutrient loading to surface water and groundwater sources downstream of agricultural land.1,4,14
• Increased nutrient loading will increase nitrate contamination in source water for drinking water treatment facilities.
• Downstream water treatment plants in areas where increased runoff causes water contamination to exceed EPA drinking water standards will substantially increase their energy consumption.
• Drinking water standards may become more stringent in the future due to growing public health concerns regarding nitrate.13,37
• As drinking water standards tighten in parallel with higher contamination from increased biofuels production, the energy requirements to treat water to acceptable standards might have compound growth.
We recommend that future analyses begin by first conducting a high-fidelity survey of the existing state of contamination, after which a more detailed estimate for increased energy consumption can be determined.
| EISA | Energy Independence and Security Act |
| EPA | Environmental Protection Agency |
| GHG | Greenhouse gas |
| MCL | Maximum contaminant level |
| NO3-N | Nitrate (as nitrogen) |
| RFS | Renewable fuel standard |
| USGS | United States Geological Survey |
References
- S. D. Donner and C. J. Kucharik, Proc. Natl. Acad. Sci. U. S. A., 2008, 105, 4513–4518 CrossRef CAS.
- J. M. Evans and M. J. Cohen, Global Change Biol., 2009, 15, 2261–2273 CrossRef.
- Energy Independence and Security Act of 2007, http://www.govtrack.us/congress/bill.xpd?bill=h110-6, accessed June 27, 2009.
- T. W. Simpson, A. N. Sharpley, R. W. Howarth, H. W. Paerl and K. R. Mankin, J. Environ. Qual., 2008, 37, 318–324 CrossRef CAS.
- W. Gerbens-Leenesa, A. Y. Hoekstra and T. H. van der Meer, Proc. Natl. Acad. Sci. U. S. A., 2009, 106, 10219–10223 CrossRef.
- C. W. King and M. Webber, Environ. Sci. Technol., 2008, 42, 7866–7872 CrossRef CAS.
- N. N. Rabalais, R. E. Turner and D. Scavia, BioScience, 2002, 52, 129–142 CrossRef.
- J. Hill, E. Nelson, D. Tilman, S. Polasky and D. Tiffany, Proc. Natl. Acad. Sci. U. S. A., 2006, 103, 11206–11210 CrossRef CAS.
- W. J. Mitsch, J. W. Day, J. W. Gilliam, P. M. Groffman, D. L. Hey, G. W. Randall and N. Wang, BioScience, 2001, 51, 373–388 CrossRef.
- P. C. Westcott, Amber Waves, 2007, 5, 10–15 Search PubMed.
- B. Nolan and K. Hitt, Environ. Sci. Technol., 2006, 40, 7834–7840 CrossRef CAS.
- B. T. Nolan, B. C. Ruddy, K. J. Hitt and D. R. Helsel, Water Conditioning and Purification, 1998, 39, 76–79 Search PubMed.
- M. H. Ward, T. M. deKok, P. Levallois, J. Brender, G. Gulis, B. T. Nolan and J. VanDerslice, Environ. Health Perspect., 2005, 113, 1607–1614 CAS.
- H. Han, J. D. Allan and D. Scavia, Environ. Sci. Technol., 2009, 43, 1916–1922 CrossRef CAS.
- B. T. Nolan, B. C. Ruddy, K. J. Hitt and D. H. Helsel, Environ. Sci. Technol., 1997, 31, 2229–2236 CrossRef CAS.
- Environmental Working Group, National Tap Water Quality Database, Washington, DC, 2005 Search PubMed.
- Texas Water Development Board, Water Conservation Implementation Task Force: Report to the 79th Legislature, Austin, TX, 2004 Search PubMed.
- Natural Resources Defense Council, Energy Down the Drain: The Hidden Costs of California's Water Supply, Oakland, CA, 2004, http://www.nrdc.org/water/conservation/edrain/edrain.pdf Search PubMed.
- Aquacraft, Inc. and American Water Works Association Research Foundation, Residential End Uses of Water Study, Denver, CO, 1999 Search PubMed.
- EPRI, Water and Sustainability: U.S. Electricity Consumption for Water Supply and Treatment—The Next Half Century, Palo Alto, CA, 2002, vol. 4, No. 1006787 Search PubMed.
- National Drinking Water Clearinghouse at West Virginia University, Ion Exchange and Demineralization, Morgantown, WV, 2003 Search PubMed.
- USGS, Nutrients in streams and rivers across the nation—1992–2001, Scientific Investigations Report 2006–5107, Reston, VA, 2006 Search PubMed.
- The H. John Heinz III Center for Science, Economics, and the Environment, The State of the Nation's Ecosystems: Measuring the Lands, Waters, and Living Resources of the United States, New York, NY, 2005 Search PubMed.
- EPRI, Water and Sustainability: An Assessment of Water Demand, Supply, and Quality in the U.S.—The Next Half Century, Palo Alto, CA, 2002, vol. 2, No. 1006785 Search PubMed.
- USEPA Science Advisory Board, Hypoxia in the Northern Gulf of Mexico: An Update by the EPA Science Advisory Board, Washington, DC, 2007, EPA-SAB-08–003 Search PubMed.
- University of Idaho, Nitrate and Groundwater, http://info.ag.uidaho.edu/pdf/CIS/CIS0872.pdf, accessed May 2, 2009.
- B. Nolan, Ground Water, 2001, 39, 290–299 CrossRef CAS.
- J. Crittenden, R. R. Trussell, D. Hand, K. Howe and G. Tchobanoglous, Water Treatment: Principles and Design, John Wiley & Sons, Hoboken, New Jersey, 2nd edn, 2005 Search PubMed.
- California Energy Commission, California's Water–Energy Relationship, Sacramento, CA, 2005, CEC-700-2005-011-SF Search PubMed.
- Power Plant Engineering—Design and Construction, ed., L. Drbal, P. Boston, K. Westra and V. Black, Chapman & Hall, New York, 1996 Search PubMed.
- USEPA, Removal of Nitrate from Contaminated Water Supplies for Public Use, Cincinnati, Ohio, 1981, EPA-600/S2–81/029 Search PubMed.
- M. Wilf, From Seawater Desalination: Meeting the Needs of California's Coastal Communities. Seminar Held by the University of California, Santa Barbara (UCSB) Extension, February 14, 1991 Search PubMed.
- L. Dale, Resour. Conserv. Recycl., 2004, 42, 337–350 CrossRef.
- A. S. Koparal and U. B. Ogutveren, J. Hazard. Mater., 2001, B89, 83–92.
- M. Rupert, J. Environ. Qual., 2008, 37, 240–248.
- USDOE, Energy Demands on Water Resources: Report to Congress on the Interdependency of Energy and Water, Washington, DC, 2006 Search PubMed.
- D. M. Manassaram, L. C. Backer and D. M. Moll, Environ. Health Perspect., 2006, 114, 320–327 CAS.
| This journal is © The Royal Society of Chemistry 2010 |