Evaluation of Si/carbon composite nanofiber-based insertion anodes for new-generation rechargeable lithium-ion batteries†
Liwen
Ji
and
Xiangwu
Zhang
*
Fiber and Polymer Science Program, Department of Textile Engineering, Chemistry and Science, North Carolina State University, Raleigh, NC 27695-8301, USA. E-mail: xiangwu_zhang@ncsu.edu; Fax: +1 919-515-6532; Tel: +1 919-515-6547
First published on 27th November 2009
Abstract
A convenient and low cost approach has been developed for the fabrication of advanced anode materials for rechargeable lithium-ion batteries by loading Si nanoparticles as an alloying media into carbon nanofibers. The resultant composite nanofiber anodes have special fibrous textures that can absorb the huge volume change of Si during Li insertion and extraction reactions and hinder the cracking or crumbling of the electrode, and hence they have good electrochemical behaviors including large reversible capacity, relatively high capacity retention and good rate capability.
Broader contextThe utilization of nanoscience and nanotechnology opens up a revolutionary opportunity to lower the cost, increase the power/energy densities, and improve the cycle life of lithium-ion batteries, which are recognized to be an economically and environmentally sound alternative to address the worldwide critical energy issue that is one of the most urgent problems of our society. We present here an effective, nondestructive, low cost, and environmentally benign electrospinning strategy to fabricate Si nanoparticle-loaded porous carbon nanofiber anodes for high-performance rechargeable lithium-ion batteries, which can exhibit higher reversible capacities, improved cyclability, and enhanced rate capability, because of the unique combinative effects of Si fillers and carbon matrices, as well as their unique texture and surface properties. |
Introduction
As technologies advance to solve the worldwide critical energy issue that is heading the list of the most urgent global problems facing our society, the development of new materials for high-performance electrochemical energy storage devices becomes increasingly important.1–3 Lithium-ion batteries (LIBs), which have high energy density, long cycle life, and flexible design, appear as one of the most promising energy storage devices and are currently being used as portable power sources for consumer electronic devices.4–6 However, the ever-growing need for higher capacity and higher power, especially for increasing number of emerging large-scale applications, including hybrid and plug-in hybrid electric vehicles and smart power grids, has further prompted widespread research efforts towards developing electrode materials with more appropriate properties for higher efficiency, longer cycle life, better safety, more environmentally benign and lower cost LIBs.7–10Si is a potentially attractive alloy-type high-capacity anode material for LIBs as it exhibits a low discharge potential and has the highest known theoretical lithium intercalation capacity of approximately 4200 mA h g−1, which is more than ten folds higher than theoretical capacity of commercial graphite (372 mA h g−1).11–13 However, the enormous volume change of Si upon repeated lithium insertion and extraction leads to severe Si particle segregation and loss of effective particle–particle electronic contacts, and as a result, pure Si-based anodes suffer from large capacity fading and pulverization during cycling, which have prevented them from being commercially used.12,13
Tremendous efforts have been made to improve the cyclability of Si-based anodes through improving their micro-structural stability and integrity.7,11–16 One generally accepted strategy is to prepare various composite materials containing well-dispersed Si particles by introducing a second phase as the host matrix. Carbon has been proposed as a candidate host matrix because carbon can buffer the volume changes of Si particles and guarantee good electrical contact during Li insertion and extraction.17–21 Recent work has also demonstrated that anodes made of Si/carbon composites have the potential to combine the advantageous properties of both carbon (long cycle life) and silicon (high lithium-storage capacity) to improve the overall electrochemical performance of LIB anodes.22,23 However, most reported methods for preparing such materials are complicated and use toxic and harmful chemical substances.17–23 In addition, the electrochemical performance of the resultant composite anodes has been less than optimal.
We present here a relatively novel, simple and environmentally benign strategy to prepare porous Si/carbon composite nanofibers (Si/CNFs) by a judicious combination of electrospinning and subsequent thermal treatment processes.24,25 After a careful analysis of the structural features, we directly utilized these Si/CNF composites as anodes for rechargeable LIBs without introducing an additional polymer binder or conductive material. These novel materials can not only combine the merits of both Si and carbon, but also present many unique characteristics, such as long charge transfer pathways along the fiber length, large surface-to-volume ratio for increased lithium-storage capacity, large pore volume for providing extra room for volume expansion that accompanies lithium-ion intercalation and discharge, and enhanced electrical and mechanical properties for improving the stability and safety of the batteries. As a result, these porous Si/CNFs provide a new approach to make anodes for future LIBs.
2. Experimental
Polyacrylonitrile (PAN), poly-L-lactic acid (PLLA) and solvent N,N-dimethylformamide (DMF) were purchased from Aldrich (USA). Si nanoparticles were purchased from Nanostructured & Amorphous Materials, Inc. A dispersion of 30 wt% Si nanoparticles in 8 wt% DMF solution of PAN/PLLA blends (85/15) was prepared at 60 °C. Strong mechanical stirring combined with an ultrasonic treatment (FS20H Sonicator, Fisher Scientific) was applied for at least 72 h in order to obtain a homogeneous dispersion. For comparison, a dispersion of 30 wt% Si nanoparticles in an 8 wt% DMF solution of pure PAN was also prepared. Electrospinning was carried out with a 0.75 ml h−1 flow rate, 15 cm needle-to-collector distance, and 21 kV voltage. Electrospun Si/PAN/PLLA nanofibers were first stabilized in air at 280 °C for 8 h (heating rate was 5 °C min−1) and then carbonized at 700 °C for 1 h in argon (heating rate was 2 °C min−1) to obtain Si/CNFs [named Si/CNFs (85/15)]. For comparison, Si/CNFs [named Si/CNFs (100/0)] were also prepared from electrospun Si/PAN nanofibers.The morphology and diameter of Si/PAN and Si/PAN/PLLA composite nanofibers were evaluated using scanning electron microscopy (JEOL 6400F Field Emission SEM at 5 kV). Their corresponding carbonized nanofibers were also studied with analytical UHR FE-SEM (SU-70) at 5 kV. Attenuated total reflection-Fourier transform infrared (ATR-FTIR) spectra were collected from a FTIR spectrometer (Nicolet 560) in the wavenumber range of 3800–700 cm−1 at room temperature. Thermal properties of electrospun nanofibers were evaluated using differential scanning calorimetery (DSC) from 25 to 400 °C at a heating rate of 10 °C min−1 in a nitrogen atmosphere (Perkin Elmer Diamond Series DSC with Intracooler). Thermo-gravimetric analysis (TGA) was also used to determine the weight loss of composite nanofibers (after solvent evaporation) at a 10 °C min−1 heating rate from 25 to 800 °C in an air environment (TA Instruments Hi-Res TGA 2950). The structural variations of Si/CNFs were identified by wide angle X-ray diffraction (WAXD, Philips X'Pert PRO MRD HR X-Ray Diffraction System, Cu Kα, λ = 1.5405 Å) and Raman spectroscopy (Horiba Jobin Yvon LabRam Aramis Microscope, 633 nm HeNe Laser). Surface area analysis was carried out using the Brunauer-Emmett-Teller (BET) nitrogen adsorption method (Micromeritics Gemini 2360).
Electrochemical performance evaluations were performed using 2032 coin-type cells. The relatively thin, mechanically tough Si/CNF non-woven films (weight: 2.0 mg, diameter: 0.5 in, and thickness: 30 μm) were prepared by a simple punching process after carbonization, and are attached onto copper foil (thickness of 25 μm, Lyon industries) to be used as the working electrode without adding any binder. Lithium ribbon (thickness of 0.38 mm, Aldrich) and Separion S240 P25 (thickness of about 10 μm, Degussa) were used as counter electrode, and separator, respectively. The working electrode, separator, spring, gasket, cases, cap, and spacer were placed in an oven at about 120 °C overnight under vacuum. The electrolyte used was 1 M lithium hexafluorophosphate (LiPF6), dissolved in 1/1 (v/v) ethylene carbonate (EC)/ethyl methyl carbonate (EMC) (Ferro Corp.). The cells are assembled in a high purity argon-filled glove box using a pressure crimper. Charge (lithium insertion) and discharge (lithium extraction) were conducted using an Arbin automatic battery cycler at different current densities between cut-off potentials of 0.01 and 2.8 V with constant current densities. The current densities used were 50, 100, 200, 300, and 500 mA g−1. In addition, for each electrochemical measurement, at least three electrodes are prepared and tested to ensure the reproducibility of results. The surface morphology of Si/CNFs after electrochemical measurements was also examined with analytical UHR FE-SEM (SU-70) at 5 kV.
3. Results and discussion
Fig. 1 shows typical SEM images of electrospun Si/PAN (Fig. 1A–C) and Si/PAN/PLLA (Fig. 1D–F) composite nanofibers. In both types of nanofibers, agglomerates formed by Si nanoparticles can be seen from the fiber surface. Bead-like irregularities or fibers with a ‘beads on a string’ morphology also appear in nanofibers. Compared with Si/PAN composite nanofibers, Si/PAN/PLLA composite nanofibers have slightly smaller diameters because the presence of the conductive PLLA phase increases conductivity of the electrospinning solution and leads to a thinner fiber diameter.26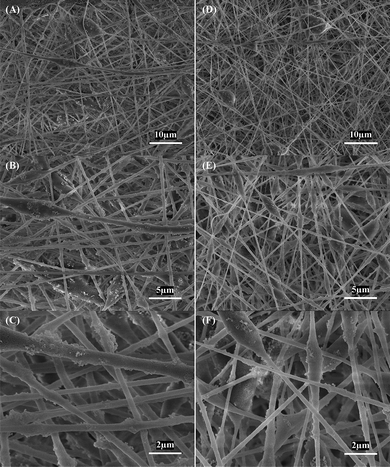 | ||
| Fig. 1 SEM images of (A, B, C) Si/PAN, and (D, E, F) Si/PAN/PLLA composite nanofibers. | ||
ATR-FTIR spectra of pure PAN, Si/PAN and Si/PAN/PLLA nanofibers were illustrated in Fig. S1.† All three types of nanofibers exhibit peaks at 2930, 2240, and 1470 cm−1 due to the stretching vibration of methylene (–CH2–), stretching vibration of nitrile groups (–CN–), and bending vibration of methylene, respectively, but the intensities of these peaks in Si/PAN/PLLA composite nanofibers are significantly lower than those in PAN and Si/PAN nanofibers, due to the formation of intermolecular interactions between PAN and PLLA. In addition, compared with pure PAN and Si/PAN nanofibers, Si/PAN/PLLA composite nanofibers show a typical ester peak of lactide at 1750 cm−1 and a characteristic C–O–C stretch vibration at 1200 cm−1.26
Thermal properties of electrospun nanofibers were investigated using DSC and TGA. Fig. S2† shows the DSC thermograms of PAN, Si/PAN, and Si/PAN/PLLA composite nanofibers. Pure PAN nanofibers exhibit a relatively large and sharp exothermic peak at about 287 °C,26,27 indicating that complicated and multiple chemical reactions, such as cyclization, crosslinking and dehydrogenation, etc., take place during thermal treatment processes. The exothermic peak of Si/PAN composite nanofibers shifts to a slightly higher temperature (293 °C). However, the exothermic peak of Si/PAN/PLLA nanofibers shifts to a much higher temperature (313 °C), and at the same time, the peak area intensity, i.e., the total heat of reaction, of these nanofibers is lower than those of pure PAN and Si/PAN nanofibers. The increased peak temperature and the reduced reaction heat are caused by the interactions between PAN and PLLA, which inhibit the formation of free radicals on the nitrile groups and subsequently their re-combinations.26,27
TGA thermograms of PAN, Si/PAN and Si/PAN/PLLA nanofibers were performed in an air environment. As shown in Fig. S3,† the major weight loss of all three types of nanofibers starts at around 310 °C. Pure PAN nanofibers show nearly 100% weight loss after reaching 800 °C, while both Si/PAN and Si/PAN/PLLA composite nanofibers give about 26 wt% residuals, which may be ascribed to the remaining Si nanoparticles from precursor fibers, residuals from the polymer degradation process, and/or SiO2 produced at high temperatures. It should also be noticed that Si/PAN nanofibers show a slight increase before reaching 800 °C (line b in Fig. S3†), which may be caused by the oxidation of Si to SiO2 at high temperatures, since air was used during TGA tests.
PAN, Si/PAN and Si/PAN/PLLA nanofibers were thermally treated in argon, during which PAN transfers to carbon, but the majority of PLLA decomposes.26,27Fig. 2 exhibits SEM images of Si/CNFs (100/0) and Si/CNFs (85/15), which were prepared from Si/PAN and Si/PAN/PLLA precursor nanofibers, respectively. The micrographs indicate that both Si/CNFs (100/0) and Si/CNFs (85/15) have an uneven, cogged and wrinkled surface morphology. Si nanoparticles also agglomerate and form clusters among exterior surfaces of the fibers. In addition, compared with Si/CNFs (100/0), Si/CNFs (85/15) have smaller fiber diameters. In order to further investigate the surface area and pore structure of Si/CNFs, nitrogen adsorption studies were carried out. The Brunauer-Emmett-Teller (BET) method was employed, along with various other theories, to determine specific surface areas, and meso- and micropore volumes and widths (Table 1). The results indicate that both Si/CNFs (100/0) and Si/CNFs (85/15) have large surface areas and pore volumes.
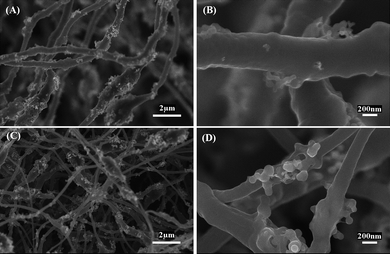 | ||
| Fig. 2 SEM images of (A, B) Si/CNFs (100/0) and (C, D) Si/CNFs (85/15). | ||
| PAN/PLLA/wt% | SSAa/m2 g−1 | TPVb/cm3 g−1 | Vmesoc/cm3 g−1 | Vmicrod/cm3 g−1 |
|---|---|---|---|---|
| a Specific surface area (SSA) was calculated by the Brunauer-Emmett-Teller (BET) method. b TPV indicates total pore volume. c Vmeso is the mesopore (2–50 nm) volume calculated by the Barret, Joyner, and Halenda (BJH) method based on the Kelvin equation. d Vmicro is the micropore (<2 nm) volume calculated by the Horvath-Kawazoe (HK) method. | ||||
| 100/0 | 176 | 0.24 | 0.09 | 0.15 |
| 85/15 | 188 | 0.23 | 0.08 | 0.15 |
WAXD patterns and Raman spectra were conducted to evaluate the structure variations of Si/CNFs. Fig. 3 depicted WAXD patterns of the Si/CNFs along with pure PAN-based CNFs. Typically, pure CNFs only exhibit a diffraction peak at 2θ = 25.0°, which corresponds to the (002) graphite layers.25–27 Both Si/CNFs (100/0) and Si/CNFs (85/15) have apparent diffraction peaks at 28.4°, 47.3°, 56.1°, 69.3°, 76.5° and 88.1°, which are assigned to the (111), (220), (311), (400), (331) and (422) planes of Si, respectively.17–19,21–23 In addition, compared with Si/CNFs (100/0), a significant increase in the diffraction peak intensity is observed in Si/CNFs (85/15). This is because Si/CNFs (85/15) are prepared from carbonizing 30 wt% Si/PAN/PLLA precursor and the complete degradation of PLLA during the thermal treatment, providing Si/CNFs (85/15) with a higher Si content than Si/CNFs (100/0) prepared from 30 wt% Si/PAN precursor. The Raman spectra in Fig. S4† show a defect and disordered carbon induced D-band at about 1300 cm−1 and an E2g2 graphitic mode based G-band at around 1600 cm−1. The presence of both D and G bands, combined with the absence of (100) and (004) planes of graphite crystals in the WAXD results, indicate that the carbon in both CNFs and Si/CNFs is formed mainly by turbostratically disordered graphene sheets.24,26–28
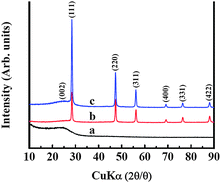 | ||
| Fig. 3 WAXD patterns of (a) pure CNFs, (b) Si/CNFs (100/0), and (c) Si/CNFs (85/15). | ||
Galvanostatic charge-discharge experiments were carried out at a current density of 50 mA g−1 within a voltage window of 0.01–2.8 V to evaluate the electrochemical performance of Si/CNF-based anodes (Fig. 4). It is seen that Si/CNFs (85/15) have larger Li storage capacities than Si/CNFs (100/0). For example, in the first cycle, the Si/CNFs (100/0) exhibit charge and discharge capacities of about 1541 and 1281 mA h g−1, respectively, corresponding to a coulombic efficiency of 83.1% (Fig. 4A). At the same time, Si/CNFs (85/15) exhibit charge and discharge capacities of 1900 and 1550 mA h g−1, respectively, corresponding to a coulombic efficiency of 81.6% (Fig. 4B). In addition, during the first charge process, the voltage of the Si/CNFs (100/0) rapidly drops to about 0.55–0.6V, then exhibiting a small plateau, followed by a sloping line smoothly downshifting to 0.01 V. In the case of Si/CNFs (85/15), this small plateau appears at the range of 0.7–0.75 V. These classical plateaus are well known as the result of the decomposition of electrolyte solution and the formation of the solid electrolyte interface (SEI), which covers the anode surfaces and hinders the electrolyte from further decomposition.17–23 From Fig. 4, it is seen that these plateaus have nearly disappeared after the first cycle, resulting in coulombic efficiencies of nearly 98% in the following cycles. In addition, the discharge capacity of Si/CNFs (100/0) in the second cycle is about 1225 mA h g−1 (Fig. 4A), which indicates a retention of about 95.6% of the capacity (1281 mA h g−1) of the first cycle, whereas the discharge capacity of Si/CNFs (85/15) in the second cycle is about 1528 mA h g−1 (Fig. 4B), corresponding to a 98.6% retention from the first cycle. This indicates that the capacity of Si/CNFs (100/0) fades faster than that of Si/CNFs (85/15). The enhanced cycling performance of Si/CNFs (85/15) compared to Si/CNFs (100/0) is further exhibited at sequential cycles. For example, at the twentieth and fortieth cycles, Si/CNFs (85/15) still have relatively high discharge capacities of about 1075 and 726 mAh g−1, respectively (Fig. 4B), indicating capacity retentions of about 69.4 and 46.8% from the first cycle. However, at the twentieth and fortieth cycles, the discharge capacities of Si/CNFs (100/0) are about 720 and 400 mAh g−1, respectively (Fig. 4A), indicating faster capacity fading (56.2 and 31.2% capacity retentions from the first cycle). Fig. 5 further compares the charge/discharge cycling performance of Si/CNFs (100/0) and Si/CNFs (85/15). The results demonstrate that Si/CNFs (85/15) always deliver larger capacities than Si/CNFs (100/0) upon cycling.
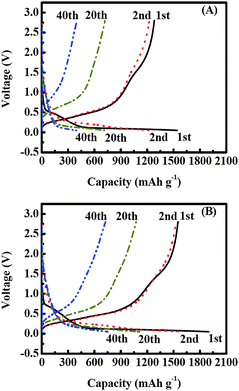 | ||
| Fig. 4 Charge-discharge curves of (A) Si/CNFs (100/0), and (B) Si/CNFs (85/15) at a constant current density of 50 mA g−1. | ||
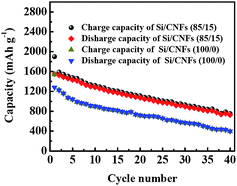 | ||
| Fig. 5 Cycling performance of Si/CNFs (100/0) and Si/CNFs (85/15) at a constant current density of 50 mA g−1. | ||
Fig. 6 summarizes the capacities of Si/CNFs (100/0) and Si/CNFs (85/15) at current densities of 50, 100, 200, 300 and 500 mA g−1. It is seen that both types of Si/CNFs have a small degradation in capacity when current density increases. However, the Si/CNFs (85/15) always have larger reversible capacities.
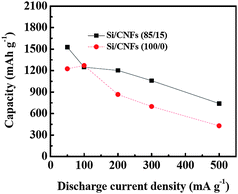 | ||
| Fig. 6 Reversible capacity vs. current density (rate capability) of Si/CNFs (100/0) and Si/CNFs (85/15) at different current densities. | ||
The improvement of electrochemical performance for Si/CNFs (85/15) can be ascribed to their unique structure, with a variety of favorable properties.7–9,11,14,29–33 Firstly, Si nanoparticles are dispersed in a carbon matrix, which plays the role of a structural buffer for hampering the large volume changes during Li insertion and extraction processes, enabling good electrical contact among Si nanoparticles upon cycling, and as a result, the stress formed during the electrochemical cycling can be overcome and the integrity of the electrode can be maintained after cycling. Therefore, Si/CNFs (85/15) combine both the advantages of Si, such as high theoretical specific capacity and low discharge potential, and carbon matrix, such as long cycle life. The cooperative effect between Si and carbon also gives Si/CNFs good capacity retention, high rate capability, and safe operation over many charge/discharge cycles. In addition, compared with regular Si- or carbon-based electrodes, Si/CNFs have a larger accessible surface area that provides additional active sites for Li-ion diffusion and a reduced distance for the transport of both Li ions and electrons; at the same time, the relatively large Si content in Si/CNFs (85/15) also plays an important role in increasing the capacity of the resultant anodes.
Many Si-based electrodes completely lose their structural integrity after cycling. In order to understand the impact of charge/discharge cycling on the electrode microstructures of Si/CNFs (100/0) and Si/CNFs (85/15), SEM images of these nanofibers were taken after 40 cycles and shown in Fig. 7. In Si/CNFs (100/0), the fibrous structure is no longer obvious, indicating that the buffering effect of the carbon matrix is not strong enough to hinder the large volume change of Si in these nanofibers. However, the fibrous structure of Si/CNFs (85/15) is largely maintained, although the agglomeration of Si nanoparticles becomes severer after cycling. As a result, compared with Si/CNFs (100/0), the carbon matrix in Si/CNFs (85/15) has a better ability at buffering the volume changes and accommodating the large strain of Si nanoparticles during lithium insertion and extraction.
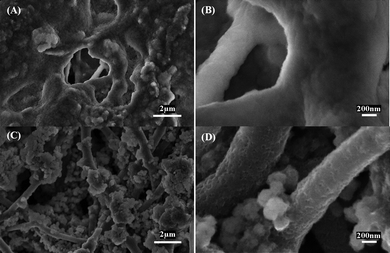 | ||
| Fig. 7 SEM images of (A, B) Si/CNFs (100/0), and (C, D) Si/CNFs (85/15) after 40 charge/discharge cycles at a constant current density of 50 mA g−1. | ||
Fig. 8 further shows the morphologies of Si/CNFs (85/15) after 40 cycles at a much higher current density of 500 mA g−1. It is clearly shown that the fibrous structure is maintained after 40 cycles at this high current density. As a result, the special nanofiber structure of these Si/CNFs can combine the advantageous properties of carbon (long cycle life) and Si (high lithium-storage capacity) to improve the overall electrochemical performance of LIB anodes.7–9,15,16,31,32 In addition, Si nanoparticles closely encapsulated within the carbon matrix have good electronic contacts and short lithium insertion distances.7–9,15,16,31,32 All these factors lead to the enhanced electrochemical performance of Si/CNFs (85/15).
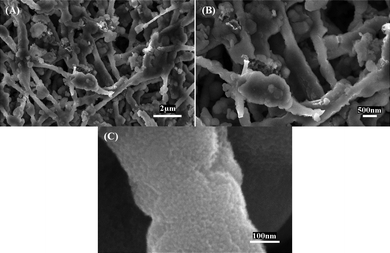 | ||
| Fig. 8 SEM images of Si/CNFs (85/15) after 40 charge/discharge cycles at a constant current density of 500 mA g−1. | ||
4. Conclusion
Si/CNFs were fabricated by electrospinning and thermal treatment processes. These Si/CNFs exhibit large surface areas and pore volumes, and display high reversible capacity, improved cyclic retention, and acceptable rate capability when used as anode materials for LIBs. The good electrochemical performance of Si/CNFs is a result of the cooperative effects of the Si filler and the carbon matrix, as well as the unique one-dimensional nano-fibrous structure with large surface area and high length/diameter ratio.Acknowledgements
This work was supported by the US National Science Foundation (No. 0555959 and 0833837), the ERC Program of the National Science Foundation under Award Number EEC-08212121, and ACS Petroleum Research Funding 47863-G10. The authors would like to thank Dr Dale Batchelor, Mr Andrew J. Medford at North Carolina State University and Dr Mark D. Walters in the Shared Materials Instrumentation Facility at Duke University for their help in sample characterizations.References
- V. Thavasi, G. Singh and G. Ramakrishna, Energy Environ. Sci., 2008, 1, 205–221 RSC.
- P. Balaya, Energy Environ. Sci., 2008, 1, 645–654 RSC.
- A. Manthiram, A. V. Murugan, A. Sarkar and T. Muraliganth, Energy Environ. Sci., 2008, 1, 621–638 RSC.
- J. M. Tarascon and M. Armand, Nature, 2001, 414, 359–367 CrossRef CAS.
- C. K. Chan, X. F. Zhang and Y. Cui, Nano Lett., 2008, 8, 307–309 CrossRef CAS.
- J. W. Long, B. Dunn, D. R. Rolison and H. S. White, Chem. Rev., 2004, 104, 4463–4492 CrossRef CAS.
- Y. G. Guo, J. S. Hu and L. J. Wan, Adv. Mater., 2008, 20, 2878–2887 CrossRef CAS.
- P. G. Bruce, B. Scrosati and J. M. Tarascon, Angew. Chem., Int. Ed., 2008, 47, 2930–2946 CrossRef CAS.
- Y. Xie and C. Z. Wu, Dalton Trans., 2007, 5235–5240 RSC.
- J. Baxter, Z. Bian, G. Chen, D. Danielson, M. S. Dresselhaus, A. G. Fedorov, T. S. Fisher, C. W. Jones, E. Maginn, U. Kortshagen, A. Manthiram, A. Nozik, D. Rolison, T. Sands, L. Shi, D. Sholl and Y. Wu, Energy Environ. Sci., 2009, 2, 559–588 RSC.
- C. K. Chan, H. L. Peng, G. Liu, K. Mcilwrath, X. F. Zhang, R. A. Huggins and Y. Cui, Nat. Nanotechnol., 2008, 3, 31–35 CrossRef CAS.
- X. W. Zhang, P. K. Patil, C. S. Wang, A. J. Appleby, F. E. Little and D. L. Cocke, J. Power Sources, 2004, 125, 206–213 CrossRef CAS.
- U. Kasavajjula, C. S. Wang and A. J. Appleby, J. Power Sources, 2007, 163, 1003–1039 CrossRef CAS.
- L. F. Cui, R. Ruffo, C. K. Chan, H. L. Peng and Y. Cui, Nano Lett., 2009, 9, 491–495 CrossRef CAS.
- F. Y. Cheng, Z. L. Tao, J. Liang and J. Chen, Chem. Mater., 2008, 20, 667–681 CrossRef CAS.
- C. H. Jiang, E. Hosono and H. S. Zhou, Nano Today, 2006, 1, 28–33 CrossRef.
- S. H. Ng, J. Wang, D. Wexler, K. Konstantinov, Z. P. Guo and H. K. Liu, Angew. Chem., Int. Ed., 2006, 45, 6896–6899 CrossRef CAS.
- Y. S. Hu, R. Demir-Cakan, M. M. Titirici, J. O. Müller, R. Schlögl, M. Antonietti and J. Maier, Angew. Chem., Int. Ed., 2008, 47, 1645–1649 CrossRef CAS.
- G. X. Wang, J. H. Ahn, J. Yao, S. Bewlay and H. K. Liu, Electrochem. Commun., 2004, 6, 689–692 CrossRef CAS.
- H. Y. Lee and S. M. Lee, Electrochem. Commun., 2004, 6, 465–469 CrossRef CAS.
- T. Zhang, J. Gao, L. J. Fu, L. C. Yang, Y. P. Wu and H. Q. Wu, J. Mater. Chem., 2007, 17, 1321–1325 RSC.
- M. Holzapfel, H. Buqa, W. Scheifele, P. Novák and F. M. Petrat, Chem. Commun., 2005, 1566–1568 RSC.
- W. Wang, K. M. Datta and P. N. Kumta, J. Mater. Chem., 2007, 17, 3229–3237 RSC.
- L. W. Ji and X. W. Zhang, Electrochem. Commun., 2009, 11, 684–687 CrossRef CAS.
- L. W. Ji and X. W. Zhang, Electrochem. Commun., 2009, 11, 795–798 CrossRef CAS.
- L. W. Ji and X. W. Zhang, Nanotechnology, 2009, 20, 155705 CrossRef.
- L. W. Ji, A. J. Medford and X. W. Zhang, J. Polym. Sci. Part B: Polym. Phys., 2009, 47, 493–503 CrossRef CAS.
- P. J. Goodhew, A. J. Clarke and J. E. Bailey, Mater. Sci. Eng., 1975, 17, 3–30 CrossRef CAS.
- Y. M. Kang, M. S. Park, J. Y. Lee and H. K. Liu, Carbon, 2007, 45, 1928–1933 CrossRef CAS.
- A. Eftekhari, R. C. Alkire, Y. Gogotsi and P. Simon, Nanostructured Materials in Electrochemistry, Wiley-VCH, Weinheim, 2008 Search PubMed.
- L. J. Zhi, Y. S. Hu, B. E. Hamaoui, X. Wang, I. Lieberwirth, U. Kolb, J. Maier and K. Müllen, Adv. Mater., 2008, 20, 1727–1731 CrossRef CAS.
- M. G. Kim and J. Cho, Adv. Funct. Mater., 2009, 19, 1497–1514 CrossRef CAS.
- H. Zhang, G. P. Cao and Y. S. Yang, Energy Environ. Sci., 2009, 2, 932–943 RSC.
Footnote |
| † Electronic supplementary information (ESI) available: ATR-FTIR spectra, DSC and TGA thermograms of pure PAN, Si/PAN, and Si/PAN/PLLA nanofibers; Raman spectra of pure CNFs, Si/CNFs (100/0), and Si/CNFs (85/15). See DOI: 10.1039/b912188a |
| This journal is © The Royal Society of Chemistry 2010 |
