Molecular dynamics simulations of atomically flat and nanoporous electrodes with a molten salt electrolyte
Received
26th August 2009
, Accepted 14th October 2009
First published on
7th November 2009
Abstract
The electric double layer (EDL) structure and capacitance have been studied for atomically flat and nanoporous conductive electrodes with a molten LiCl electrolyte using an electroactive interface molecular dynamics simulation methodology. For the atomically flat electrodes the electrolyte was observed to form a multilayer structure near the electrode described by exponentially decaying sinusoidal oscillations in ion and charge densities perpendicular to the electrode/electrolyte interface. The differential EDL capacitance vs. electrode potential was found to exhibit “U-shaped” behavior while the EDL capacitance exhibited complex dependence on electrode potential including regions of negative capacitance near zero electrode potential. Increased capacitance and an enhanced degree of electrode–electrolyte interface structure were observed with decreasing temperature. For nanoporous electrodes with both slit and cylindrical pore geometries, the electrolyte was observed to form highly structured alternating charged layers within the electrode nanopores. A maximum in the normalized (per unit electrode area) EDL capacitance was found for pore widths that accommodate several charged layers inside the pores. The observed dependence of capacitance on pore size appears to be a compromise between increasing structure/charge imbalance and decreasing ion density with decreasing pore width/diameter.
I. Introduction
Electric double layer capacitors (EDLCs) are promising energy storing devices outperforming electrochemical batteries in several aspects such as faster charging, increased life-time/cycle life, and higher delivered power.1 In contrast with electrochemical batteries where an electrochemical reaction is involved, the energy storage in EDLCs is achieved through non-Faradic electrostatic interactions. As a result, EDLCs can charge/discharge faster, have low impedance, cannot be overcharged, and have virtually an unlimited number of charge–discharge cycles. Currently, EDLCs, also referred to as supercapacitors, are commonly used in applications that require short, high power bursts of energy. Unfortunately, applications of EDLCs are limited by relatively low energy density. The energy density in supercapacitors can be increased by using porous electrodes with high specific surface area and by increasing the electrode capacitance per unit area.2 Substantial effort is being invested in finding porous-electrode and electrolyte combinations that maximize the energy densities with the goal of achieving energy densities of a few hundreds of W h g−1.3
In spite of the extensive experimental research in EDLCs, atomistic-level understanding of the structure of the electrolyte–electrode interface is rather limited. Theoretical advances4–8 have focused on understanding the fundamentals of the solvent-free ionic liquid (IL) electrical double-layers. A mean-field lattice-gas model for concentrated electrolytes was utilized by Kornyshev,4 while Oldham7 has built on the Gouy–Chapman–Stern approach and observed similar dependence of the differential capacitance on the applied voltage. Recent experiments9 and molecular dynamics (MD) simulations5,6 of model simplified systems have revealed that the differential capacitance curves are qualitatively similar to that predicted by Kornyshev’s theoretical treatment while an extension of the mean-field theory reproduced the simulated capacitance curve almost quantitatively.5 Thus it was found that the differential capacitance falls at potentials on either side of and far from the potential of zero charge (PZC), and the capacitance exhibits a local minimum at the PZC that results in a “camel-shaped” curve. These results are surprising as the Kornyshev mean-field approach4 does not incorporate ionic correlations, fluctuations or charge-density waves, nor does it take into account specific adsorption.
The general theory for IL behavior in nanometre size pores is even less developed. A recent theoretical analysis by Huang et al.10 has expanded previous theoretical treatments in order to account to the rise of the normalized (per unit area) capacitance with reducing pore size in the nanometre regime. In his analysis for cylindrical nanopores with sizes of less than ≈1 nm, (solvated or desolvated) counterions enter the pores and line up to form electric wire-in-cylinder capacitors giving rise to an increase of the normalized capacitance with decreasing pore size, while for the mesoporous regime (pores larger than 2 nm), the traditional model describing the charge of the double layer was used.
The vast majority of simulation studies of the structure of electric double layers (EDLs) and electrode–electrolyte interfaces have been performed utilizing a constant charge distribution on the electrode surfaces.5,6,11–13 This approach has the major drawbacks that (1) the electrostatic potential between the electrodes is not controlled during simulations and (2) the local electrode charge is not able to adjust to fluctuations in the local electrolyte structure. Perhaps most importantly for the work proposed here, it is not obvious for non-planar electrode geometries what fixed charge distribution should be assigned on the electrode to provide a realistic electrostatic potential. For ions in nanostructured electrodes with complex morphologies, such as in amorphous nanoporous carbon electrodes, we expect the charge distribution on the electrode (at constant potential) to depend significantly on the local environment.
A more realistic representation of the charge distribution on any arbitrary electrode geometry can be obtained if the electrode charges are allowed to fluctuate according to the imposed electrostatic potential and the local electrode/electrolyte structure in such a way as to maintain constant, controlled electrostatic potential on all electrode atoms. Recently, Madden and co-workers developed a methodology to perform molecular dynamics (MD) simulations under constant and controlled potential on an infinitely conductive electrode allowing equilibrium fluctuations of the electrode charges such that the total electrostatic energy is minimized.14 The authors tested their “electroactive interface” methodology on molten LiCl/KCl and LiCl/MgCl2 salts confined between two metallic electrodes and found EDL capacitance consistent with experimental data for similar molten salts.14
In this work, the electrode–electrolyte interface structure and the dependence of the EDL capacitance on applied potential for molten LiCl salt confined between atomically flat and nanoporous electrodes have been investigated using the electroactive interface MD simulation methodology. Molten LiCl, while not possessing all the complexities of molecular room-temperature ILs, is a reasonable, simple model to utilize (1) for implementation and validation of the electroactive interface methodology, (2) to obtain improved understanding of the behavior of electrode/electrolyte interfaces for atomically flat electrodes and (3) to carry out initial studies of the influence of electrode geometry on interfacial structure and EDL capacitance. The simulations presented here were performed within Madden’s framework14 to account for electrode polarization by allowing the electrode charges to fluctuate in order to control the applied potential difference between electrodes. A brief discussion of the utilized methodology and our specific implementation and approximations are given in the next section.
II. Simulation methodology
Simulations were performed at controlled potential difference between atomically flat and nanoporous electrodes at constant temperature. Rather than imposing a certain charge density on electrode surface and measuring the generated (fluctuant) potential, the charge distribution on the electrodes was allowed to fluctuate according to the electrostatic environment and the applied (and controlled) potential on conductive electrodes. The electrode charges and electrostatic energy are modified such that the electrostatic potential on each electrode atom is maintained at a constant and desired value for each integration step. The charge of each electrode atom was modeled as a Gaussian distributed charged centered on the atom,15| |  | (1) |
where ρi(r − Ri) is the electric charge density on an electrode atom i placed at the position Ri and 1/εi is the width of distribution.
The total electrostatic energy of the system, comprising two electrodes and an electrolyte, is given by
| |  | (2) |
where
Rij is the distance vector between two ions
i and
j in the initial box (corresponding to
k = 0),
k is the multiplicity of the initial
cell, and
kL is a multiplicity factor of the distance
Rij between ions
i and
j. The restriction labeled with * in the summation over
k indicates that the sum over atomic pairs
i,
j is constrained as
i ≠
j when
k = 0. The Gaussian cross-widths 1/
εij are given by:
| |  | (3) |
The delta symbol,
δ(
i,
G), is zero for a point charge and one if the charge is Gaussian distributed, and it explicitly excludes the Gaussian self-interactions

for charges that are not Gaussian distributed.
The first term in the expression of the electrostatic energy (eqn (2)) was solved using the standard Ewald summation techniques for a system of point charges in a 2D-periodic geometry16,17 employing the computationally expedient smooth particle mesh Ewald (SMPE) version.18,19 For the specific widths 1/εij used in this work (0.5 Å, similar to those used in ref. 14), the contribution of the second term is essentially negligible beyond a cut-off of 9–10 Å, therefore the complementary error function in eqn (2) was approximated as short ranged:
| |  | (4) |
In other words, the Gaussian distributed character of
electrode charges contributes to total electrostatic energy by an additional short ranged term, as given by right side of
eqn (4). However, if the Gaussian widths are larger than about 1/3 of the short-ranged cut-off, the effect of the left side term of
eqn (4) cannot be approximated as short-ranged, and a Ewald-like procedure could be employed to evaluate its long range contribution (see, for example, the appendix of
ref. 14). The main difference between our implementation and the Madden
e.g. formulation
14 consists in the approximation we utilized here given by
eqn (4).
The charges on electrodes were modified at each time-step, such that the electrode atoms are subjected to the same electrostatic potential Vi0 imposed on the electrodes, therefore ensuring control of the electrostatic potential difference between electrodes during the simulations. Changes in electrode electric charges are accompanied by changes in the total electrostatic energy as:
| |  | (5) |
where the

is the work required to generate the
electrode charges
qi,
i = 1…
v. The
electrode charges were evaluated by minimizing the total electrostatic energy
Ut with respect to the
electrode charges
qi,
i = 1…
v.
14 This leads to the following system of
k = 1…
v equations:
| | 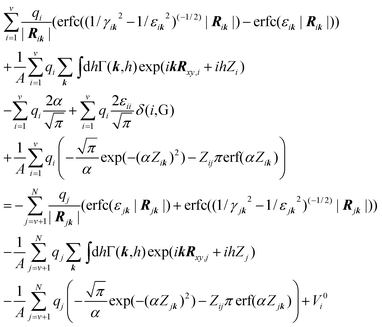 | (6) |
where
α is the Ewald screening parameter, the indices
i and
k run over the variable charges while the index
j runs for fixed (non-electrode) charges,
A is the cross-area of the system,
k is the Fourier space vector,
h is the integration step along the non-periodic
z-direction,
Zi is the position of charge
i in the
z-direction,
Zij is the distance between charges
i and
j in the
z-direction, and the
electrode charges
qi,
i = 1…
v are the unknowns. The quantity
γij is defined as:
| |  | (7) |
and the Fourier prefactor
Γ(
k,
h) is:
| |  | (8) |
Note that for a point charge
i,
εi is set arbitrarily large in
eqn (7). If, for example, both charges
i and
j are point charges, then the width 1/
γij given by
eqn (7) became equal with 1/
α as expected from a Ewald summation of an ensemble of point charges.
In our implementation, the second and the seventh terms of eqn (6) were evaluated using a 2D-SPME approach,20 while the fifth and sixth terms were evaluated via backward and forward beta-spline interpolation21 over a grid of roughly 1 point per Å along the z-direction employing the techniques described in ref. 19. A conjugate gradient method22 was utilized to numerically solve the system of equations given by eqn (6). We found that, without a preconditioner,23 6–20 iterations were sufficient to converge the solution to a precision of 10−6e for each individual charge.
The LiCl electrolyte was modeled by the force field described in ref. 24. The Cl− electrode van der Waals (vdw) interactions were chosen in this work to be equal to the Cl− vdw self-interactions, while Li-electrode vdw interactions were taken from ref. 24. The equations of motions were integrated with the velocity Verlet algorithm25 with a timestep of 1 fs. The temperature was controlled with a Berendsen thermostat26 having a coupling constant of 0.1 ps. Simulations presented here were between 1 and 4 ns long following 1 ns of equilibration. The positions of the electrode atoms for all electrodes were frozen during the simulations.
The profiles along asymmetry direction (z-direction) were evaluated by binning the properties of interest (e.g. density, charge) over 280 bins. The size of an individual bin was 0.31 Å, for the systems at 800 K and 900 K, and 0.36 Å for the system at 1300 K and flat electrode. The electrolyte charge densities shown here are given in units of electron charge per 100 Å2 cross-section area.
III. Results and discussion
In this section we present and discuss the structure of electrode/electrolyte interface, the dependence of EDL capacitance on electrode potential for non-porous electrodes, the structure of the electrolyte confined within nanoscopic slit and cylindrical pores the extent to which the normalized capacitance of the electrodes can be improved by controlling the size of the pores.
A System configuration for non-porous electrodes
The atomically flat (non-porous) electrode consisted of three close-packed atomic layers oriented such that the [111] crystallographic face is exposed toward the electrolyte. The distance between two closest neighbor electrode atoms is 2.58 Å. Each electrode consisted of 600 atoms. The electrode atoms were frozen during the simulations. The electrolyte consisted of 1728 Li+ and 1728 Cl− ions. The cross-section of the simulation cell was 36.5 Å × 36.5 Å. A snapshot of the simulation cell is shown in Fig. 1. The systems were studied at temperatures of 800 K, 900 K and 1300 K and potential difference between electrodes of ΔV = 0 V, 0.2 V, 0.4 V, 0.6 V, 0.8 V, 1 V, 5 V and 10 V. The z-dimension L are 66.8, 68.8 and 82.8 Å for 800 K, 900 K and 1300 K, respectively. These dimensions yield bulk electrolyte densities (i.e., densities of LiCl in the center of the simulation cell) that match the density of molten LiCl obtained from 3D periodic bulk liquid simulations using the same LiCl potential at the corresponding temperature and a pressure of 200 ± 100 atmospheres.
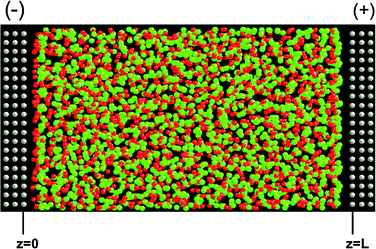 |
| | Fig. 1 A representative configuration of the system comprising atomically flat conductive electrodes and LiCl electrolyte. The grey, green and red spheres are the electrode atoms, Cl− and Li+ ions, respectively. The shown system is at ΔV = 10 V and 900 K. The minus and plus signs indicate the negative and positive electrodes, respectively. | |
B Electrode charge distribution in atomically flat electrodes
The electroactive interface methodology allows for fluctuations in electrode atom charges in order to maintain constant electrostatic potential. We have examined fluctuations in electrode atom charges for the system with ΔV = 10 V simulated at 900 K. Averaging over all atoms in each layer (see Fig. 1) over the length of the simulation, we obtain charges of −0.101e per atom for the layer located next to the electrolyte, −0.0029e per atom for the center layer and 0.00035e per atom for the outer layer (in contact with vacuum and the furthest away from electrolyte) for the negative electrode. Corresponding, positive charges were obtained for the positive electrode. Hence, roughly 95% of the electrode charge is distributed in the layer closest to electrode, i.e., the charge into a conductor is distributed at the surface of the conductor as expected.27 Following the charge on individual electrode atoms over the length of the simulation, we observe very large temporal fluctuations, with 2σ ≈ 75% of the mean charge, where σ is the standard deviation of the distribution. Clearly, these large temporal fluctuations in the charge would not be well represented by assuming equal, constant charges for the (surface) electrode atoms. We have also looked at spatial fluctuations in the electrode atom charges by examining the distribution of time-averaged electrode atom charges. Averaging of 4 ns yields a relatively narrow distribution with 2σ ≈ 2.5% of the mean. This result demonstrates that, in spite of the large instantaneous fluctuations, the charges on the electrode atoms in the surface layer are, on average, equivalent for the flat electrode, which is consistent with the geometrical equivalence of the (flat) electrode atoms.
C Electrode/electrolyte interface structure for non-porous electrodes
The response of the ionic liquid electrolyte to an external electric field (charged electrodes) is to structure itself near the electrode/electrolyte interface such that the bulk electrolyte fluid is effectively “screened out” from the influence of the field.28 As a result, the (plane-average) charge density q(z) in the bulk fluid (i.e., the fluid sufficiently far from the electrode/electrolyte interface) is constant and zero, as shown in Fig. 2a. The Poisson potential φ(z) along the z-direction, determined by numerically integrating the 1D Poisson equation,| |  | (9) |
is constant in the bulk electrolyte as shown in Fig. 2b, indicating that the applied electrostatic field, −∇φ, vanishes (i.e., it is screened out) away from the electrodes. The oscillations in the charge density vanish quickly with increasing distance from electrode, as shown in Fig. 2c, such that structure in the charge density is observed only near the electrode and not in the bulk electrolyte. Additionally, the cumulative charge density, determined by integrating the charge density from the outer layer of each electrode toward the center of the electrolyte, is zero in the bulk fluid, as shown in Fig. 2d, indicating that the charge on each electrode is completely screened out within a relatively small separation from the electrode surface.
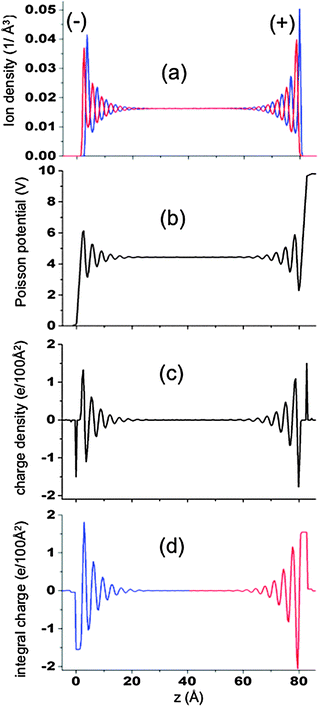 |
| | Fig. 2 (a) Ion densities, (b) Poisson potential, (c) charge density and (d) cumulative charge as a function of position relative to the electrode surface for the system with atomically flat electrodes. Results are for simulations at 1300 K and ΔV = 10 V. The red and black lines in (a) represent the Li+ and Cl− ions, respectively. The signs (−) and (+) indicated on the plot indicate the charge sign on electrodes. | |
Since the charge density q(z) is given by ρLi+ − ρCl−, i.e., the difference in the (plane-average) ion number densities, the oscillations in charge observed at each electrode/electrolyte interface (Fig. 2c) must necessary correspond to oscillations in the ion densities, as illustrated in Fig. 3 and 4. Fig. 3 shows ρLi+ and ρCl− at two voltages near the negative electrode, which Fig. 4 shows q(z) and the integrated charge density for the same systems. The multilayer structure of the fluid structure near electrode with successive ‘layers’ carrying alternative charge can clearly be seen. Similarly large oscillations in ion densities for ionic liquids near surfaces have been predicted theoretically14,30 and observed experimentally.29,30 At sufficiently large distances from the electrode for all voltages investigated the oscillations of Li+ and Cl− ions are out of phase by π radians, which means that electrolyte layers that contain a minimum of the concentration of one ion (e.g., Li+) will contain a maximum in concentration of the opposite sign ion (e.g., Cl−). However, the “dephasing” of the ion density profiles in the first one to two layers from the electrode is clearly dependent on the applied voltage. For small voltages the phase difference between the Li+ and Cl− densities are rather small in the first layer and increases with successive layers. At larger potentials, the increase in the strength of electrode–electrolyte electrostatic interactions results in significant dephasing of cations and anions even in the first layer.
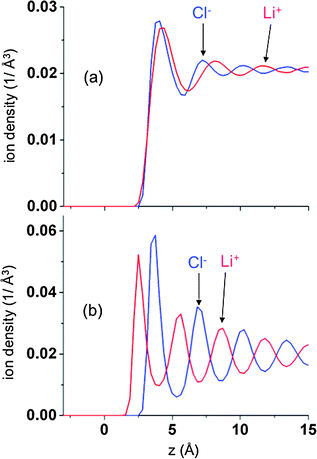 |
| | Fig. 3 The density profiles of Li+ (red lines) and Cl− (blue lines) as a function of position relative to the negative electrode for and ΔV = 0 V (a and c) and 10 V (b and d) at 900 K for atomically flat electrodes. | |
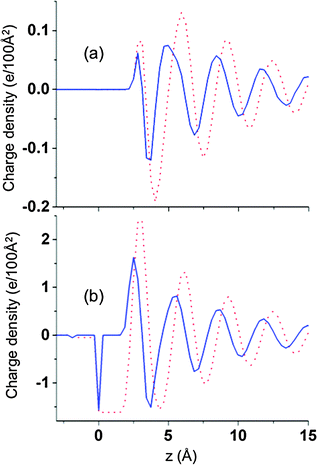 |
| | Fig. 4 Charge density (solid lines) and cumulative charge (dotted red line) as a function of position relative to the negative electrode for ΔV = 0 V (a) and 1 0 V (b) at 900 K for atomically flat electrodes. | |
As in the case of ion density profiles, the charge density profiles indicate a behavior within first several electrolyte layers from electrode that depends upon the applied voltage. At sufficiently large potentials (e.g. larger than about 1 V for our systems), when electrostatic interactions dominate, electrolyte layers with a net opposite sign charge form next to the electrode, while at small voltages, a first peak of positive charge is observed near both electrodes indicating an excess of Li+ near both electrodes. In order to elucidate the origin of charge density oscillations and the excess of Li+ near the positive electrode at low potentials, we ran simulations with an electrolyte of the type Cl+Cl−, where both ions had the same diameter and van der Waals interactions with the electrode, at zero electrode potential (and hence zero average electrode atom charge). For these systems, the oscillations in densities for the two electrolyte ions are in phase and have the same amplitude at all separations from the electrode, and accordingly, no oscillations in charge were observed beyond statistical noise. Therefore the imbalances in ion densities near the electrodes for zero (and low) potential and the resulting charge oscillations are due to the unequal van der Waals interactions with the electrode and different ion sizes for Li+ and Cl−.
The charge oscillations within the EDLs can also be understood qualitatively in terms of an “overscreening” effect. Examination of Fig. 4 shows that the negative electrode has a charge accumulation of −1.65e/100 Å2. At the outer edge of the first layer (where the charge density is zero), the accumulated charge is +2.47e/100 Å2, indicating that first layer has a net charge of +4.13e/100 Å2, much greater than that needed to screen the electrode. We note that current mean-field theories do not account for this “overscreening”, which is observed in our simulations even at low potentials. The electrolyte now “sees” an electrode + first layer with a net total charge of +2.47e/100 Å2, and responses with a negatively charged layer with a charge greater than −2.47e/100 Å2, i.e., the second layer has more charge than needed to screen the electrode plus first electrolyte layer, resulting a net accumulative negative charge at the outer edge of the second layer. Hence, an additional charged third electrolyte layer is required to compensate the charge excess after second layer, and so on. This successive “overscreening” continues with decreasing magnitude until finally there is no accumulative charge, i.e., the actual amplitude of these oscillations decreases below our range of detectability or below the amplitude of the stochastic fluctuations.
The asymptotic behavior (i.e., oscillator behavior beyond the first one to two electrolyte layers from electrode) of the local charge density can be described reasonably well by exponentially decaying sinusoidal oscillations:31
| |  | (10) |
where Δ
z is the distance from the
electrode surface,
λ is a screening length which is a measure of the distance over which the external field penetrates inside the electrolyte,
β is the periodicity of charge oscillations,
θ is a phase factor and
K is an amplitude dependent on the applied external field. The asymptotic behavior of the Poisson potential which corresponds to charge distribution given by
eqn (10), under the assumption of perfect screening (
i.e. no potential gradient in the bulk electrolyte) and bulk potential set to zero (in which case the EDL potential drop is set to the actual electrostatic potential on
electrode), consists of exponentially damped sinusoidal oscillations having the same periodicity and damping factor as the charge oscillations,
| |  | (11) |
but out-of-phase from charge oscillations by phase factor
ξ:
| |  | (12) |
The parameters
λ,
β and
θ were obtained by fitting to ln|
q(
z)| using the charge distributions
q(
z) from simulations, and excluding the first peak of the ln|
q(
z)| from the fit. The parameters
λa and
β are given in
Table 1.
Eqn (10) provides a reasonable description of the charge distribution within EDL beyond the first 1–2 layers, particularly at higher voltages where the out-of-phase ion density oscillations are well formed, as can be seen in
Fig. 5.
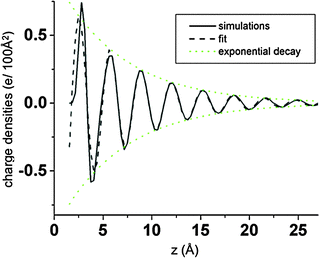 |
| | Fig. 5 Charge density from simulations and a fit of eqn (10) as a function of position relative to the negative electrode for ΔV = 5 V at 900 K for atomically flat electrodes. | |
Table 1 Dependence of λ and β (eqn (10)) on applied potential for atomically flat electrodes
| Temperature |
800 K |
900 K |
1300 K |
| Potential |
λ/Å |
β/Å |
λ/Å |
β/Å |
λ/Å |
β/Å |
| (−) |
(+) |
(−) |
(+) |
(−) |
(+) |
| 10 V |
7.0 |
7.0 |
3.17 |
6.2 |
6.0 |
3.2 |
4.3 |
4.3 |
3.3 |
| 5 V |
7.3 |
7.1 |
3.17 |
6.6 |
6.0 |
3.2 |
4.5 |
4.7 |
3.3 |
| 1 V |
7.1 |
6.8 |
3.17 |
7.1 |
6.9 |
3.2 |
4.5 |
4.2 |
3.3 |
| 0.8 V |
8.9 |
8.6 |
3.17 |
8.1 |
6.2 |
3.2 |
— |
— |
— |
| 0.6 V |
6.9 |
7.4 |
3.17 |
7.6 |
6.0 |
3.2 |
— |
— |
— |
| 0.4 V |
7.2 |
7.9 |
3.17 |
6.2 |
7.2 |
3.2 |
— |
— |
— |
| 0.2 V |
9.6 |
8.2 |
3.17 |
6.5 |
7.3 |
3.2 |
— |
— |
— |
| 0.0 V |
7.7 |
8.0 |
3.17 |
6.9 |
7.9 |
3.2 |
— |
— |
— |
As can be seen in Table 1, the screening length λ decreases with increasing temperature. This is expected because increased thermal motion at higher temperature diminished the amplitude of the structure oscillations within the EDL. Data from Table 1 indicate a decrease of screening length with temperature as  for voltages larger than 0.8 V. However, within the error of our fit, we have not identified a clear dependence of the screening length on the applied field. The periodicity of the structural oscillations, β, is independent of the applied potential. Values of β are comparable to the Li+–Cl− contact separation as observed in bulk LiCl pair distribution functions. The slight increase of β with temperature is consistent with decreasing density with increasing temperature.
D Differential and EDL capacitance for non-porous electrodes
The capacitance is a measure of the energy stored in a capacitor. Two kinds of capacitances are frequently reported in literature: (i) the normalized electric double layer capacitances, CEDL, defined as the ratio between the electrode charge/unit electrode area and the electrode-bulk electrolyte potential difference,| |  | (13) |
and (ii) the normalized differential capacitances defined as the ratio between changes in charge/unit area on an electrode and the corresponding change in electrode potential:| |  | (14) |
The EDL potential is the potential drop across the electrode/electrolyte interface defined as,| | | VEDL = Velectrode − Vbulk | (15) |
The total potential difference between electrodes is controlled during the simulations and is related to the EDL potential for the positive and negative electrode as,| | | ΔV ≡ Vpositive-electrode − Vnegative-electrode = (Vpositive-electrode − Vbulk) − (Vnegative-electrode − Vbulk) = VEDL-positive − VEDL-negative | (16) |
Hence, while the total potential difference across the electrolyte is fixed in our simulations, the individual EDL potentials are not fixed and are not typically equal, i.e., generally VEDL-positive ≠ |VEDL-negative|. This can be seen clearly in Fig. 2b. The differential capacitances were evaluated by fitting the electrode charge as a function of EDL potential with a fourth-order polynomial function and differentiating the fitted Qelectrode(VEDL-electrode) with respect to EDL potential. We verified that the fitted Qelectrode(VEDL-electrode) yields an EDL potential for zero electrode charge (potential of zero charge, or PZC) of −0.12 V, which is the same as the EDL potential at an imposed potential between the electrodes of 0 V. As shown in the inset of Fig. 6b, the PZC does not depend on the temperature for the range investigated here.
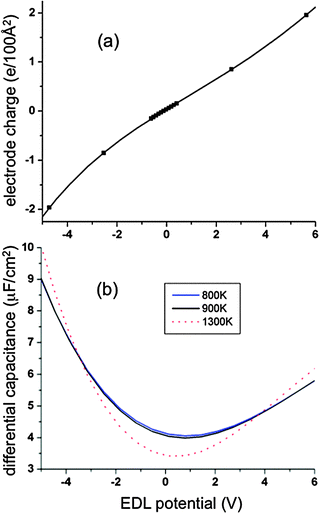 |
| | Fig. 6 Normalized electrode charge (a) and normalized differential capacitance (b) as a function of electrode potential for atomically flat electrodes. For panel (a), the solid line is a fourth-order polynomial fit and the symbols from simulations at 900 K. For panel (b), the blue, black and red lines are for temperatures of 800 K, 900 K and 1300 K, respectively, as obtained from the fitted charge distributions shown in (a). | |
The electrode charge per unit electrode area is shown in Fig. 6a as a function of EDL potential. The normalized differential capacitance as a function of EDL potential is shown in Fig. 6b. The differential capacitance has a “U-shaped” character with a minimum near the PZC. Qualitatively, the dependence of the differential capacitance on EDL potential appears to be in agreement with the predictions from mean-field models like the Gouy–Chapman model.32 In the Gouy–Chapman model, the electrode–electrolyte interface is sharp, followed by a finite Debye (double layer) length. In the Gouy–Chapman–Stern model33 an additional inner adsorbed layer next to the electrodes is considered. In these models the charge distribution across the diffuse layer has the shape of a Boltzmann distribution with respect to the Poisson potential ϕ(z),
| |  | (17) |
that indicates an exponential increase of the local charge density with an increase of the local Poisson potential. In reality, the number of ions that can be accommodated in a certain electrolyte layer (or in the layer next to the
electrode) should be limited by the ionic sizes. Kornyshev
4 accounted for the ionic volume that inherently limits the number of ions in the innermost layer. According to Kornyshev’s model, the charge variation across EDL varies as:
| |  | (18) |
For the high ionic densities investigated in our simulations (and hence a multilayer structure of the EDL) the shape of charge density profile as a function of Poisson potential has a completely different character than the assumed distributions in the Gouy–Chapman or Kornyshev’s models, as illustrated in
Fig. 7. Both simulations and
eqn (10) and (11) yield a complex, spiral-shape dependence of
q(
z) on
ϕ(
z) rather than a simple monotonic function as predicted by various mean-field theories (
e.g.,
eqn (17) and (18) and
ref. 34). Hence, a U-shaped character of the differential capacitance with respect to EDL potential does not necessarily validate the predictions of these mean-field models regarding the structure of the EDL: this behavior is clearly possible for EDLs with much more complex structure than that predicted by these mean-field models, and therefore it could be assumed as a more general property rather than a strict consequence of the assumptions of mean-field
electrode models.
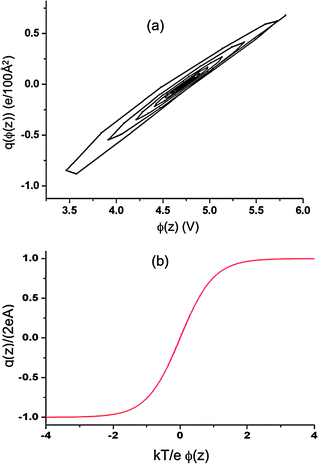 |
| | Fig. 7 (a) Charge density within the EDL as a function of Poisson potential within the EDL from simulations of a system with atomically flat electrodes at 800 K and ΔV = 10 V. Both charge densities and Poisson potential within EDL were obtained from simulations as a function of our asymmetry direction (z-axis). The plot is obtained by treating the z-position as a parametric variable thereby allowing for representation of the relationship between charge density (within the EDL) on the Poisson potential (within the EDL). The inset shows the monotonic dependence of the charge density on Poisson potential predicted by eqn (18). | |
The U-shaped behavior (i.e., a minimum near the PZC and no saturation at high and low EDL potentials) of the differential capacitance as a function of electrode potential observed in this work is in contrast to results of previous Monte-Carlo simulations5,6 of symmetric and asymmetric molten salts that predicted symmetric and asymmetric “bell-shaped” character (i.e., a maximum near the PZC) of the differential capacitance as a function of electrode potential. A further Monte-Carlo simulation study8 of the temperature and density dependence of the differential capacitance of a restricted primitive model of molten salt, in which ions were represented as hard spheres with point charges, yielded a maximum in the differential capacitance near the PZC (i.e., bell-shaped behavior) for high ionic densities and low temperature, while a minimum near the PZC was observed at lower density and high temperature. We note that in all of these studies the ions had only repulsive interactions (exclusive of electrostatic interactions) with each other and with the electrode. Behavior more similar to that observed in our simulations was reported for simulations of the room temperature ionic liquid [1-butyl-3-methylimidizolium nitrate] sandwiched between flat electrodes,12 where at the positive electrode the differential capacitance increases sharply with increasing electrode potential, while at negative electrode, the differential capacitance varies only weakly with electrode potential. The qualitative difference in the dependence of difference capacitance on electrode potential observed in our study from these other simulation studies is likely attributable to differences in the van der Waals interaction of the electrolyte with the electrodes (we have included attractive dispersion interactions in our simulations), as well as differences in cation–anion interactions and relative ion sizes. We note that both bell-shaped and U-shaped character (as in our study) have been observed experimentally on metal and glassy carbon electrodes.35–38 It is interesting to note the rather large EDL potentials of +5 V to −5 V for which the U-shaped character of the EDL differential capacitance was observed in our simulations. Experimental results for molecular ionic liquids at room temperature shows the U-shaped character over smaller electrode potentials of 1–2 V with saturation of the differential capacitance at higher electrode potentials.34
Fig. 8 shows the normalized EDL capacitances as a function of EDL potential. In agreement with experimental work39 and prior simulation studies of LiCl/KCl system14 and molecular ionic liquids,12 we found a discontinuity of the individual electrode capacitances at small electrostatic potential between electrodes. The origin of this discontinuity arises from the dependence of the potential across the electrode/electrolyte interface on the differences in van der Waals interactions between Li+ and Cl− with the electrode atoms, the different sizes of Li+ and Cl−, and the definition of EDL capacitance. For example, for the system at 900 K and zero imposed potential difference between electrodes (and hence zero charge on the electrodes), the actual potential of the bulk phase is about 0.12 V higher than the potential on either electrode due to unequal density profiles of Li+ and Cl−. This leads to an EDL potential of −0.12 V, and hence a PZC of −0.12 V. Note that for the symmetric Cl+Cl− system (see Section III.C), zero applied voltage leads to no net local charge density in the electrolyte, and hence a bulk potential of zero and PZC = 0. When the potential difference between electrodes is increased from zero volts, one electrode will begin to accumulate positive charge while the other accumulates an equal negative charge. For small enough applied voltages, such as for Fig. 9a and b, the EDL potential remains negative at the positively charged electrode, resulting in negative EDL capacitance (eqn (13)). For slightly higher applied potentials the EDL potential becomes zero, yielding infinite electrode capacitance defined by eqn (13). At still higher applied potentials between electrodes, as in Fig. 9c and d, both the charge and EDL are positive, yielding finite, positive effective electrode capacitance.
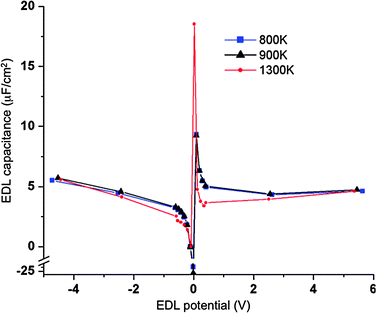 |
| | Fig. 8 Normalized electric double layer capacitance as a function of electrode potential for systems with atomically flat electrodes. The blue, black and red lines/symbols are for temperatures of 800 K, 900 K and 1300 K, respectively. Symbols are from simulations while the lines serve to guide the eye. | |
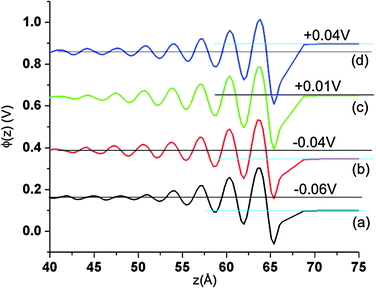 |
| | Fig. 9 The Poisson potential near the positive electrode for systems with atomically flat electrodes for several small applied voltages at 900 K. (a) ΔV = 0.10 V, (b) ΔV = 0.15 V, (c) ΔV = 0.25 V and (d) ΔV = 0.30 V. The potentials of curves (b), (c) and (d) are shifted by 0.2 V, 0.4 V and 0.6 V, respectively. The horizontal black line indicates the Poisson potential in the bulk fluid, while light blue horizontal line indicates the Poisson potential on the electrode. The numbers on the plot represent the differences between electrode and bulk potentials. | |
Aside from the large capacitances near zero electrode potential, which corresponds to rather small charge densities on the electrodes, the EDL capacitances vary in the range of 3 to 5 μF cm−2 (Fig. 8). Overall larger values of EDL capacitance at lower temperatures indicate that increased EDL structure at lower temperature can be correlated with an increase in capacitance.
For comparison purposes, we evaluated the normalized differential capacitance as a function of EDL potential using fixed charges on the electrode atoms. The electrode charges were assigned as follows: 95% on the electrode layer adjacent to electrolyte, 4% on the middle layer and 1% of opposite sign charge on the outermost electrode layer. This charge distribution was determined averaging over all electrode atoms in a given layer the individual temporally and spatially varying electrode charges over a 1 ns simulation. The normalized EDL capacitance shows the same features as those predicted in the constant applied potential simulations, namely (i) discontinuity in EDL capacitance near PZC, (ii) negative values and large values of capacitance for small electrode charges and (iii) the same range of capacitances (3–5 μF cm−2) for potentials above 0.2 V and ±10–20 μF cm−2 near the discontinuity point.
E System configuration for nanoporous electrodes
Recent experiments indicate the possibility of a non-trivial increase of the energy densities in supercapacitors by controlling the porosity of carbon electrodes.40 For pore sizes between 20 Å and 40 Å and an electrolyte comprising an organic salt in acetonitrile, a small linear decrease of normalized capacitance versus pore size decrease was observed.41 A similar trend was reported for the same electrolyte for pore sizes in the range 10 Å–20 Å. However, for pores less than 10 Å, hence small enough to match the ionic diameters, an anomalous increase in capacitance was observed suggesting the possibility of complete desolvation at insertion.42,43 Similar behavior was reported for ionic liquids in the absence of a solvent. For example, carbide derived carbon electrodes with a room temperature ionic liquid exhibited an increase of 80–100% in normalized electrode capacitance for pores comparable with ionic diameters.44 In this section we utilize our electroactive interface methodology to investigate the structure and dynamics of the molten LiCl electrolyte confined in nanometre sized spaces and the variation of normalized electrode capacitance with respect to pore size.
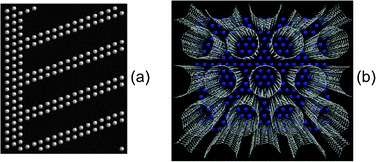
We studied both slit and cylindrical nanopore electrode geometries. The slit geometry electrode was generated from an fcc-crystal of the same atoms comprising the flat electrode discussed above. The distance between nearest neighbor atoms was d = 2.58 Å. Slit pores were created by removing several close-packed layers that were at an angle of 70.5° with respect to the xy-plane, as illustrated in Fig. 10a for slits of width 8.4 Å. In this geometry only the close-packed atomic layers were exposed to the electrolyte. The widths of the generated slits were  , where n is the number of successive layers removed. Slit widths of 4.2 Å (n = 1), 6.3 Å (n = 2), 8.4 Å (n = 3), 10.5 Å (n = 4), 18.9 Å (n = 8) and 35.8 Å (n = 16) were generated. The simulated systems consisted of 5400 Li+ and 5400 Cl− ions and 2400 to 4800 atoms for each electrode. The cross-section area (in xy-plane) of the simulation box was 51.6Å × 44 Å.
The cylindrical geometry electrode was generated by representing the electrode as a sequence of 33 Å long nanotubes. These nanotubes were distributed in the xy-plane in a close-packed configuration. The main cylinder axes were aligned parallel to z-direction. The nanotubes had the diameters of D = 5.4 Å, 6.9 Å, 10.8 Å, 13.5 Å, 16.3 Å and 21.7 Å. The outermost electrode layer was a slightly modified close-packed layer which confined the electrolyte in the desired space and consisted of 216, 256, 264, 264, 264 and 432 atoms, respectively, as illustrated in Fig. 10b for pores of diameter 8.1 Å. The nanotubes consisted, respectively, of 5376, 4480, 3584, 2240, 2688, and 3584 atoms per electrode. The number of electrolyte ions (half of which were Li+, half Cl−) were 6384, 6384, 7040, 5760, 8064, and 12![[thin space (1/6-em)]](https://www.rsc.org/images/entities/char_2009.gif) 672, respectively.
672, respectively.
All simulations using nanoporous electrodes were carried out at 1000 K and ΔV = 10 V. For each pore size/diameter, equilibration was carried out as follows. The system was initially set up with the electrolytes in contact with the electrolyte with no electrolyte in the nanopores. A potential of ΔV = 10 V was then applied. To facilitate insertion of the electrolyte in the pores, the distance between the electrodes was decreased by 20 Å over a period of about 100 ps, resulting in very high density and associated pressure for the electrolyte. The electrode separation was then increased over a period of 100 ps until the correct bulk electrolyte was achieved. This procedure was repeated several times until no further changes in the composition of the electrolyte within the pores was observed. For the smallest pore widths the insertion was accelerated by carrying out two insertion cycles at 3000 K, followed by several at 1000 K.
In the case of nanoporous electrodes, the inherent heterogeneity in the local electrode geometry will be reflected in the spatial distribution of the time-averaged charges on the electrode surface atoms; unlike the atomically flat electrodes, the surface atoms and hence their time-average charges are no longer equivalent. The distribution of time-averaged electrode charges for surface atoms of the slit electrode has a width of 2σ ≈ 10% of the mean charge while the cylindrical pores exhibit a charge distribution with a width of 2σ ≈ 25% of the mean charge. These relatively large widths of the time-averaged charge distributions indicate that the usual approach utilized for planar surfaces/electrodes of employing a uniformly distributed constant charge over the electrode surface may be inaccurate for the non-planar surfaces.
G Electrode/electrolyte interfacial structure in nanoporous electrodes
Fig. 11 and 12 show the structure of the LiCl electrolyte within the slit and cylindrical nanopores, respectively, for several nanopore sizes. It can be seen that a multilayer interface structure analogous to that which forms at the atomically flat electrode is manifested for the electrolyte within the nanopores. Because the width of electrode pores is comparable to the penetration length λ for the electrolyte (see eqn (10) and Table 1), the fluid is highly structured within the pores. For slit pores, a ‘sandwich-like’ electrolyte structure consisting of a sequence of parallel planar layers can be observed (Fig. 11). In each layer, one type of ion (either cation or anion) dominates and hence each layer carries an effective net charge. For the cylindrical pores, the electrolyte has an overall tendency to arrange in concentric cylindrical layers (Fig. 12), each of which is again dominated by either cations or anions and hence is charged.
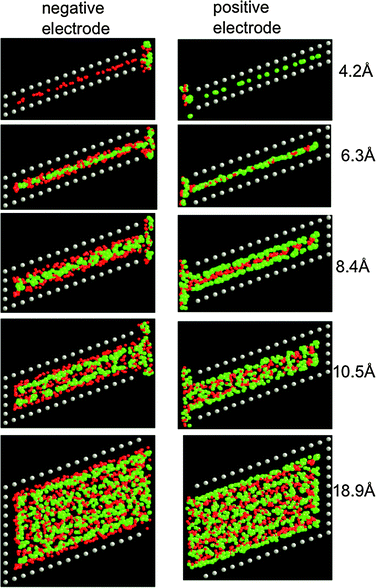 |
| | Fig. 11 Representative configurations of the electrolyte within slit pores for various slit widths (given in the figure) from simulations at 1000 K and 10 V. The red, green and grey spheres represent the Li+, Cl−, and electrode atoms, respectively. | |
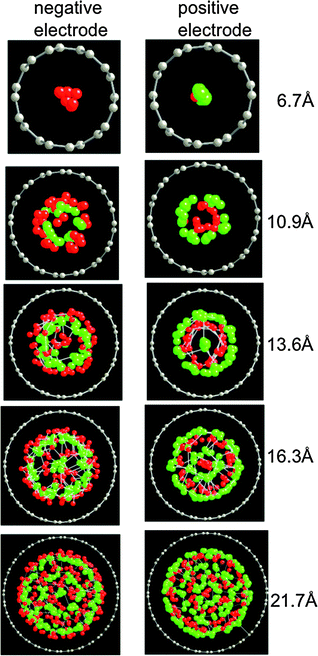 |
| | Fig. 12 Representative configurations of the electrolyte within cylindrical pores for various pore diameters (given in the figure) from simulations at 1000 K and 10 V. The red, green and grey spheres represent the Li+, Cl−, and electrode atoms, respectively. | |
The degree of structure of the confined electrolyte is also evident in the magnitude in the first peak in the pair distribution functions g(r) for ions within the pores, which are shown in Fig. 13. The degree of ion–ion correlation as evidenced by g(r) has a maximum for pore widths/diameters that allow several ion layers to form. For larger pores, ion–ion correlations reduce with increasing pore size and it can be anticipated that for sufficiently large pores correlations will approach those observed in the bulk electrolyte. For pores having width/diameter comparable with ion sizes, only Li+ ions were inserted in the pores of the negative electrode and only Cl− ions were inserted on the positive electrode (see Fig. 11a,b and 12a,b). In other words, the ions are nearly completely stripped of coordinating counterions during the insertion process into pores having widths small comparable to the size of the ions, facilitating complete ion segregation in the pores matching the ionic diameters. Ion desolvation upon insertion into pores matching the ionic diameter has been suggested as a possible mechanism to explain the large capacitances experimentally measured for pores of nanometre size.40,42 We also note that the ion–ion radial distribution functions for these very small pores, shown in Fig. 13, indicate a large (compared to bulk or larger pores) spacing between like-charged ions and a low ion density within the pores.
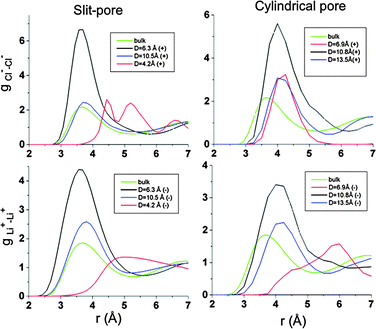 |
| | Fig. 13 Ion–ion radial distribution functions g(r) for ions within the nanopores for the slit pore electrode (left panels) and cylindrical pore electrodes (right panels). | |
H Normalized capacitance for nanostructured electrodes
Our simulations reveal that the normalized electrode capacitance for nanoporous electrodes is dependent on the pore size. The EDL capacitances for the negative and positive electrodes are given in Tables 2 and 3 for both the slit and cylindrical geometries. The optimal pores have about 25% larger normalized capacitance than the non-porous electrodes, even though the densities of the inserted electrolyte are only about half of that for the bulk electrolyte. Unlike what has been observed experimentally for room temperature ionic liquids,37 the pore diameters in our study that yield optimal normalized EDL capacitance do not correspond to the ionic sizes, but rather to sizes that allow several ionic layers to form within the pores.
Table 2 Normalized (per unit area) capacitance as a function of pore width for slit pores (1000 K, ΔV = 10 V)
| Width/Å |
4.2 |
6.3 |
8.4 |
10.5 |
18.9 |
Flat electrode |
| Normalized capacitance/μF cm−2 |
| Negative electrode |
4.5 |
5.1 |
6.0 |
6.2 |
5.5 |
5.2 |
| Positive electrode |
4.6 |
4.6 |
5.3 |
4.7 |
5.0 |
4.7 |
Table 3 Normalized capacitance as a function of pore diameter for cylindrical pores (1000 K, ΔV = 10 V)
| Width/Å |
5.4 |
6.9 |
10.8 |
13.5 |
16.3 |
21.7 |
| Normalized capacitance/μF cm−2 |
| Negative electrode |
1.4 |
1.9 |
2.3 |
4.3 |
3.8 |
3.7 |
| Positive electrode |
1.7 |
3.6 |
3.7 |
6.4 |
5.7 |
5.8 |
For the nanoporous electrodes, the majority of the electrode charge is offset by the net charge of the electrolyte within the pores. Hence, the larger the number density imbalance of electrolyte ions within the pores, the larger the net opposite charge that can be collected on electrode. Therefore, pore widths comparable with ionic diameters, which, as we showed, allow for a complete or almost complete segregation of ions within the pores for the high electrode potentials investigated, i.e., only Li+ in the negative electrode pores and only Cl− in the positive electrode pores, might be expected to generate the maximum charge density on the electrode for a given electrode potential, and hence the largest EDL capacitance. However, for the system studied here, electrostatic repulsion between ions in the narrowest pores results in a low density of ions within the pores. Hence the maximum in capacitance observed for pore widths that accommodate multiple layers of ions is due to the interplay of two opposite factors: (i) reducing the pore width increases the structure of the inserted electrolyte, which can stabilize greater charge imbalance in the inserted electrolyte, and (ii) reducing the pore results in a decrease in the density of ions within the pore, thereby reducing the total electrolyte (and hence electrode) total charge that can be achieved.
IV. Conclusions
Our molecular dynamics simulation studies of the EDL structure and capacitance for a simple molten salt ionic liquid electrolyte in contact with both atomically flat and nanoporous electrodes using an electroactive interface methodology reveal a tendency of the electrolyte to become highly structured at the electrode interface. This structure consists of alternating cation and anion rich layers that propagate several nanometres from the electrode interface for flat electrolytes, and form multilayer “sandwich-like” structures and concentric cylindrical structures within slit and cylindrical nanopores, respectively. While the observed EDL structure cannot be described with current mean-field theories, the U-shaped dependence of the normalized differential capacitance on electrode potential was found to be characteristically similar to those predicted by some of these theories. For the nanostructured electrodes, an optimum in normalized electrode capacitance was found for pore sizes that allowed the formation of several (usually three) ionic layers within the pore. Rather surprising is the fact that, for the optimal pore sizes in our simulations, the normalized EDL capacitance was somewhat higher (about 25%) than that for the atomically flat electrodes, even though the density of electrolyte within the pores was less than that found in the proximity of the planar electrode or in the bulk electrolyte. While even narrower pores allowed for greater charge balance within the pores (and therefore might be expected to generate larger EDL capacitance), this effect is offset by increased electrostatic repulsions between the same charge ions of the inserted electrolyte that diminished the ionic density achievable inside the nanopores. As a result, the dramatic increase of the EDL capacitance observed experimentally for pores that match the ionic diameters for RTILs was not observed in our simulations. It is possible that the lack of a maximum in the EDL capacitance for pores corresponding to the ionic diameter is a consequence of the simple, monatomic ionic liquid model utilized in our simulations and that different behavior will be observed in simulations utilizing models for molecular ionic liquids that have more diffuse charge and include dipole polarization effects.
Acknowledgements
Financial support provided by the U.S. Department of Energy under contract DE-AC02-05CH11231 on PO No. 6838611 is gratefully acknowledged.
References
-
B. E. Conray, Electrochemical Supercapacitors Scientific Fundamentals and Technological Applications, Kluwer Academic/Plenum Publisher, New York, Springer, 1999 Search PubMed.
-
(a) M. Winter and R. J. Brodd, Chem. Rev., 2004, 104, 4245 CrossRef CAS;
(b) A. G. Pandolfo and A. F. Hollenkamp, J. Power Sources, 2006, 157, 11 CrossRef CAS.
-
(a) Porous materials with high specific surface area of 2000 m2 g−1 combined with capacitances per unit area of 5–6 μF cm−2 could provide energy densities of order 100 F g−1; close to the range of the energy densities in batteries;
(b) Capacitances as large as 200 F g−1 were reported by: K. Babel and K. Jurewicz, J. Phys. Chem. Solids, 2004, 65, 287 Search PubMed;
(c) J. R. Miller and P. Simon, Science, 2008, 321, 651 CrossRef CAS.
- A. A. Kornyshev, J. Phys. Chem. B, 2007, 111, 5545–5557 CrossRef CAS.
- M. V. Fedorov and A. A. Kornyshev, J. Phys. Chem. B, 2008, 112, 11868 CrossRef CAS.
- M. V. Fedorov and A. A. Kornyshev, Electrochim. Acta, 2008, 53, 6835 CrossRef CAS.
- K. B. Oldham, J. Electroanal. Chem., 2008, 613, 131 CrossRef CAS.
- S. Lamperski, C. W. Outhwaite and L. B. Bhuiyan, J. Phys. Chem. B, 2009, 113, 8925 CrossRef CAS.
- V. Lockett, R. Sedev, J. Ralston, M. Horne and T. Rodopoulos, J. Phys. Chem. C, 2008, 112, 7486 CrossRef CAS.
- J. Huang, B. G. Sumpter and V. Meunier, Angew. Chem., Int. Ed., 2008, 47, 520 CrossRef CAS.
- C. Pinilla, M. G. Del Popolo, R. M. Lynden-Bell and J. Kohanoff, J. Phys. Chem. B, 2005, 109, 17922 CrossRef CAS.
- G. Feng, J. S. Zhang and R. Qiao, J. Phys. Chem. C, 2009, 113, 4549 CrossRef CAS.
- E. Spohr, Electrochim. Acta, 1998, 44, 1697.
- S. K. Reed, O. J. Lanning and P. A. Madden, J. Chem. Phys., 2007, 126, 084704 CrossRef.
- J. I. Siepmann and M. Sprik, J. Chem. Phys., 1995, 102, 511 CrossRef CAS.
-
(a) D. M. Heyes, Phys. Rev. B: Condens. Matter, 1994, 49, 755 CrossRef CAS;
(b) D. E. Parry, Surf. Sci., 1975, 49, 433 CrossRef CAS;
(c) D. M. Heyes, M. Barber and J. H. R. Clarke, J. Chem. Soc., Faraday. Trans. 2, 1977, 73, 1485 RSC;
(d) D. M. Heyes, J. Phys. Chem. Solids, 1980, 41, 291 CrossRef CAS;
(e) D. M. Heyes and F. van Swol, J. Chem. Phys., 1981, 75, 5051 CrossRef CAS;
(f) D. M. Heyes, J. Chem. Phys., 1983, 79, 4010 CrossRef CAS;
(g) D. M. Heyes, Phys. Rev. B: Condens. Matter, 1984, 30, 2182 CrossRef CAS.
-
(a) M. Kawata and M. Mikami, Chem. Phys. Lett., 2001, 340, 157 CrossRef CAS;
(b) M. Kawata and U. Nagashima, Chem. Phys. Lett., 2001, 340, 165 CrossRef CAS.
- U. Essmann, L. Perera, M. L. Berkowitz, T. Darden, H. Lee and L. G. Pedersen, J. Chem. Phys., 1995, 103, 8577 CrossRef CAS.
-
(a) M. Kawata, M. Mikami and U. Nagashima, J. Chem. Phys., 2002, 116, 3430 CrossRef CAS;
(b) M. Kawata, M. Mikami and U. Nagashima, J. Chem. Phys., 2002, 117, 3526 CrossRef CAS.
- M. Kawata, M. Mikami and U. Nagashima, J. Chem. Phys., 2001, 115, 4457 CrossRef CAS.
-
L. L. Schumaker, Spline Functions, Basic Theory, Krieger, Florida, 1993 Search PubMed.
-
(a)
W. H. Press, B. P. Flannery, S. A. Teukolsky and W. T. Wetterling, Numerical Recipes, CUP, Cambridge, 1992 Search PubMed;
(b)
J. R. Shewchuk, An Introduction to Conjugate Gradient Method without the Agonizing Pain, edn 1 1/4, 1994, http://www.cs.cmu.edu/~quake-papers/painless-conjugate-gradient.pdf Search PubMed.
-
Topic in Computer Mathematics 4 Preconditioned Iterative Methods, ed. D. J. Evans, Gordon and Breach Science Publishers, London, 1994 Search PubMed.
- A. Aguado and P. A. Madden, J. Chem. Phys., 2002, 117, 7659 CrossRef CAS.
- W. C. Swope, H. C. Andersen, P. H. Berens and K. R. Wilson, J. Chem. Phys., 1982, 76, 637 CrossRef CAS.
-
H. C. J. Berendsen and W. F. Van Gunsteren, Molecular Dynamics simulations: techniques and approaches, in Molecular Liquids Dynamics and Interactions, NATO ASI Series C135, Reidel, New York, 1984 Search PubMed.
-
J. D. Jackson, Classical Electrodynamics, John Willey and Sons Ins, NY, 1998 Search PubMed.
-
G. A. Martynov, Fundamental Theory of Liquids: Methods of Distribution Functions, Adam Hilger, Philadelphia, 1992 Search PubMed.
- R. Atkin and G. G. Warr, J. Phys. Chem. C, 2007, 111, 5162 CrossRef CAS.
- D. Wakeham, R. Hayes, G. G. Warr and R. Atkin, J. Phys. Chem. B, 2009, 113, 5961 CrossRef CAS.
- T. G. Desai, J. Chem. Phys., 2007, 127, 154707 CrossRef CAS.
-
A. J. Bard and L. R. Faulkner, Electrochemical Methods: Fundamentals and Applications, John Wiley & Sons Inc., New York, 2001 Search PubMed.
- D. C. Grahame, Chem. Rev., 1947, 41, 441 CrossRef CAS.
- D. Henderson and D. Boda, Phys. Chem. Chem. Phys., 2009, 11, 3882 Search PubMed.
- M. M. Islam, M. T. Alam, T. Okajima and T. Ohsaka, J. Phys. Chem. C, 2009, 113, 3386 CrossRef CAS.
- M. M. Islam, M. T. Alam and T. Ohsaka, J. Phys. Chem. C, 2008, 112, 16568 CrossRef CAS.
- M. T. Alam, M. M. Islam, T. Okajima and T. Ohsaka, J. Phys. Chem. C, 2008, 112, 16600 CrossRef CAS.
- Y. Z. Su, Y. C. Fu, J. W. Yan, Z. B. Chen and B. W. Mao, Angew. Chem., Int. Ed., 2009, 48, 5148 CrossRef CAS.
-
C. H. Liu, K. E. Johnson and H. A. Laitinen, Molten Salt Chemistry, Interscience, New York, 1964, pp. 681–733 Search PubMed.
- P. Simon and I. Gogotsi, Nat. Mater., 2008, 7, 845 CrossRef CAS , and references therein.
- C. Vix-Guterl, E. Frackowiak, K. Jurewicz, M. Friebe, J. Parmentier and F. Beguin, Carbon, 2005, 43, 1293 CrossRef CAS.
- J. Gamby, P. L. Taberna, P. Simon, J. F. Fauvarque and M. Cesneau, J. Power Sources, 2001, 101, 109 CrossRef.
- J. Chmiola, G. Yushin, Y. Gogotsi, C. Portet, P. Simon and P. L. Taberna, Science, 2006, 313, 1760 CrossRef CAS.
- C. Largeot, C. Portet, J. Chmiola, P. L. Taberna, Y. Gogotsi and P. Simon, J. Am. Chem. Soc., 2008, 130, 2730 CrossRef CAS.
|
| This journal is © the Owner Societies 2010 |
Click here to see how this site uses Cookies. View our privacy policy here. 


 for charges that are not Gaussian distributed.


 is the work required to generate the electrode charges qi, i = 1…v. The electrode charges were evaluated by minimizing the total electrostatic energy Ut with respect to the electrode charges qi, i = 1…v.14 This leads to the following system of k = 1…v equations:


 for voltages larger than 0.8 V. However, within the error of our fit, we have not identified a clear dependence of the screening length on the applied field. The periodicity of the structural oscillations, β, is independent of the applied potential. Values of β are comparable to the Li+–Cl− contact separation as observed in bulk LiCl pair distribution functions. The slight increase of β with temperature is consistent with decreasing density with increasing temperature.


 , where n is the number of successive layers removed. Slit widths of 4.2 Å (n = 1), 6.3 Å (n = 2), 8.4 Å (n = 3), 10.5 Å (n = 4), 18.9 Å (n = 8) and 35.8 Å (n = 16) were generated. The simulated systems consisted of 5400 Li+ and 5400 Cl− ions and 2400 to 4800 atoms for each electrode. The cross-section area (in xy-plane) of the simulation box was 51.6Å × 44 Å.
![[thin space (1/6-em)]](https://www.rsc.org/images/entities/char_2009.gif) 672, respectively.
672, respectively.


