Interplay of slow bath fluctuations and energy transfer in 2D spectroscopy of the FMO light-harvesting complex: benchmarking of simulation protocols
Benoit
Palmieri
,
Darius
Abramavicius
and
Shaul
Mukamel
*
University of California at Irvine, 1102 Natural Sciences 2, Irvine, California 92697-2025, USA. Tel: 949-824-7600E-mail: smukamel@uci.edu
First published on 10th November 2009
Abstract
Recently developed approaches to simulate environment-induced fluctuation effects in two-dimensional (2D) spectroscopy of excitons are compared for the Fenna-Matthews-Olson light-harvesting complex. Fast fluctuations induce population redistribution between exciton energy-levels and raise homogeneous line widths of various peaks in 2D spectra. These effects are easily accounted for in sum-over-eigenstates (SOS) approach and the quasi-particle (QP) scattering approach through relaxation and dephasing rate constants. Slow fluctuations cause correlations of energies at various delay times in 2D photon-echo spectra. These may be calculated either by doing cumulant expansion in SOS techniques or by statistical averaging over static disorder in SOS and QP approaches. We compare the 2D photon-echo signal simulated using two levels of cumulant expansion approaches and two statistical averaging approaches for the same system. These levels differ by the treatment of energy-level correlations at different delay times and give rise to different cross-peak shapes: the cross-peaks retain their original diagonally elongated shapes when correlations are included, while they are more spherically broadened when correlations are neglected. Statistical averaging over disorder give very similar results but requires much higher computational effort. The peak redistribution timescales are very similar for all levels of theory. The spectral signatures at these different levels of theory are compared and simulation cost is estimated. Approaches which do require statistical averaging over disorder are orders of magnitude slower.
I. Introduction
Two-dimensional (2D) spectroscopy projects four-wave mixing signals onto frequency–frequency correlation plots that carry information on the structure and the dynamics of molecules and their interaction with the surrounding.1 Of particular interest is the study of excited state coherent dynamics and population transport in chromophore aggregates.2–8 Spectra are usually simulated using the nonlinear response formalism combined with simplified models for the excitation and solvent dynamics. Dynamical information on the environment is obtained from the peak line shape. Elliptical diagonally elongated peak patterns reflect the interplay of homogeneous and inhomogeneous broadening. Arbitrary timescales bath fluctuations can be calculated using the Cumulant Gaussian Fluctuations (CGF)9,10 or the Redfield theory.11,12 Static fluctuations can be included by repeated calculations to generate an ensemble.Closed form approximate expressions for the femtosecond four-wave mixing of excitons were derived recently.13 These expressions include slow diagonal fluctuations through a second order cumulant expansion; ensemble averaging is avoided. Two levels of approximation were proposed and applied to simulate the response function of a model dimer including exciton transport. They assume different correlations between the slow bath coordinates. The first (here denoted sum over states SOS(A)) assumes an arbitrary degree of correlations between the slow diagonal bath coordinates but neglects the effects of the slow bath fluctuations on exciton transport. The second (SOS(B)) uses a single bath coordinate so that the slow diagonal fluctuations are fully correlated, but it is capable to include the Stokes shift. We shall compare them with two other levels of theory. The third level of theory is the standard CGF theory with static diagonal energy fluctuations incorporated by ensemble averaging (SOS(C)). The last level of theory is based on the quasiparticle representation (QP).12,14,15 Ensemble averaging is still necessary, but the calculations of doubly-excited states is avoided. The difference between the four theories mainly resides in the way they deal with the slow fluctuations giving rise to inhomogeneous broadening.
In this paper, we report a benchmark comparison of these four levels of theory by applying them to the FMO light-harvesting antenna.16,17 In section II, we briefly survey the advantages and cost of the four level of theories. In section III, we apply them to the photon echo kI = −k1 + k2 + k3 signal. We study the effect of the correlation between the slow bath coordinate and their effect on transport during the delay t2 and we compare the numerical cost. Section IV contains a discussion along with some concluding remarks.
II. Theory
The aggregate is described by the Frenkel exciton Hamiltonian,18,19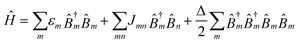 | (2.1) |
![[B with combining circumflex]](https://www.rsc.org/images/entities/i_char_0042_0302.gif) †m (m) Pauli operators create (annihilate) an excitation on site (or chromophore) m. They obey the boson commutation relation,
†m (m) Pauli operators create (annihilate) an excitation on site (or chromophore) m. They obey the boson commutation relation,| [m, †m] = δnm, | (2.2) |
The coupling with the bath has the form,
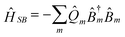 | (2.3) |
![[Q with combining circumflex]](https://www.rsc.org/images/entities/i_char_0051_0302.gif) m’s are collective harmonic bath coordinate operators which cause population transport and line broadening. Each bath coordinate is characterized by its spectral density,12
m’s are collective harmonic bath coordinate operators which cause population transport and line broadening. Each bath coordinate is characterized by its spectral density,12 | (2.4) |
 | (2.5) |
The induced polarization is expressed as a convolution of the three incoming, time-resolved, pulses with the third order response function as follows,
| P(3)(r,t) = ∫0∞dt3 ∫0∞dt2 ∫0∞dt1 R(3)(t3, t2,t1) E(r,t − t3) E(r,t − t3 − t2 − t1) | (2.6) |
The kI = −k1 + k2 + k3 signal is given as a sum of three terms represented by the Feynman diagrams shown in Fig. 1. These are denoted, “ground state bleaching” (GSB), “excited state emission” (ESE) and “excited state absorption” (ESA). The rules for these diagrams are given in ref. 12.
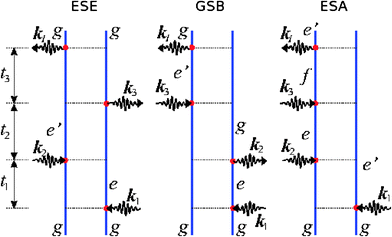 | ||
| Fig. 1 The Feynman diagram representation of the three Liouville-space pathways contributing to the kI response function. The three distinct pathways are denoted as Ground State Bleaching (GSB), Excited State Emission (ESE) and Excited State Absorption (ESA). | ||
A. Sum-over-states with uncorrelated slow fluctuations [SOS(A)]13
Here, we assume that each site is coupled to its own slow (but not necessarily static) bath coordinate. These coordinates are uncorrelated. Population transport during t2 is described by a Pauli master equation. The population rates are not affected by the slow coordinate. The effects of the slow fluctuations on the propagation during t2 which causes dynamic Stokes shift is thus neglected. The effect of the slow fluctuations on the response function is incorporated by a second order cumulant expansion. The response function is given by eqn (19) and (20) in ref. 13. It can be used for arbitrary bath time-scales, it includes fluctuation correlations between the time intervals t1 and t3 and ensemble averaging is avoided.B. Sum-over-states with correlated slow fluctuations [SOS(B)]13
This is similar to SOS(A) except that a single slow bath coordinate is coupled to all chromophores. Slow bath fluctuations are thus fully correlated and the dynamic Stokes shift is incorporated. The Pauli master equation describing population transport holds, since the population rate matrix is not modulated by the slow fluctuations. The resulting response function is given by eqn (29) and (30) in ref. 13 (or by eqn (164) and (179) in ref. 12). As in SOS(A), inhomogeneous broadening is incorporated without explicit ensemble averaging.C. Sum-over-states with static fluctuations [SOS(C)]9
Here, correlations of fluctuations between t1 and t3 are neglected. The response function is given by eqn (176) and (177) in ref. 12. Only fast bath fluctuations are included. By adding diagonal disorder to the Hamiltonian and ensemble averaging, the population transport rates are modulated by static disorder. The explicit ensemble averaging makes this procedure time-consuming compared to the previous two methods. This model has the same long t2 limit as SOS(B) when bath correlations completely decay.D. The Quasi-particle representation [QP]11
The fourth level of theory is fundamentally different from the sum over states methods. Excitation dynamics is described in terms of quasiparticles. This allows us to avoid the memory expensive computation of the doubly-excited eigenstates, which grows fast with the system size. The response function is expressed in terms of one-exciton Green’s function and a scattering matrix. The advantages of the quasiparticle representation are explained in ref. 12, 22. Briefly, the response function is obtained by solving a hierarchy of differential equations starting with the Heisenberg equation for the time-evolution of the expectation value of the polarization operator. These Nonlinear Exciton Equations (NEE) are closed by retaining terms contributing up to third order in an expansion of the response function in the external fields. The kI response function is given by eqn (124) of ref. 12. Population transport is calculated using the Redfield theory with the secular approximation12 which decouples populations and coherences. Both the population transport and homogeneous dephasing are calculated in the Markovian approximation. This level of theory neglects all correlations between fluctuations in the t1, t2 and t3 time intervals. It uses an even more restrictive approximation compared to the SOS methods; it assumes infinitely fast bath (Markovian) dynamics. Slow bath diagonal fluctuations are added to the Hamiltonian and the response function by averaging over many realizations of the diagonal disorder.III. Numerical results
We have performed a benchmark comparison of the 4 computation methods applied to the FMO light-harvesting complex (Fig. 2).16 The system consists of seven two-level chromophores embedded in a protein matrix. FMO is an excellent candidate for our benchmarking because the available model system parameters reproduce the experiment quantitatively.4,5,20,23,24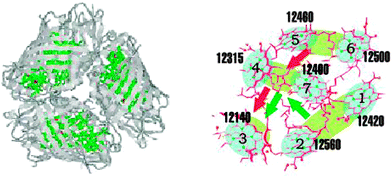 | ||
| Fig. 2 The FMO light-harvesting system. Left panel: a trimer where each member has 7 chromophores is shown with the embedding proteins. Right-panel: the 7 chromophores and their excitation energies. | ||
The following parameters were used:
(1) SOS(A): Each Chlorophyll is coupled to uncorrelated bath coordinates with Λ−1fast = 75 fs and λfast = 35 cm−1. Inhomogeneous broadening is included by an additional set of uncorrelated bath coordinates with Λslow ≈ 0 and with a system bath coupling of λslow = 33.75 cm−1.
(2) SOS(B): Same as method SOS(A), but inhomogeneous broadening is included by adding another set of Λslow ≈ 0 slow correlated bath coordinates with a system bath coupling of λslow = 10.0 cm−1.
(3) SOS(C) and QP: Each Chlorophyll is coupled to one type of uncorrelated bath coordinates all having Λ−1fast = 75 fs and a system bath coupling λfast = 35 cm−1. Inhomogeneous broadening is included by uncorrelated Gaussian diagonal disorder (σ = 60 cm−1) to the Hamiltonian and ensemble averaging over 500 realizations.
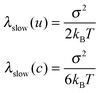
Λ−1fast = 100 fs and λfast = 55 cm−1 with static diagonal disorder of σ = 20 cm−1 were used in ref. 20 using the SOS(C). For these parameters, inhomogeneous broadening is smaller than homogeneous broadening. We used a different set of parameters which reproduce the experimental linear absorption and 2D spectra equally well, but whose inhomogeneous and homogeneous contributions to the line broadening are comparable. Simple approximate relations that connect λslow with variance σ can be derived for Λslow → 0 by analyzing the various line broadening expressions of SOS(A), SOS(B) and SOS(C) given in ref. 13,12:
 | (3.1) |
The absorption spectra are shown in Fig. 3. The agreement with experiment (see ref. 4) is very good, except for the QP, which shows larger line broadening. This is a consequence of the Markovian approximation. It overestimates the broadening for the Λ−1fast = 75 fs bath coordinate.
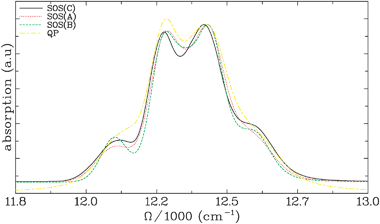 | ||
Fig. 3 Linear absorption spectra for the FMO light-harvesting complex calculated using the four levels of theory described in the text. All curves are normalized using the peak around 12![[thin space (1/6-em)]](https://www.rsc.org/images/entities/char_2009.gif) 400 cm−1. The line shapes predicted with the first three methods are similar. The SOS(A) and SOS(B) methods agree very well with each other and with SOS(C) in the regions of the two dominant peaks (between 12200 and 12500 cm−1). SOS(A) agrees very well with SOS(C) in the low energy shoulder region (≈12100 cm−1) and SOS(B) agrees very well with SOS(C) in the high energy shoulder region (≈12600 cm−1). The broadening that results from the QP is slightly too large. This results from the Markov approximation which is used to calculate the line shapes in the QP. 400 cm−1. The line shapes predicted with the first three methods are similar. The SOS(A) and SOS(B) methods agree very well with each other and with SOS(C) in the regions of the two dominant peaks (between 12200 and 12500 cm−1). SOS(A) agrees very well with SOS(C) in the low energy shoulder region (≈12100 cm−1) and SOS(B) agrees very well with SOS(C) in the high energy shoulder region (≈12600 cm−1). The broadening that results from the QP is slightly too large. This results from the Markov approximation which is used to calculate the line shapes in the QP. | ||
In Fig. 4, SOS(A) is used for three sets of bath coupling parameters that give very similar absorption spectra. Set 1 reproduces the set of parameters used in ref. 20. Here, λfast = 55 cm−1 and Λ−1fast = 106 fs while λslow = 5 cm−1. For this set of parameters, homogeneous broadening dominates. In set 2, λfast = 45 cm−1 and Λ−1fast = 90 fs while λslow = 16 cm−1. This choice increases the inhomogeneous broadening. Set 3 is the one that was used in Fig. 3 (SOS(A)): λfast = 35 cm−1 and Λ−1fast = 75 fs while λslow = 32.65 cm−1. The differences between the absorption spectra calculated with the three sets of parameters is rather small, highlighting that such fits are not unique. Hereafter, we focus solely on set 3, where inhomogeneous broadening is the largest.
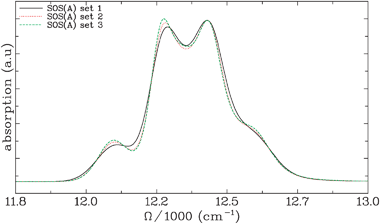 | ||
| Fig. 4 Linear absorption spectra for the FMO light-harvesting complex calculated using the SOS(A) level of theory with different bath coupling parameters. In set 1, λfast = 55 cm−1 and Λ−1fast = 106 fs while λslow = 5 cm−1. In set 2, λfast = 45 cm−1 and Λ−1fast = 90 fs while λslow = 16 cm−1 and in set 3, λfast =35 cm−1 and Λ−1fast = 75 fs while λslow = 32.65 cm−1. From set 1 to set 3, the importance of inhomogeneous broadening increases while the linear spectrum displays only small changes. | ||
The photon echo kI = −k1 + k2 + k3 spectra for short and large t2 are displayed in Fig. 5. SOS(A) and SOS(B) simulations are at least 500 times faster than SOS(C) and ∼100 times faster than the QP. All theories essentially show the same features at t2 = 0 and t2 = 200 fs. The QP has slightly larger homogeneous broadening (elongation of the peaks across the diagonal). The weak cross-peak that appears above the diagonal for SOS(A) and SOS(C) is stronger for correlated slow bath coordinate (SOS(B)). The t2 = 20 ps spectra show that, in all cases, the peak redistribution due to population transport occurs on very similar timescales, but the shapes of the peaks are different. The cross-peaks have an elongated shape in SOS(B), but are roughly circular in all other cases. This is not surprising because no matter where the excitations are transported after t2, the correlations between t3 and t1 are the same because of the fully correlated nature of the fluctuations. Hence, the line broadening of the redistributed off-diagonal peaks is expected to have the same elongated shape as the t2 = 0 diagonal peaks. For uncorrelated fluctuations, the correlation between t1 and t3 vanish for long t2 and the cross-peaks become circular.
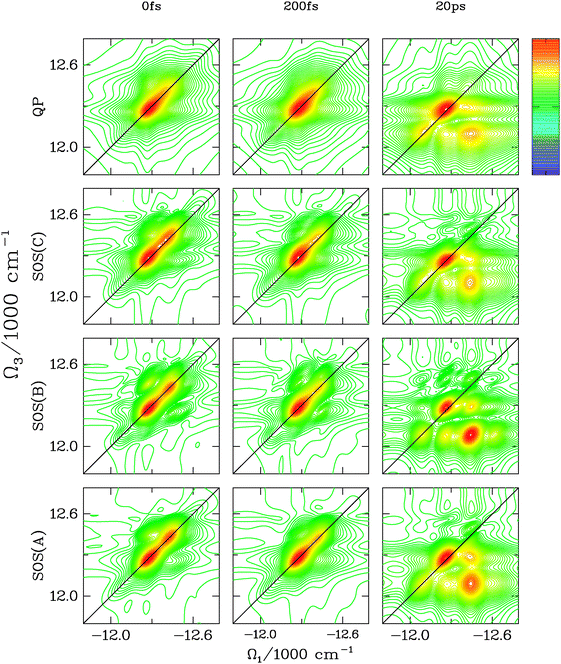 | ||
| Fig. 5 The kI spectra (absolute value) of FMO for t2 = 0 fs, 200 fs and 20 ps is reported for the 4 different transport theories. At t2 = 0 fs, the QP and SOS(B) differ from SOS(A) and SOS(C) which are very similar. The QP peaks are more broad whereas the dominant crosspeak in SOS(B) has a larger amplitude and is elongated along the diagonal. At t2 = 200 fs, only the QP gives qualitatively different results (broader peaks). At t2 = 20 ps, all theories capture the main features, but some finer details are different. The SOS(C) and SOS(A) techniques are quite similar in peak shapes although the intensity of the strongest cross peak is slightly larger in SOS(A). In SOS(B), the cross-peaks are elongated along the diagonal (the cross-peaks in SOS(A) and SOS(C) have a more circular shape) due to the correlated slow bath coordinate. In the QP, the diagonal peak is still too broad and the cross-peaks are similar to SOS(A) and SOS(C) but are slightly more elongated along Ω1. | ||
In Fig. 6, we use the pulse polarization configurations described in ref. 20 to separate the coherence dynamics from the population. Using the symmetry of the population pathways, the combination of RkI,xyyx–RkI,xyxy eliminates population contributions to the signal; only coherence contributions remain.20 From the top, the first and third row of Fig. 6 show RkI,xyyx–RkI,xyxy for SOS(B) and SOS(A), respectively. Coherences decay at similar timescales in both cases, but the difference in peak shapes is more evident in this representation.
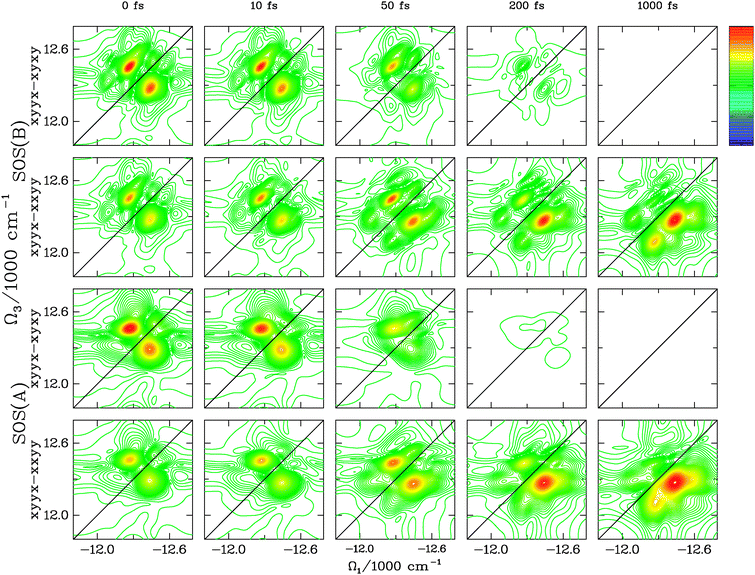 | ||
| Fig. 6 We compare the signal RkI,xyyx–RkI,xyxy that eliminates population contributions and the signal RkI,xyyx–RkI,xxyy that eliminates the coherent contributions to the ESE Liouville space pathway for the two transport theories SOS(A) (uncorrelated bath, bottom two rows) and SOS(B) (correlated bath, top two rows). We consider the following t2: 0 fs, 10 fs, 50 fs, 200 fs, 1000 fs. Obviously, the coherent dynamics decays on a much faster timescale. The shape of the peaks differs when the slow bath coordinate is correlated or uncorrelated. Again, for correlated bath, the peaks are elongated along the diagonal. Furthermore, the coherent dynamics decay on a faster timescale for the uncorrelated case. For the signal that probes the population (RkI,xyyx–RkI,xxyy), we observe the same features as in Fig. 5, the peaks redistribute with the same timescale for both transport theories and they appear elongated along the diagonal for the correlated case. | ||
The other two rows show the results of the technique RkI,xyyx–RkI,xxyy which, by symmetry, cancels the ESE coherent contributions to the signal.20 The remaining population peaks redistribute in a very similar manner and with the same time-scale for SOS(B) and SOS(A). Again, the peak shapes are strongly affected by the correlation of the bath.
In summary, the simulations shown in Fig. 6 highlight the difference in peak shapes predicted by the different theories at a finer level (by selecting specific Liouville-space pathways) and shows that the short-time scale under which the cross-peaks evolve is again very similar for SOS theories.
IV. Discussion
The present benchmark simulations show that SOS(A) and SOS(B) give very similar results for the kI signal for all t2’s considered (0–20 ps). Only the shape of the cross-peaks differ when the slow bath coordinate is correlated (SOS(B)). The predicted peak redistribution due to population transport is quantitatively similar for all levels of theory even when the effect of inhomogeneous broadening on transport is completely neglected (SOS(A)); an approximation that appears to be justified in the light of these results. The QP peak line shapes are too broad, indicating that the Markovian regime does not apply for the fast bath coordinate with Λ−1fast = 75 fs. SOS(A) allows any level of correlations for the bath coordinates. SOS(B) requires fully correlated slow fluctuations. To compare the two, we chose the fluctuations to be completely uncorrelated in SOS(A). To include partially correlated fluctuations, SOS(A) must be used.A technique with improved resolution that combines various signals to compare specific Liouville-space pathways (Fig. 6) shows that the shorter coherent lifetimes are almost identically predicted by different theories. Again, at these shorter time-scales, only the peak shapes differ because of the differences in the slow bath correlations. Fig. 6 shows that smaller amplitude peaks that are not observable in Fig. 5 also evolve in a very similar manner for both levels of theory.
SOS(A) and SOS(B) are superior since they cut down the computation time by two-orders of magnitude compared with SOS(C). These protocols require a large memory due to the explicit calculation of doubly-excited states in sum-over-states methods. Truncation procedures in the scattering matrix calculation make the QP to scale-more favorably with system size, but it requires explicit ensemble averaging for static fluctuations.
Our benchmark study is summarized in Table 1. For small aggregates, where computer memory is of no concern, SOS(A) and SOS(B) represent a very appealing and efficient procedure to simulate response functions. They reproduce the results of more expensive calculations, allow the inclusion of correlation for the bath coordinates and require significantly shorter running times. Note that the actual running time for simulating the SOS(C) response function in Fig. 5 on an average speed computer is about 2 days.
| Theory | Fast bath correlations | Slow bath correlations | Explicit Ens. Averaging | Speedup (cf to SOS(C)) | Pros and cons |
|---|---|---|---|---|---|
| SOS(A) | any | any | no | 500 | Pros: fast calculation |
| Cons: No Dynamic Stokes shift, approximate population rates | |||||
| SOS(B) | any | correlated | no | 500 | Pros: fast calculation, Dynamic Stokes shift included, exact population rates |
| Cons: Slow bath must be fully correlated | |||||
| SOS(C) | any | any | yes | 1 | Pros: Exact population rates, arbitrary disorder |
| Cons: Time-consuming | |||||
| QP | any | any | yes | 5 | Pros: Scales favorably with system size, exact population rates, arbitrary disorder |
| Cons: Time-consuming |
We have chosen a system where inhomogeneous and homogeneous broadening contributions to the response function are similar (set 3 in Fig. 4) and observed only small differences in the predicted spectra for all t2. When the homogenous broadening dominates (set 1 in Fig. 4), we expect an even stronger agreement with SOS(C). Moreover, SOS(A), which neglects the effects of inhomogeneous broadening on transport, will then be more adequate.
Acknowledgements
The support of the National Science Foundation (CHE-0745892) and the Chemical Sciences, Geosciences and Biosciences Division, Office of Basic Energy Sciences, Office of Science, U. S. Department of Energy is gratefully acknowledged.References
- S. Mukamel, Principles of Nonlinear Optical Spectroscopy, Oxford University Press, New York, 1995 Search PubMed.
- H. van Amerongen, L. Valkunas and R. van Grondelle, Photosynthetic Excitons, World Scientific, Singapore, 2000 Search PubMed.
- B. Gobets and G. R. van Grondelle, Biochim. Biophys. Acta, Bioenerg., 2001, 1507, 80 CrossRef CAS.
- T. Brixner, J. Stenger, H. M. Vaswani, M. Cho, R. E. Blankenship and G. R. Fleming, Nature, 2005, 434, 625 CrossRef CAS.
- G. S. Engel, T. R. Calhoun, E. L. Read, T. K. Ahn, T. Mančal, Y. C. Cheng, R. E. Blankenship and G. R. Fleming, Nature, 2007, 446, 782 CrossRef CAS.
- R. J. Cogdell and C. Mullineaux, Photosynth. Res., 2008, 95, 117 CrossRef CAS.
- H. Lee, Y.-C. Cheng and G. R. Fleming, Science, 2007, 316, 1462 CrossRef CAS.
- D. Zigmantas, E. L. Read, T. Mančal, T. Brixner, A. T. Gardiner, R. J. Cogdell and G. R. Fleming, Proc. Natl. Acad. Sci. U. S. A., 2006, 103, 12672 CrossRef CAS.
- W. M. Zhang, T. Meier, V. Chernyak and S. Mukamel, J. Chem. Phys., 1998, 108, 7763 CrossRef CAS.
- D. Abramavicius and S. Mukamel, Chem. Rev., 2004, 104, 2073 CrossRef CAS.
- V. Chernyak, W. M. Zhang and S. Mukamel, J. Chem. Phys., 1998, 109, 9587 CrossRef CAS.
- D. Abramavicius, B. Palmieri, D. V. Voronine, F. Šanda and S. Mukamel, Chem. Rev., 2009, 109, 2350 CrossRef CAS.
- D. Abramavicius, L. Valkunas and S. Mukamel, Europhys. Lett., 2007, 80, 17005 CrossRef.
- F. Spano and S. Mukamel, Phys. Rev. A: At., Mol., Opt. Phys., 1989, 40, 5783 CrossRef CAS.
- S. Mukamel, R. Oszwaldowski and D. Abramavicius, Phys. Rev. B: Condens. Matter Mater. Phys., 2007, 75, 245305 CrossRef.
- R. Fenna and B. Matthews, Nature, 1975, 258, 573 CrossRef CAS.
- W. B. R. A. J. Li and Y.-F. Zhou, J. Mol. Biol., 1997, 271, 456 CrossRef.
- A. Davydov, Theory of Molecular Excitons, McGraw-Hill, New York, 1962 Search PubMed.
- E. Rashba and M. Sturge, Excitons, Elsevier, New York, 1987 Search PubMed.
- D. Abramavicius, D. V. Voronine and S. Mukamel, Biophys. J., 2008, 94, 3613 CrossRef CAS.
- B. Palmieri, D. V. Abramavicius and S. Mukamel, J. Chem. Phys., 2009, 130, 204512 CrossRef.
- W. Zhuang, T. Hayashi and S. Mukamel, Angew. Chem., Int. Ed., 2009, 48, 3750 CrossRef CAS.
- R. J. W. Louwe, J. Vrieze, A. J. Hoff and T. J. Aartsma, J. Phys. Chem. B, 1997, 101, 11280 CrossRef CAS.
- S. Vulto, M. de Baat, R. Louwe, H. Permentier, T. Neef, M. Miller, H. van Amerongen and T. Aartsma, J. Phys. Chem. B, 1998, 102, 9577 CrossRef CAS.
| This journal is © the Owner Societies 2010 |