Protein nanopatterning and release from gold nano-cavity arrays†
Colm T.
Mallon
,
Bincy
Jose
,
Robert J.
Forster
* and
Tia E.
Keyes
*
School of Chemical Sciences, National Centre for Sensor Research, Dublin City University, Dublin 9, Ireland. E-mail: tia.keyes@dcu.ie; Tel: +3531 7008185
First published on 9th November 2009
Abstract
Selective chemical modification of a gold nano-cavity array is achieved via nanoscale templating to create fibrinogen patterned cavities with a polyethylene glycol modified top surface. Application of a reducing potential to the array readily releases the protein from the cavities.
The capacity to produce extended regions of nanoscale patterned protein on surfaces is of key importance across a number of chemically and biologically important applications including sensor development, proteomics and bioengineering.1 However, e-beam2 or photo-lithographic3 approaches conventionally used to create patterning are expensive, while soft lithographic routes such as microcontact printing4 and dip-pen lithography5 can be restrictively slow when applied to macroscopic areas. Use of nanoscale templates is a particularly promising alternative for patterning biomolecules over larger areas, for example Reimhult et al. recently reported on an elegant method for protein nanopatterns on TiO2–SiO2 surfaces using polystyrene beads as a template.6 Patterning of a biomaterial such as a protein or antibody inside a metal nano-cavity is particularly attractive as the metal surface may permit electrochemical addressability, which can be exploited in sensing or as described here, in stimulated release of adsorbate.
Furthermore, nanopatterned metal nano-cavities offer the possibility for exploiting metal surface plasmons for enhancement of spectroscopic signals.7–9 In addition, the use of curved surfaces for deposition increases the surface area available for protein adsorption. Herein, we describe a simple approach to nanoscale patterning of metal with protein that relies on nanosphere lithography combined with selective surface modification.
Nanosphere lithography is an efficient and reliable route to generation of metal nanostructured surfaces. This technique involves the creation of a 2-dimensional template of, for example, polystyrene spheres on a surface through which metal is deposited by electrochemical or vapour methods, to fill the void space between the particles to leave a spherical cap nano-cavity array when the polystyrene spheres have been removed.7,8 Here, we demonstrate that the templating spheres can be exploited to permit the top surface and inside of the cavity to be independently and selectively modified by forming self-assembled layers before and after template removal. Although self-assembled monolayers have been reported recently on silver arrays,10 this is to our knowledge the first example of this approach for nanopatterning.
Scheme 1 shows the approach by which selective modification of a metal nano-cavity array is achieved; the detailed procedure is described in ESI†. After self-assembly of a 2-dimensional template of polystyrene spheres (820 nm) on a planar gold surface, the void space is filled by electrodeposition of gold such that the cavity depth is approximately 600 nm (see ESI†). Modification of the top surface of the array is then accomplished by exposure of the assembly to a solution of surface active adsorbate, in this example 1-nonanethiol or a thiolated polyethylene glycol, O-(2-mercaptoethyl)-O′-methyl-hexa(ethylene glycol). Critically, this step is performed before sphere dissolution, so that the interior walls of the cavities remain unmodified. The spheres are then removed by dissolution in THF, after which point the inside walls of the cavities can be functionalized using a second adsorbing species. Because of strong plasmonic enhancement from the array, surface enhanced Raman spectroscopy was performed before and after sphere removal to verify the presence of pre-adsorbed thiols (see ESI†). Both polystyrene modes and modes attributed to the 1-nonanethiol are evident after assembly, at point C in Scheme 1. Whereas after sonication of the array in THF to remove the template, point D, the polystyrene modes are lost leaving a spectrum attributable to 1-nonanethiol alone.
 | ||
| Scheme 1 Preparation of selectively modified nano-cavity arrays; (A) assembly of polystyrene spheres (820 nm) on a planar gold surface and SEM image of this template, (B) electrochemical deposition of gold between sphere voids, (C) modification of the exposed top surface of the array with the desired thiolated compound, (D) removal of polystyrene spheres by sonication in toluene and SEM image of the resulting nano-cavity array, (E) modification of the internal cavity walls with a different surface binding compound. | ||
To confirm that surface modification is selective, as intimated in Scheme 1, it is important to confirm that the initial adsorption step leading to modification of the top surface of the array, i.e. with the spheres present in the structure, does not lead to modification of the interior cavity walls. This was assessed by quantifying the surface area modified during the adsorption steps by reductive desorption. Fig. 1 shows voltammograms of the reductive desorption of a thiol layer assembled before and after sphere removal. Curve A of Fig. 1 shows a CV of the nano-cavity array in 0.5 M KOH following top-surface modification by 1-nonanethiol prior to removal of the spheres (i.e. step C in Scheme 1). Two peaks at −0.917 and −1.035 V vs. Ag/AgCl are observed, which correspond to the electrochemical desorption of the 1-nonanethiol layer. The number of processes and their peak potentials are consistent with thiol desorption at a polycrystalline gold surface.11 The spheres were then removed in THF and the 1-nonanethiol layer was re-formed this time on both the top and inner surfaces. Curve B of Fig. 1 shows the reductive desorption of this layer. The voltammetric behaviour is analogous and two reductive peaks at −0.933 and −1.061 V are observed. However, the charge passed during this second desorption step is significantly larger than that observed for the array with the polystyrene spheres present. When the spheres are present 30 μC is passed during the reduction step, compared with 143 μC after sphere removal and thiol readsorption. The significant increase in the amount of charge needed to desorb the thiol layers formed in the absence of the templating spheres confirms that the spheres are effective at protecting the interior walls of the cavities from contact with the surface active species. The ratio of top versus interior surface area can be estimated from this experiment as 1 : 4, which is in good agreement with the expected ratio of approximately 1 : 5 (see ESI†) and confirms, as expected, that dissolution of the spheres in ethanol is negligible. Therefore, the vast majority of the cavities remain blocked during the initial adsorption step and are subsequently available for modification after sphere removal.
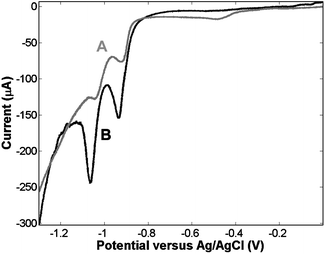 | ||
| Fig. 1 CV showing reductive desorption, in 0.5 M KOH, of 1-nonanethiol assembled at a 0.5 cm2 nano-cavity array electrode. Curve A represents desorption seen following thiol assembly before sphere removal. Curve B represents desorption following thiol assembly in the absence of the templating spheres i.e. across the entire surface. | ||
To investigate the possibility of applying this approach to patterning of protein into the cavities of the array, Oregon Green (OG) labelled fibrinogen was exploited. A fluorescently labelled protein was used because, as described in our previous work, such gold nano-cavity arrays can be used to enhance the luminescence of luminophore encapsulated within the pore.12 This is potentially useful in biosensing applications and allowed protein assembly and release to be probed by confocal fluorescence microscopy. Key to the success of this approach is the use of a protein resistant layer to prevent adsorption of protein on the top surface of the array. PEG layers have been shown to be extremely effective at inhibiting fibrinogen adsorption.13 The arrays were produced as before, with modification of the top surface this time with a thiolated PEG adsorbate (O-(2-mercaptoethyl)-O′-methyl-hexa(ethylene glycol)) prior to sphere removal. After sphere removal, the arrays were exposed to an aqueous 50 μM solution of OG fibrinogen for 30 min. During this period the OG fibrinogen physically adsorbs inside the gold pores to create a strongly luminescent surface layer. Fig. 2 shows a fluorescence image of the resulting selectively modified nano-cavity array using an excitation wavelength of 488 nm. Fluorescent spots, whose spectra correspond to that of the OG emission from inside the cavities, are clearly visible. In contrast, little fluorescence is observed from the top surface of the array, indicating the absence of adsorbed fibrinogen at this region. This is attributed to effective blocking of fibrinogen by the protein resistant PEG–thiol layer. Scanning in the x-direction across the array, the width of this emission profile (see inset of Fig. 2) is approximately 750 nm which is in good agreement with the width of the cavity openings determined using SEM (700 nm).
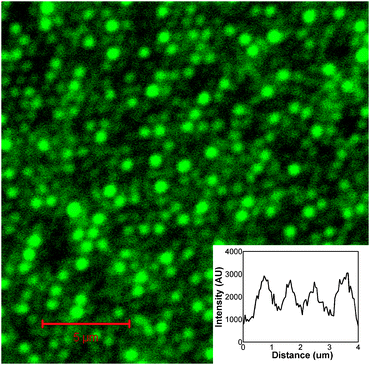 | ||
| Fig. 2 Fluorescence microscopy image of nano-cavity arrays selectively modified with PEG–thiol on the top surfaces and Oregon Green fibrinogen at the interior cavity walls. The wavelength of excitation was 488 nm. The inset shows an intensity profile across the array. | ||
The capacity to release protein from a patterned surface may also be useful in sensing, biodelivery or for example for decontamination of a reusable substrate for sensing. As the substrate is metal this permits application of electrochemical potential to the array. The fluorescence of the protein within the nano-cavity permitted facile study of the release of the fibrinogen localized in the nano-cavities on application of a negative potential. Fig. 3 shows the fluorescence intensity of OG labelled fibrinogen emission as a function of time collected by confocal microscopy, at the nano-cavity array when the potential is biased to −1.2 V (versus Ag/AgCl sat. KCl). For comparison, release of OG labelled fibrinogen from planar gold coated silicon wafers under identical conditions is also presented.14Fig. 3 shows that application of this potential causes an immediate decrease of the fluorescence from the protein within the nano-cavity. This is attributed to release of the protein from the surface and its diffusion out of the confocal volume of the microscope. The decay profiles indicate that the protein can be electrochemically released from the cavities as demonstrated at a planar surface.14 However, the process appears significantly slower at the patterned surface. This may be due to trapping of the protein inside the cavity, where its emission remains enhanced.13 As the size and relative separation of the cavities can be controlled by appropriate choice of templating sphere, it may be possible to control the release patterns of the protein by modifying the array structure. For example, if 200 nm cavities were employed, released protein from each cavity would theoretically merge together in 100 μs, based on the root mean square displacement ((2Dt)1/2) of the protein,15 whereas the time needed for this process to occur at cavities formed from a 20 μm sphere template would be approximately 1 s. This possibility is currently being explored.
 | ||
| Fig. 3 Time dependence of the fluorescence intensity of an Oregon Green fibrinogen layer at a planar gold electrode and at nano-cavity array electrode held at a potential of −1.2 V in aqueous solution with 0.1 M NaHCO3 as the supporting electrolyte. The excitation wavelength is 488 nm. The inset shows the fluorescence spectra obtained at the array and following electrochemical release. | ||
In summary, the creation of fibrinogen patterned nano-cavity arrays has been demonstrated. These arrays offer significant advantages for bio-nano-patterning, such as the ease of selective modification and the possibility of releasing concentrated pockets of protein electrochemically in a time controlled way. The plasmonic enhancement commonly observed at these arrays may also facilitate sensing. Nano-cavity arrays have been shown to enhance Raman9 and, more recently by our group, fluorescence12 signals, opening up interesting possibilities for spatially and rate controlled protein delivery and sensor development.
This material is based upon work supported by the Science Foundation Ireland under Grant No. [05/IN.1/B30]. The Irish Research Council for Science, Engineering and Technology are also acknowledged for Postgraduate Studentship Funding.
Notes and references
- (a) C. A. Niemeyer and C. A. Mirkin, Nanobiotechnology: Concept, Applications and Perspective, Wiley-VCH, Weinheim, 2004 Search PubMed; (b) K. L. Christman, V. D. Enriquez-Rios and H. D. Maynard, Soft Matter, 2006, 2, 928–939 RSC; (c) J. F. Rusling, E. G. Hvastkovs, D. O. Hull and J. B. Schenkman, Chem. Commun., 2008, 141–154 RSC.
- J. W. Lussi, C. Tang, P.-A. Kuenzi, U. Staufer, G. Csucs, J. Vörös, G. Danuser, J. A. Hubbell and M. Textor, Nanotechnology, 2005, 16, 1781–1786 CrossRef CAS.
- D. Falconnet, A. Koenig, F. Assi and M. Textor, Adv. Funct. Mater., 2004, 14, 749–756 CrossRef CAS.
- G. Csucs, T. Künzler, K. Feldman, F. Robin and N. D. Spencer, Langmuir, 2003, 19, 6104–6109 CrossRef CAS.
- K. B. Lee, J.-H. Lim and C. A. Mirkin, J. Am. Chem. Soc., 2003, 125, 5588–5589 CrossRef CAS.
- T. M. Blättler, A. Binkert, M. Zimmerman, M. Texor, J. Vörös and E. Reimhult, Nanotechnology, 2008, 19, 075301 CrossRef.
- P. N. Bartlett, J. J. Baumberg, P. R. Birkin, M. A. Ghanem and M. C. Netti, Chem. Mater., 2002, 14, 2199–2208 CrossRef CAS.
- C. L. Haynes and R. P. Van Duyne, J. Phys. Chem. B, 2001, 105, 5599–5611 CrossRef CAS.
- (a) J. J. Baumberg, T. A. Kelf, Y. Sugawara, S. Cintra, M. Abdelsalam, P. N. Bartlett and A. E. Russell, Nano Lett., 2005, 5, 2262–2267 CrossRef CAS; (b) M. Abdelsalam, P. N. Bartlett, A. E. Russell, J. J. Baumberg, E. J. Calvo, N. G. Tognalli and A. Fainstein, Langmuir, 2008, 24, 7018–7023 CrossRef CAS; (c) C. Xiang, S.-C. Kung, D. K. Taggart, F. Yang, M. A. Thompson, A. G. Güell, Y. Yang and R. M. Penner, ACS Nano, 2008, 2, 1939–1949 CrossRef CAS.
- Q. Zhou, H. Zhao, F. Pang, Q. Jing, Y. Wu and J. Zheng, J. Phys. Chem. C, 2007, 111, 514–518 CrossRef CAS.
- D.-F. Yang, C. P. Wilde and M. Morin, Langmuir, 1996, 12, 6570–6577 CrossRef CAS.
- B. Jose, R. Steffen, U. Neugebauer, E. Sheridan, R. Marthi, R. J. Forster and T. E. Keyes, Phys. Chem. Chem. Phys., 2009 10.1039/b908385e.
- E. Ostuni, R. G. Chapman, R. E. Holmlin, S. Takayama and G. M. Whitesides, Langmuir, 2001, 17, 5605–5620 CrossRef CAS.
- C. T. Mallon, C. De Chaumont, N. Moran, R. J. Forster and T. E. Keyes, Langmuir, 2009 DOI:10.1021/la902115e.
- A. J. Bard and L. R. Faulkner, Electrochemical Methods: Fundamentals and Applications, Wiley, New York, 1980 Search PubMed.
Footnote |
| † Electronic supplementary information (ESI) available: Raman spectra of arrays before and after sphere desorption, full experimental details, characterisation of nano-cavity arrays and edge/interior area calculations. See DOI: 10.1039/b919352a |
| This journal is © The Royal Society of Chemistry 2010 |