New biomimetic sensors for the determination of tetracycline in biological samples: Batch and flow mode operations
Felismina Teixeira
Coelho Moreira
a,
Joana Rafaela
Lara Guerreiro
a,
Vera Lúcia
Azevedo
a,
Ayman H.
Kamel
b and
Maria Goreti
Ferreira Sales
*a
aREQUIMTE, Instituto Superior de Engenharia do Porto, R. Dr. António Bernardino de Almeida, 431, 4200-072, Porto, Portugal. E-mail: goreti.sales@gmail.com; Fax: +351 228 321 159; Tel: +351 228 340 500
bChemistry Department, Faculty of Science, Ain Shams University, Abbasia, Cairo, Egypt
First published on 22nd October 2010
Abstract
New potentiometric membrane sensors with cylindrical configuration for tetracycline (TC) are described based on the use of a newly designed molecularly imprinted polymer (MIP) material consisting of 2-vinylpyridine as a functional monomer in a plasticized PVC membrane. The sensor exhibited significantly enhanced response towards TC over the concentration range 1.59 × 10⁻⁵–1.0 × 10⁻³ mol L−1 at pH 3–5 with a lower detection limit of 1.29 × 10⁻⁵ mol L−1. The response was near-Nernstian, with average slopes of 63.9 mV decade−1. The effect of lipophilic salts and various foreign common ions were tested and were found to be negligible. The possibility of applying the proposed sensor to TC determination in spiked biological fluid samples was demonstrated.
Introduction
Tetracycline (TC) is the representative molecule of a family of well-known broad-spectrum antibiotics, used routinely in human and veterinary medicine for the prevention and control of disease. TC was discovered in 1953, it is indicated for use against many bacterial infections and is extensively used in human medicine and is particularly popular in veterinary medicine. It is also used as a growth promoter in food-producing animals,1 added in sub-therapeutic doses to the animal feeds over lengthy periods of time. As a result, there is a risk that residues of TC or its metabolites are present in foodstuffs obtained from treated animals, which may result in the emergence of antibiotic resistance in both human and veterinary bacterial populations, thereby having an impact on human health.2 Subsequently, to ensure the health of consumers, the FAO/World Health Organization (WHO), and the European Union (EU) have set the maximum residue limit (MRL) of tetracyclines in milk at 100 mg L−1. The US Food and Drug Administration (FDA) have set the safe levels for the residues of tetracyclines, oxytetracycline, and chlortetracycline in milk at 80, 30, and 30 mg L−1, respectively. The Chinese government standard (GB 18406.3-2001) sets the maximum residue limit of tetracyclines in meat at 100 mg kg−1.To detect the residues of tetracyclines, a simple, rapid and accurate method is required. Several procedures can be found in the literature for the analytical determination of TC in different matrices. Some of them are based on the determination of TC by luminescence,3–6 spectrophotometry,7 HPLC,8–12 capillary electrophoresis,13 amperometry14 and potentiometry.15–18 The development of a new sensor will allow a simplified procedure to be developed for the determination of TC based on the selective potentiometric detection of TC.
Enhanced performance may be obtained by the use of molecularly-imprinted polymers (MIPs). The regular approaches for sensing technology are either electrochemical measurements carried out using a potentiostat (i.e., potentiometry being a particular example of the voltammetric measurement), or simple millivoltammeter readings carried out using a potentiometer. In the former case, many different MIP supports may be used, but the equipment is expensive and is not portable, requiring the repeated removal of oxygen by purging with nitrogen gas, and Faraday cages for the use of very low currents. For regular potentiometric readings that are carried out using the type of pH meter found in any laboratory, the MIP-based sensors we know incorporate polymer particles as a regular ionophore in PVC membranes19–28 or else use sol–gel technology.29 Sol–gel-based sensors have very short life-times and are not as reproducible as PVC-based sensors.
Thus, this work describes the preparation, characterization, and application of polymeric membrane sensors based on the use of a TC biomimic receptor prepared via imprinting of the template with 2-vinyl pyridine (2-VP) as a functional monomer and ethylene glycol dimethacrylate (EGDMA) as a cross linker. The sensing materials were dispersed in a PVC matrix plasticized with 2-nitrophenyloctyl ether (oNPOE) as a solvent mediator. Other membrane components were also tested for comparison purposes. The performance characteristics and selectivity of the sensors were evaluated by the response potentials and selectivity coefficients. The sensors exhibited high sensitivity, stability and selectivity for TC+ ions over many common ions, and were successfully used for determining TC+ ions in spiked biological samples under static and hydrodynamic modes of operation.
The novelty of the present work is the use of molecularly-imprinted materials as ionophores in a PVC selective membrane. As far as we know, this has never been reported before and the overall concept is also not often used (especially when considering the use of MIP with other transducers). In addition, the main goal of this new sensor is to be used as a low-cost screening method in locus, allowing the routine control of TC after field application. In comparison to conventional ionophore-based ion-selective electrodes (ISEs), MIP-based sensors present an increased sensor sensitivity as well as a decreased limit of detection.
Experimental section
Apparatus
All potential measurements were carried out using a Crison μpH 2002 decimillivoltammeter (±0.1 mV sensitivity), at room temperature, and under constant stirring, by means of a Crison, micro ST 2038. The output signal in steady state evaluations was transferred to a commutation point that enabled its reconnection to one of six ways out. Each way presented an electrical antenna connector that provided suitable adaptation to each selective sensor. The assembly of the potentiometric cell was as follows: conductive graphite | TC selective membrane | buffered sample solution (acetate buffer, 5 × 10⁻³ mol L−1, pH 4.7) || electrolyte solution, KCl | AgCl(s) | Ag. The reference electrode was an Orion Ag/AgCl double-junction (Orion 90-02-00). The proposed sensors were prepared in conventional or tubular configurations,30 suitable for steady and flow mode evaluations. Both devices had no internal reference solution and epoxy-graphite was used as the solid contact.The Flow Injection Analysis (FIA) system comprised a Gilson Minipuls 2 peristaltic pump, fitted with PVC tubing (0.80, 1.60 and/or 2.00 mm i.d.), and a four-way Rheodyne 5020 injection valve holding a loop of 250 μL. All the components were connected together with PTFE tubing (Omnifit, Teflon, 0.8 mm i.d.) with Gilson end-fittings and connectors. The support devices for tubular and reference electrodes, as well as the confluence point accessory were constructed in Perspex® as reported elsewhere.31,32 The emf values were recorded using a Crison μpH 2002 decimillivoltammeter (±0.1 mV sensitivity) connected to a PC through the interface ADC 16 (Pico Tech., UK) and PicoLog for windows (version 5.07) software.
Reagents
All chemicals were of analytical grade and de-ionized water (conductivity < 0.1 μS cm−1) was employed. TC hydrochloride, amine ionophore (I) [calix[6]arene-hexaacetic acid], tetrakis(4-chlorophenyl)borate and poly(vinyl chloride) of high molecular weight (PVC) were purchased from Fluka. Ethylene glycol dimethacrylate (EGDMA), 2-vinylpyridine (2-VP) and benzoyl peroxide (BPO) were purchased from Merck. Tetrahydrofuran (THF) and 2-nitrophenyloctyl ether (oNPOE) were bought from Riedel-de Haen.Preparation of the molecular imprinted polymer (MIP)
The template (TC, 0.5 mmol) was placed in a glass tube (14.0 mm i.d.) with the functional monomer (2-VP, 5.0 mmol), the cross-linker (EGDMA, 24.5 mmol) and the initiator (BPO, 0.32 mmol) and dissolved in 3 mL of acetonitrile which acts as a porogen solvent. The polymerization mixture was sonicated, degassed with nitrogen for 5 min, and cured at 70 °C for 30 min. The non-imprinted polymer (NIP) was prepared similarly but the template was excluded from the procedure. The polymers were ground and sieved to particle sizes ranging between 50 and 150 mm. Extraction of the template molecule was carried out with acetonitrile/water/acetic acid [(92.5![[thin space (1/6-em)]](https://www.rsc.org/images/entities/char_2009.gif) :2.5:5 (v/v/v)] to eliminate interfering compounds arising from the synthesis (template and unreacted monomers). All polymers (MIP/2-VP and NIP/2-VP) were left to dry at ambient temperature prior to use.
:2.5:5 (v/v/v)] to eliminate interfering compounds arising from the synthesis (template and unreacted monomers). All polymers (MIP/2-VP and NIP/2-VP) were left to dry at ambient temperature prior to use.
Sensor construction and calibration
Polymeric membranes employed for ISE measurements consisted of 2 wt% electroactive material, PVC/plasticizer (1:2) polymeric matrix and 30 mmol % relative to ionophore of lipophilic additive. The mixture was stirred until the PVC was well moistened, and dispersed in 3.0 mL THF. These membranes were placed in conductive supports of conventional or tubular shapes. Membranes were allowed to dry for 24 h and placed in a 1 × 10⁻³ mol L−1 TC solution prepared in water. The electrodes were stored in these conditions when not in use.
All potentiometric measurements were carried out at room temperature. The emf of each electrode was measured in buffer solutions obtained by transferring 0.5 mL aliquots of 1.0 × 10⁻²–1.0 × 10⁻⁴ mol L−1 TC aqueous solutions to 100 mL beakers containing 50.0 mL of 5 × 10⁻³ mol L−1 acetate buffer of pH 4.7. Potential readings were recorded after stabilization to ± 0.2 mV and the emf was plotted as a function of the logarithm of TC concentration. Calibration graphs were used for the subsequent determination of unknown TC concentrations. General working characteristics of the TC selective electrodes were evaluated after calibration procedures carried out in batch mode and in a flow two-channel manifold. The setup had as carrier a solution enabling the ionic strength (IS) adjustment of test solutions or a suitable buffer that allowed fixed pH and IS at test solutions. The injection volume was 250 μl and the flow-rate was 7 mL min−1. Each calibration was attained by injecting to the flow stream a series of freshly prepared solutions of TC covering the range of 1.0 × 10⁻⁵ mol L−1 to 5.0 × 10⁻³ mol L−1. The corresponding peak heights were converted to potentials and used to plot calibration graphs.
Binding experiments
Before the binding experiments were carried out, the TC molecules in the MIP were removed by washing with a mixture of acetonitrile/acetic acid (5:1, v/v) until the absorbance of TC at 356 nm was no longer detected in the eluate. The polymer was dried to a constant weight at 60 °C under vacuum. Then 20.0 mg of MIP was mixed with 5.0 mL of TC solution at various concentrations [0.02–1 mmol L−1] in a 10 mL conical flask and oscillated for 12 h at room temperature. After centrifuging at 3000 rpm for 10 min, the concentration of free TC in the supernatant was detected by UV spectrophotometry at 356 nm. The amount of TC bound to the polymer was calculated by subtracting the concentration of free TC from the initial TC concentration. The data obtained was used for Scatchard analysis.
Determination of TC in spiked samples
1.0 mL aliquots of urine or serum samples were diluted with 10−2 mol L−1 acetate buffer of pH 4.7 in a 25 mL calibrated flask and shaken well. For the assessment of batch analysis, the sensor and reference electrode were immersed in the solution, and the potential readings were recorded after reaching the equilibrium response (10–20 s). The concentration of TC was calculated using a calibration graph. For continuous measurements (FIA), a flow stream of 10−2 mol L−1 acetate buffer of pH 4.7 carrier solution was allowed to pass through the flow-cell at a flow rate of 7 mL min−1. Successive 250 μl aliquots of the standard TC and unknown test sample solutions were injected into the flowing stream. The corresponding potential change was measured and recorded versus time. A typical calibration plot was made and used to determine the concentration of the unknown samples.Results and discussion
Molecular imprinting is a technique used for the fabrication of biomimetic polymeric recognition sites or “plastic antibodies/receptors” which is rapidly attracting increased interest. By using this technology, recognition matrices can be prepared which possess high substrate selectivity and specificity. In the development of this technology, several applications have been foreseen in which imprinted materials may be exchanged for natural recognition elements. Thus, molecularly imprinted polymers have been used as antibody/receptor binding mimics in immunoassay-type analyses, as enzyme mimics in catalytic applications and as recognition matrices in biosensors. The best developed application area for imprinted materials, though, has been as stationary phases for chromatography, in general, and chiral chromatography, in particular. Electrochemical MIP sensors come in various configurations that offer the possibility of controlling electrode characteristics such as hydrophobic/hydrophilic character, permeability and film thickness, all of which are essential for obtaining (and maintaining) good sensor performance. A key technical challenge in the development of widespread cheap MIP-based sensors is in achieving an appropriate interface between the recognition element (MIP) and the reporter circuit (transducer). In most cases, the MIP has to be brought into close contact with the transducer surface.In this work, a mimic receptor prepared via imprinting TC with 2-vinylpyridine (2-VP) as a functional monomer and ethylene glycol dimethacrylate (EGDMA) as a cross linker, dispersed in PVC matrix plasticized with oNPOE solvent mediator was tested as a sensor for the determination of TC. A scheme of the stepwise fabrication process of the biomimetic receptor is presented in Fig. 1. For comparison another recognition site, based on calix[6]arene-hexaacetic acid derivative as an ionophore, was also used as a TC sensor.
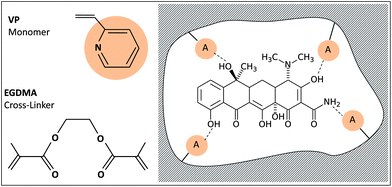 | ||
| Fig. 1 Schematic representation of the TC imprinting process. | ||
Potentiometric response characteristics of the sensors
The molecular imprint designs the shape of a template molecule on a polymeric layer (growing in bulk solution with the template molecule). After washing out the template, this molecule is able to rebind again to its imprinted “cavity”. Thus, acting as the recognition element on a potentiometric biosensor, MIP particles should be able to specifically recognize and bind the target analyte in an often complex sample. This “molecular recognition” on the TC potentiometric sensing element was confirmed when ISEs prepared with MIPs showed better analytical performance than those with NIP particles. Indeed, the slope of MIP sensors was quasi-Nernstian while the response of NIP ISEs was non-linear along the studied concentration range (Table 1). The MIP sensor displayed average slopes of 57.3 mV decade−1, with 2.45 × 10⁻⁴ and 4.57 × 10⁻⁴ mol L−1 detection limit and lower limit of linear concentration, respectively.| Parameter | MIP | MIP + pClTPB | NIP | NIP + pClTPB | pClTPB | Amine ion + pClTPB |
|---|---|---|---|---|---|---|
| a The upper limit for linear range is 1.0 × 10⁻³ mol L−1. | ||||||
| Slope (mV decade−1) | 57.3 ± 0.9 | 63.9 ± 0.7 | 24.9 ± 0.5 | 66.1 ± 0.9 | 72.8 ± 0.7 | 76.9 ± 0.8 |
| R-squared (n = 5) | 0.995 | 0.994 | 0.953 | 0.996 | 0.992 | 0.991 |
| Detection limit (mol L−1) | 2.45 × 10⁻⁴ | 1.29 × 10⁻⁵ | — | 2.8 × 10⁻⁵ | 6.31 × 10⁻⁵ | 2.51 × 10⁻⁵ |
| Lower limit of linear rangea (mol L−1) | 4.57 × 10⁻⁴ | 1.59 × 10⁻⁵ | — | 3.8 × 10⁻⁵ | 8.90 × 10⁻⁵ | 4.97 × 10⁻⁵ |
| Working pH range | 3–5 | 3–5 | — | 3–5 | 3–5 | 3–5 |
| Standard deviation (σv) | 1.1 | 1.3 | — | 1.3 | 0.9 | 0.8 |
| Precision (%) | 0.9 | 0.7 | — | 1.1 | 1.2 | 0.7 |
| Repeatability CVw (%) | 1.2 | 1.1 | — | 0.9 | 0.7 | 0.8 |
The main drawback of the MIP sensor was its high limit of detection. This feature could be improved by optimizing the membrane composition, especially by considering the possibility of employing a lipophilic additive. Anionic additives are used to ensure that ISE membranes are permselective by reducing the anionic interference and lowering the electrical resistance of the membranes.33 In the present study, p-tetrakis(4-chlorophenyl)borate (pClTPB) was added to produce lipophilic anionic sites among the sensing membranes. This compound is sufficiently lipophilic to remain solely in the organic membrane phase when in contact with aqueous solution. In terms of analytical performance, the addition of lipophilic additives is expected to enhance the ISE performance, widening the linear range with theoretical slope and stable sensor signals.33 Indeed, this behavior was quite evident when comparing MIP ISEs with and without additive; this compound decreased the limit of detection by more than one decade (Fig. 2), to about 1.3 × 10⁻⁵ mol L−1.
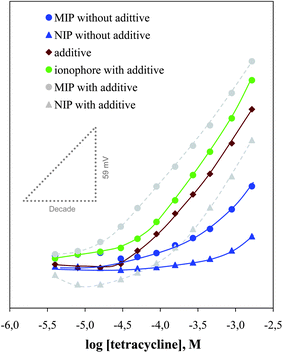 | ||
| Fig. 2 Calibration plot of TC membrane sensors in 5 × 10⁻³ mol L−1 acetate buffer pH 4.7. | ||
Unexpectedly, this observation was accompanied by an increase in the slope (of about 11%). This supra-Nernstian tendency was confirmed by preparing membranes of NIP with additive; these were unable to work without this membrane component and also became supra-Nernstian after its inclusion, exhibiting even higher slopes, of 66.1 mV decade−1. This behavior was also confirmed by preparing blank membranes of additive, showing this time average slopes of 72.8 mV decade−1, and was consistent for another kind of ionophore (commercial amine ionophore) with additive (Table 1).
In fact, the MIP particles greatly improved the limit of detection of the pClTPB sensor and this was a clear advantage. However, the opposite perspective was implied here. The MIP particles were meant to improve performance and the additive was used to improve the permselectivity of the membrane, by reducing the ionic interference and lowering the electrical resistance of the membranes, in case the ionophore acted as a neutral carrier. The observed behavior seemed however of a charged carrier considering that membranes with only MIP particles showed Nernstian response. In addition, NIP sensors were not able to respond, suggesting that stereochemical recognition of the analyte could be implicated. Of course, this requires further evaluation and cannot be concluded from the observed data.
Binding properties of MIPs
The binding mode and site distribution between the synthesized polymeric sensing materials and TC were evaluated by means of specific binding experiments. For this purpose, fixed amounts of MIP/VP were incubated with different concentrations of VP until equilibrium was reached. The resulting binding capacity of MIP (Q) was calculated according to the following equation: | (1) |
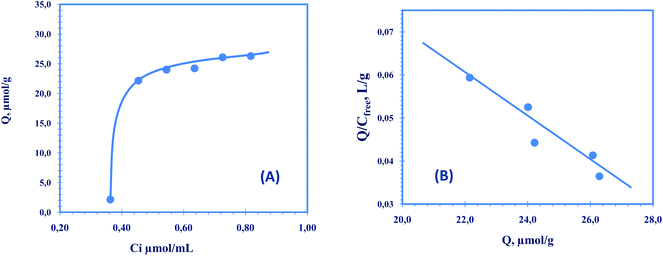 | ||
| Fig. 3 (A) Binding isotherm for the TC imprinted polymer, Q is the amount of TC bound to 20.0 mg of the respective polymer; t = 25 °C; V = 10.0 mL; binding time: 20 h. (B) Scatchard plot to estimate the binding characteristic of TC imprinted polymer. | ||
The corresponding experimental data was used to carry out the Scatchard analysis and estimate further binding parameters. The Scatchard equation,
 | (2) |
For VPY as a monomer the Scatchard plot was linear over the entire TC concentration range, which means that the bonding sites are homogeneous. The Scatchard plot has a linear section within the plot. This revealed one class of binding sites in the MIP. The equilibrium dissociation constant Kd1 and the apparent maximum amount Qmax1 for the higher affinity binding sites can be calculated to be 196 μmol L−1 and 34 μmol g−1, respectively, for dry polymer.
Response time and lifetime
The time required to achieve a steady potential response (±3 mV) using the proposed sensors in 1.96 × 10⁻⁴ to 7.41 × 10⁻⁴ mol L−1 TC solutions increases with concentration but was less than 20 s. After replicate calibrations of each sensor were carried out, low potential drift, long-term stability and negligible change in the response was observed. The sensors were stored and conditioned in 10−3 mol L−1 TC solution. With all sensors examined, the detection limits, response times, linear ranges and calibration slopes were reproducible over a period of at least 4 weeks.pH effect
The effect of buffer pH on the analytical signal of TC sensors was investigated by carrying out measurements in 5 mmol L−1 acetate and changing the pH within a range of 2.0 to 6.0. It is shown that the slopes and sensitivities of TC sensors are almost unchanged until pH 5.0 and decrease after pH 5.0 due to the formation of the non-cationic species.The time required to achieve a steady potential response within ±3 mV using the proposed sensors in 10−5 to 10−3 mol L−1 TC solutions with a rapid 10-fold increase in concentration was below 20 s. Replicate calibrations for each sensor indicated low potential drift, long-term stability and negligible change in the response of the sensors. The sensors were stored and conditioned in 10−4 mol L−1 TC solution of pH 4.7. With all sensors examined, the detection limits, response times, linear ranges and calibration slopes were reproducible to within ± 5% of their original values over a period of at least 8 weeks.
Selectivity study
The selectivity is clearly one of the most important characteristic of a potentiometric sensor. It represents the preference of a sensor for the response to the primary ion over another ion, acting as an interfering species. There are several ways to calculate theoretical values of potentiometric selectivity coefficients (Kpot), and each one of them has its own limitations and advantages. For this study, the separated solution method (SSM) (ai = aj = 5 × 10⁻⁴ mol L−1, activities of main, i, and interfering, j, ions) was selected. It is quick and evaluates the selective response of an ISE for a single ion in solution. Thus, the corresponding Kpot values can only be considered for comparing the analytical behavior of the constructed ISEs.K pot values were calculated as previously described,34 and the obtained results are summarized in Table 2 (in log). As interfering ions, several organic and inorganic compounds were selected; amino-acids and inorganic ions that are usually present in biological fluids were considered for this purpose. The typical selectivity order of an MIP + pClTPB-based sensor with membrane plasticized with oNPOE was: oxycycline > alanine > NH2OH.HCl > cysteine > creatinine > citric acid > tartaric acid > K+ > NH4+ > naldixic acid > Na+ > glycine > Ca2+ > Ba2+ > Mg2+. The selectivity order of a pClTPB membrane-based sensor was: citric acid > tartaric acid > oxycycline > creatinine > K+ > NH4+ > Na+ > naldixic acid > alanine > glycine > NH2OH·HCl > cysteine > Ca2+ > Mg2+ >Ba2+. The selectivity order of an amine ionophore I + pClTPB membrane-based sensor was: oxycycline > creatinine > NH4+ > K+ > Na+ > naldixic acid > Mg2+ > cysteine > Ba2+ > NH2OH·HCl > citric acid > glycine > Ca2+ > alanine > tartaric acid.
| Interfering species | LogKPotTC, j | ||
|---|---|---|---|
| MIP + pClTPB | pClTPB | Amine ionophore (I) + pClTPB | |
| Oxycycline | −0.56 | −1.11 | −0.47 |
| Creatinine | −1.02 | −1.12 | −0.84 |
| Naldixic acid | −1.72 | −1.68 | −1.55 |
| Glycine | −1.93 | −1.90 | −2.53 |
| NH2OH.HCl | −0.63 | −1.94 | −2.41 |
| Cysteine | −0.67 | −2.05 | −2.35 |
| Alanine | −0.59 | −1.80 | −3.01 |
| Tartaric acid | −1.17 | −1.09 | −3.50 |
| Citric acid | −1.12 | −1.05 | −2.43 |
| NH4+ | −1.44 | −1.33 | −1.41 |
| Na+ | −1.75 | −1.49 | −1.48 |
| K+ | −1.37 | −1.22 | −1.47 |
| Ba2+ | −3.59 | −3.63 | −2.38 |
| Ca2+ | −3.51 | −3.45 | −2.54 |
| Mg2+ | −3.82 | −3.47 | −2.26 |
In general terms, the interference of all ionic species was found to be negligible. Generally, divalent ions caused less interference than monovalent ones. Inorganic ions were also less interfering than organic species. The behavior of the three electrodes was similar. Once, these electrodes evaluated contained additive, it means that the additive was governing the observed selectivity pattern that was near-hofmeister. Thus, is not possible to conclude that MIP particles would not be better alone, but as their general performance improved by the presence of an additive, only these sensors were studied. In general, the combination of MIP plus additive was responsible for the widest linear range and the closest sensitivity to the Nernstian theoretical behaviour. Increased slope may not be a good feature in potentiometric measurements. Getting a Nernstian slope, is an important feature since it enables an easy assessment of the relative sensitivity and also know if the response of the electrode follows theory, given by the modified Nernst equation. This theory is based on the transduction of a potential that varies predictably with the concentration of a certain ion in solution, in this case the TC.
Flow injection setup
The power of FIA as an analytical tool lies in its ability to combine analytical functions in a wide variety of different ways to create a broad range of different methodologies, and perform these methodologies rapidly and automatically with minute (μL) amounts of sample. A double-channel flow manifold was set-up and afterwards gradually optimized with the purpose of allowing the introduction of low sample volumes with maximum reproducibility and sampling rate. Hence, the influence of several parameters such as flow rate and injection volume was studied. ISEs of MIP + pClTPB were used in this studyThe dependency of the peak heights and peak width (and time to recover the baseline) on flow rate was studied using the electrode response to a 5.0 × 10⁻⁴ mol L−1 solution of TC. The total flow rate was varied from 4.0 to 10.0 mL min−1. As the flow rate increased, the peaks became narrower and decreased in height to a nearly plateau at a flow rate of 7–8 mL min−1. Therefore, a value of 7.0 mL min−1 allowed analytical calibrations with good sensitivity as well as high sampling rates.
In general, peak heights increased with the increasing sample volume, although the effect was less marked at higher concentration.35 For the proposed sensor, different sample volumes from 20 to 250 μl were studied; the peak height reached nearly 100% of steady state at 250 μl injected. Thus, this sample volume was selected as an optimum amount.
Under the optimum conditions, which ensured signals with at least 90% of steady state, the typical calibration curve presented the average analytical features indicated in Table 3. A linear response to the logarithm of TC concentration was obtained from 5.0 × 10⁻⁵ to 5.0 × 10⁻³ mol L−l, with a detection limit of 4.0 × 10⁻⁵ mol L−l and a slope of 69.9 mV decade−1. Comparing batch analysis with FIA, the former mode of analysis showed near-Nernstian behavior whereas the flow mode provided supra-Nernstian responses. This slope increase was most probably correlated to the transient nature of the signal, when and if the lower concentrations take longer to reach the equilibrium than the higher concentrations of TC. Under these conditions, the % of steady state reached for lower concentrations is lower than for higher concentrations.
| Parameter | MIP + pClTPB |
|---|---|
| Slope (mV decade−1) | 69.9 ± 0.7 |
| Correlation coefficient (r) | 0.996 |
| Lower limit of detection (mol L−1) | 4.0 × 10⁻⁵ |
| Limit of linear range (mol L−1) | 5.0 × 10⁻⁵ |
| Chosen flow rate (mL min−1) | 7 |
| Carrier solution | acetate buffer 5 × 10⁻² mol L−1 |
| pH | 4.7 |
| Output (samples h−1) | 28–30 |
The precision for repeated injections was high, with a typical standard deviation of 0.8 mV for 5 consecutive injections. The FIA system optimized as described above enabled a maximum sampling rate of about 28–30 samples h−1. The repeatability of the electrode response was excellent; the relative standard deviation of peak height for 5 injections of 1.0 × 10⁻⁴ and 5.0 × 10⁻⁴ mol L−1 solutions was 0.7 and 0.9%, respectively.
Determination of TC in spiked biological fluids
Application of the method to the determination of TC in biological fluids was tested by spiking aliquots of serum and urine samples with a known standard of TC. An average recovery of 99.1% was obtained with a relative standard deviation of ± 0.8%. Results obtained for the determination of TC in spiked serum and urine samples using batch and FIA are listed in Table 4.| Samples | Added (mg) | Found (mg) | |
|---|---|---|---|
| Batch | Recovery (%) | ||
| Serum | 42.9 | 38.87 ± 1.95 | 90.5 ± 4.54 |
| 124.4 | 116.84 ± 3.97 | 93.9 ± 3.19 | |
| 236.5 | 231.33 ± 9.51 | 97.8 ± 4.02 | |
| 369.9 | 391.61 ± 3.52 | 105.9 ± 0.95 | |
Conclusions
A TC potentiometric sensor fabricated from an MIP based on the use of 2-VP as a functional monomer exhibited excellent potentiometric performances such as fast response, a wide working pH range, high sensitivity, long-term stability, good selectivity and automatic feasibility. The use of this sensor as a detector for the continuous monitoring of TC offered the advantage of simple design, ease of construction and possible application in the routine control of pharmaceutical drug solutions and biological fluids, after suitable preconcentration procedures. The detector displayed a wide dynamic measurement range for the drug (4 × 10⁻⁵–1.0 × 10⁻³ mol L−1) under a continuous mode of operation at a flow rate of 7.0 mL min−1 and a sample output of 28–30 samples h−1.Acknowledgements
The authors acknowledge the financial support from FCT, Fundação para a Ciência e Tecnologia, by means of project PTDC/AGR-AAM/68359/2006. One of the authors (AHK) is grateful for the postdoctoral grant (SFRD/BPD/38740/2007).References
- P. Hughes and J. Heritage, Antibiotic Growth-promoters in Food Animals: http://www.fao.org/docrep/article/agrippa/555_en.htm, 2007.
- M. E. Doyle, Veterinary drug residues in processed meats. Potential health risk. Food Research Institute, University of Wisconsin– Madison. FRI Briefings, March 2006: http://www.wisc.edu/fri/briefs.htm [accessed May 2007] Search PubMed.
- M. Y. X. Yang and J. H. Wang, Anal. Chem., 2006, 78, 5900 CrossRef CAS.
- A. Yegorova, E. Vityukova, S. Beltyukova and A. Duerkop, Microchem. J., 2006, 83, 1 CrossRef CAS.
- N. Rodriguez, M. C. Ortiz, A. Herrero and L. A. Sarabia, Luminescence, 2007, 22, 518 CrossRef CAS.
- M. Schaferling and O. S. Wolfbeis, Chem.–Eur. J., 2007, 13, 4342 CrossRef.
- R. KarlíÇek and P. Solich, Anal. Chim. Acta, 1994, 285, 9 CrossRef CAS.
- S. Babi, D. Asperger, D. Mutavdzie, A. J. M. Horvat and M. Kastelan-Macan, Talanta, 2006, 70, 732 CrossRef CAS.
- J. W. Fritz and Y. Zuo, Food Chem., 2007, 105, 1297 CrossRef CAS.
- L. Yan, X. Jin-Zhong, D. Tao and L. Gong-Hai, Chin. J. Chem., 2007, 25, 1294 CrossRef.
- U. Koesukwiwat, S. Jayanta and N. Leepipatpiboon, J. Chromatogr., A, 2007, 1140, 147 CrossRef CAS.
- N. Furusawa, J. Sep. Sci., 2004, 27, 552 CrossRef CAS.
- S. Wang, P. Yang and Y. Cheng, Electrophoresis, 2007, 28, 4173 CrossRef CAS.
- F. F. G. Neto, R. S. Lima, W. S. Lyra, G. Marino, M. C. U. Araujo, E. P. Medeiros and V. B. Nascimento, Anal. Lett., 2007, 40, 3070 CrossRef.
- A. F. Shoukry and S. S. Badawy, Microchem. J., 1987, 36, 107 CrossRef CAS.
- S. Z. Yau, J. Shiao and L. H. Nie, Talanta, 1989, 36, 849 CrossRef CAS.
- M. G. F. Sales and M. C. B. S. M. Montenegro, J. Pharm. Sci., 2001, 90, 1125 CrossRef CAS.
- C. M. C. M. Couto, J. L. F. C. Lima, M. C. B. S. M. Montenegro and S. Reis, J. Pharm. Biomed. Anal., 1998, 18, 527 CrossRef CAS.
- F. T. C. Moreira, A. H. Kamel, J. R. L. Guerreiro and M. F. Goreti, Sales, Biosens. Bioelectron., 2010, 26, 566 Search PubMed.
- R. Liang, R. Zhang and W. Qin, Sens. Actuators, B, 2009, 141, 544 CrossRef.
- M. Javanbakht, S. E. Fard, A. Mohammadi, M. Abdouss, M. R. Ganjali, P. Norouzi and L. Safaraliee, Anal. Chim. Acta, 2008, 612, 65 CrossRef CAS.
- T. Alizadeh and M. Akhoundiana, Electrochim. Acta, 2010, 55, 1.
- J. Hantash, A. Bartlett, P. Oldfield, G. Dénès, R. O'Rielly and F. David, Anal. Bioanal. Chem., 2006, 387, 351 CrossRef.
- A. H. Kamel, F. T. C. Moreira, S. A. A. Almeida and M. G. F. Sales, Electroanalysis, 2008, 20, 194 CrossRef CAS.
- K. Prasad, K. P. Prathish, J. M. Gladis, G. R. K. Naidu and T. P. Rao, Sens. Actuators, B, 2007, 123, 65 CrossRef.
- K. P. Prathish, K. Prasad, T. P. Rao and M. V. S. Suryanarayana, Talanta, 2007, 71, 1976 CrossRef CAS.
- S. Sadeghi, F. Fathi and J. Abbasifar, Sens. Actuators, B, 2007, 122, 158 CrossRef.
- M. S. Tehran, M. T. Vardini, P. A. Azar and S. W. Husain, Int. J. Electrochem. Sci., 2010, 5, 88 Search PubMed.
- R. G. C. Silva, C. R. M. Vigna, C. B. G. Bottoli, C. H. Collins and F. Augusto, J. Sep. Sci., 2010, 33, 1319.
- S. Alegret, J. Alonso, J. Bartroli, A. A. S. C. Machado, J. L. F. C. Lima and J. M. Paulis, Quim. Anal., 1987, 6, 278 Search PubMed.
- G. Wulff, J. Vietmeyer and H. G. Poll, Makromol. Chem., 1987, 188, 731 CAS.
- A. H. Kamel, S. A. A. Almeida, M. G. F. Sales and F. T. C. Moreira, Anal. Sci., 2009, 25, 365 CrossRef CAS.
- E. Bakker and E. Pretsch, TrAC, Trends Anal. Chem., 2005, 24, 199 CrossRef CAS.
- Y. Umezawa, P. Buhlmann, K. Umezawa, K. Tohida and S. Amemiya, Pure Appl. Chem., 2000, 72, 1851 CrossRef CAS.
- X. Yang, D. B. Hibbert and P. W. Alexander, Anal. Chim. Acta, 1998, 372, 387 CrossRef CAS.
| This journal is © The Royal Society of Chemistry 2010 |