Voltammetric study of pyridine-2-aldoxime methochloride at poly(p-toluene sulfonic acid) modified glassy carbon sensor and its analytical applications
Sindhu
Issac
and
Krishnapillai
Girish Kumar
*
Department of Applied Chemistry, Cochin University of Science & Technology, Kochi, 682 022, Kerala, India. E-mail: giri@cusat.ac.in
First published on 24th August 2010
Abstract
A poly(p-toluene sulfonic acid) (p-TSA) modified glassy carbon electrode (GCE) was fabricated by electropolymerisation using cyclic voltammetry (CV). This chemically modified electrode showed high stability, good selectivity and reproducibility for the determination of pyridine-2-aldoxime methochloride (PAM chloride) a cholinesterase reactivator, used in military as an antidote in the treatment of organophosphate poisoning and to counteract the effects of overdosage by anticholinesterases used in treating myasthenia gravis. Compared with bare GCE, the modified electrode showed an enhancement in the oxidation peak current as well as a reduction in the oxidation potential of PAM chloride. Favorable electrostatic interaction between the negatively charged poly(p-TSA) film and the positively charged drug as well as the formation of hydrogen bonds could contribute to this enhanced sensitivity. Under optimum conditions the oxidation peak current is proportional to the concentration of PAM chloride in the range 1 × 10⁻³ M to 1 × 10⁻⁷ M with a detection limit of 3 × 10⁻⁸ M. The developed sensor was also successfully applied for the determination of PAM chloride in body fluids.
Introduction
PAM chloride (2-formyl-1-methylpyridinium chloride oxime) belongs to a family of compounds called oximes (Fig. 1). The principal action of PAM chloride is to reactivate cholinesterase (mainly outside the central nervous system) which has been inactivated by phosphorylation due to an organophosphate pesticide or related compound. Organophosphates inhibit cholinesterase by phosphorylation of the enzyme. Pralidoxime reactivates the cholinesterase by removing the phosphoryl group that is bound to the ester group. In this reaction both the organophosphate and the pralidoxime are mutually inactivated. These products undergo rapid metabolism leading to the removal of the organophosphate.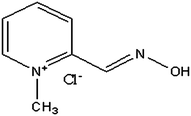 | ||
| Fig. 1 Structure of PAM chloride. | ||
Only a few analytical methods have been reported for the determination of PAM chloride. This mainly includes spectrophotometric methods,1 liquid chromatographic methods2 and isotachophoretic methods.3 But most of these methods lack selectivity and sensitivity for the determination of PAM chloride. Hence it is of immense importance to develop a technique for the determination of PAM chloride with a high degree of selectivity, sensitivity and a low detection limit. In this context, electrochemical techniques are very attractive as these methods are found to be relatively simple, fast, convenient and cost effective.4
The development of chemically modified electrodes (CMEs) has continued to be of major interest in voltammetric determination due to their specifically functionalized surfaces, good stability and reproducibility.5 Methods used for electrode modification include physical coating, covalent attachment and electropolymerization.6 Polymer films of aromatic and heteroaromatic compounds have been widely used in electrode surface modification as a means to obtain interesting electrode properties.7
As it is easy to control the film thickness, permeation and charge transport characteristics by adjusting the electrochemical parameters, electropolymerisation remains as a good approach to immobilize polymers to prepare polymer modified electrodes (PMEs).8 PMEs have many advantages in the determination of analytes because of their sensitivity, selectivity, ease of preparation, homogeneity in electrochemical deposition, strong adherence to electrode surface and the chemical stability of the film.9–13 As part of the present investigation, a poly(p-TSA) modified GCE has been prepared and used to study the electrochemical behaviour of PAM chloride.
Based on our previous works on drug analysis14–19 an attempt has been made to develop a convenient and sensitive method for the determination of PAM chloride by CV and square wave voltammetry (SWV) using poly(p-TSA) modified GCE. The modified GCE exhibited significant enhancement in the oxidation peak current as well as reduction in the oxidation potential of PAM chloride compared with bare GCE. The developed sensor has also been successfully applied for the determination of PAM chloride in urine samples.
Experimental
Reagents and materials
PAM chloride was purchased from Sigma Aldrich. p-TSA, NaCl, NaH2PO4 and Na2HPO4 were purchased from S.D. Fine Chemicals, India. Phosphate buffer solutions (0.1 M) of different pH were prepared by mixing standard solutions of NaH2PO4 and Na2HPO4 and adjusting the pH with HCl or NaOH.All chemicals were of analytical grade and were used directly without purification. Double distilled water was used through out the experiment. Buffer and sample solutions were purged with nitrogen before experiments. All experiments were conducted at room temperature.
Apparatus
Electrochemical measurements were performed with BAS Epsilon electrochemical analyzer (Bioanalytical System, USA) interfaced to a PC. All experiments were performed with a conventional three electrodes system comprising a poly(p-TSA) modified GC working electrode (GCE, 3 mm in diameter), a Pt wire counter electrode and an Ag/AgCl reference electrode. All potentials were relative to the reference electrode. The pH measurements were carried out in a Metrohm pH meter. Scanning electron microscopic (SEM) images were recorded using JOEL 6300 LV.Preparation of poly(p-TSA) modified GCE
Prior to electrochemical modification, the bare GCE was polished with alumina on a polishing pad. Then it was rinsed with methanol, 1![[thin space (1/6-em)]](https://www.rsc.org/images/entities/char_2009.gif) :
:![[thin space (1/6-em)]](https://www.rsc.org/images/entities/char_2009.gif) 1 HNO3 (aq.v/v), acetone and water respectively. After being cleaned the electrode was immersed in 0.1 M NaCl solution containing 1.0 mM p-TSA and was subjected to 20 potential scans between −2.0 to +2.5 V at 0.1 V s−1.20 The modified electrode was then electroactivated by CV from −0.8 to +0.8 V at 0.1 V s−1 in phosphate buffer (pH 7).
1 HNO3 (aq.v/v), acetone and water respectively. After being cleaned the electrode was immersed in 0.1 M NaCl solution containing 1.0 mM p-TSA and was subjected to 20 potential scans between −2.0 to +2.5 V at 0.1 V s−1.20 The modified electrode was then electroactivated by CV from −0.8 to +0.8 V at 0.1 V s−1 in phosphate buffer (pH 7).
Analytical procedure
Stock solution of PAM chloride (0.1 M) was prepared in water. 10 mL of phosphate buffer (pH 7) was taken in the electrochemical cell and required volume of drug solution was added to it. The solution was then de-aerated with nitrogen for 5 min. SWV was performed at poly(p-TSA) modified GCE and the voltammograms were recorded from 0 to 0.8 V at a scan rate of 0.6 Vs−1. An oxidation peak around 0.6 V was obtained for PAM chloride and the corresponding peak current was measured. For electrode regeneration several cyclic scans were carried out in the blank electrolyte solution until a stable voltammogram was obtained.Results and discussion
Electropolymerization of p-TSA at the GCE surface
Fig. 2 shows the cyclic voltammograms for the electropolymerization of 1.0 mM p-TSA in 0.1 M NaCl solution at the GCE. With the potential scanning from −2.0 to 2.5 V, two strong reduction peaks at −0.539 V and −1.646 V and one oxidation peak at 1.5 V were observed. In the subsequent cycles larger peaks were observed upon continuous scanning, which reflected the continuous growth of the film. These facts indicated the deposition of p-TSA on the surface of the GCE by electropolymerization. A uniform adherent blue polymer was formed on the GCE surface. After modification, the poly(p-TSA) modified electrode was carefully rinsed with water and stored in air before use.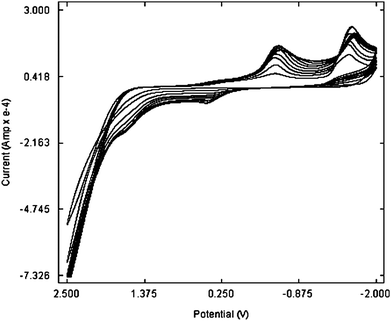 | ||
| Fig. 2 Electropolymerization of p-TSA at the GCE. | ||
Surface study
2 mM K3Fe(CN)6 was taken as a probe to measure the effective surface areas of both poly(p-TSA) modified GCE and bare GCE by CV at different scan rates.21 From the slope of Ipvs.ν1/2 plot, the areas of bare GCE and poly(p-TSA) modified GCE were estimated and were found to be about 1.2585 cm2 and 1.5768 cm2 respectively. There was about 25% enhancement in the effective surface area when GCE was modified with poly(p-TSA) which is strong evidence for the successful modification of GCE with polymer film.Further evidence for the modification of GCE was obtained from the surface morphology studies using a scanning electron microscope (SEM). SEM images of both bare GCE and poly(p-TSA) modified GCE are shown in Fig. 3.
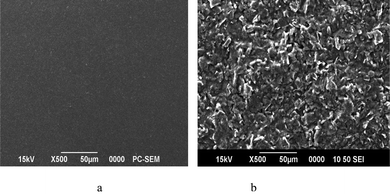 | ||
| Fig. 3 SEM images of (a) bare GCE and (b) poly(p-TSA) modified GCE. | ||
Electrochemical oxidation of PAM chloride at the poly(p-TSA) modified electrode
Fig. 4 shows the square wave voltammogram of PAM chloride at the bare GCE and poly(p-TSA) modified GCE. As can be seen, the oxidation peak of PAM chloride at the bare GCE was broad suggesting slow electron transfer, presumably due to the fouling of the electrode surface by the oxidation product. At the poly(p-TSA) modified GCE, its response has improved considerably, and the peak current has greatly increased.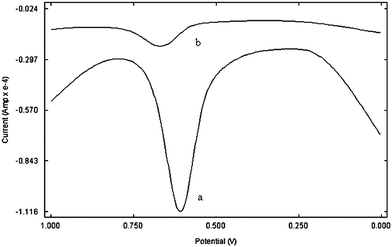 | ||
| Fig. 4 Square wave voltammogram of PAM chloride at (a) poly(p-TSA) modified GCE and (b) bare GCE at a scan rate of 0.06 V s−1. | ||
PAM chloride gave an oxidation peak at 0.67 V at the bare GCE and the peak current was around 10 μA. However at the poly(p-TSA) modified GCE, the oxidation peak appeared at 0.6 V and the peak current has increased to 84 μA. Compared with bare GCE, the oxidation potential of PAM chloride has shifted negatively by about 0.06 V and current has increased by 8 folds at poly(p-TSA)/GCE.
The surface charge states of PMEs are crucial to their behavior and potential applications. In p-TSA molecule there is high electron density from the sulfonic acid group and hence poly(p-TSA) film has a negatively charged surface.20 From the structure it is clear that PAM chloride is positively charged. The enhanced sensitivity of PAM chloride at the modified electrode could be attributed to the electrostatic attraction between positively charged PAM chloride and the high electron density of the sulfonic group of poly(p-TSA). Further there is a possibility for the formation of intermolecular hydrogen bonding between oxygen of sulfonic acid group and hydrogen of the aldoxime group. Such interactions would lead to an increase in the concentration of PAM chloride around the surface of the modified electrode (see Fig. 5).22,23
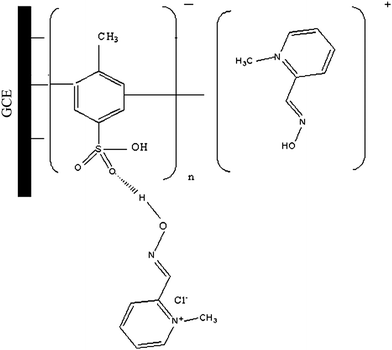 | ||
| Fig. 5 Mechanism of electropolymerization of p-TSA at the GCE and the attachment of PAM chloride at this modified surface. | ||
Here the oxidation peak arises due to the electrochemical oxidation of the aldoxime group of PAM chloride to carbonyl group.24 The mechanism involves, first the oxidation of the aldoxime group to an iminoxy radical which then undergoes oxidation to give a hydroxyl-nitroso intermediate. This then undergoes dimerisation followed by decomposition to give a carbonyl compound and hyponitrous acid. The whole process involves 2 e− transfer. The detailed mechanism is shown in Fig. 6.
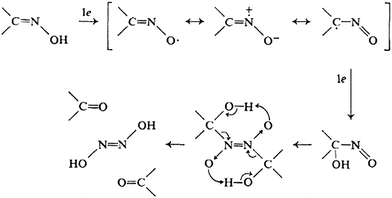 | ||
| Fig. 6 Mechanism of oxidation of oxime group in PAM chloride to carbonyl group. | ||
Effect of supporting electrolyte
The electrochemical behavior of PAM chloride in various media such as 0.1 M solutions of phosphate buffer, H2SO4, NaOH, NaCl and KNO3 were studied by SWV. When 0.1 M NaCl solution was used as the supporting electrolyte, PAM chloride gave an oxidation peak at 0.74 V with a peak current of 29 μA. With KNO3, the peak was obtained at 0.76 V with a current of 30 μA. No peak was obtained for PAM chloride when H2SO4 was used as the supporting electrolyte. However in PBS solution (pH 7) PAM chloride gave a peak at 0.60 V with a peak current of 84 μA. Thus the oxidation peak obtained was best defined in 0.1 M phosphate buffer (pH 7), justifying the choice.pH study
The effect of solution pH on the peak potentials and the peak currents of PAM chloride were studied and the result is shown in Fig. 7. The pH range studied was from 2–9. With the increase of pH value, the peak potentials shifted negatively. Also the experimental results showed that pH had a significant influence on the anodic peak current of PAM chloride at the poly(p-TSA) modified GCE. It was found that the oxidation peak current of PAM chloride increased with an increase in pH from 2–7. At higher pH the peak current was found to decrease. Obviously, the maximum response of anodic peak current appeared at pH 7. So pH 7 was selected as the optimal pH.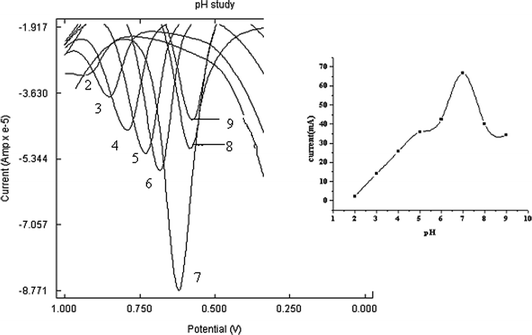 | ||
| Fig. 7 Overlay of SWVs of PAM chloride (1 × 10⁻³M) at poly(p-TSA)/GCE in 0.1 M phosphate buffer at different pH 2, 3, 4, 5, 6, 7, 8 and 9. Inset: Effect of pH on the anodic peak current of 1 × 10⁻³ M PAM chloride. | ||
Effect of scan rate
The oxidation peak current of 1 × 10⁻³ M PAM chloride at different scan rates ranging from 40–200 mVs−1 was measured by SWV using the same modified electrode. The results are illustrated in Fig. (8a). It was found that the anodic peak current increased with an increase in the scan rate (υ). The oxidation peak current varied linearly with square root of scan rate, indicating that the oxidation of PAM chloride at PME is diffusion controlled.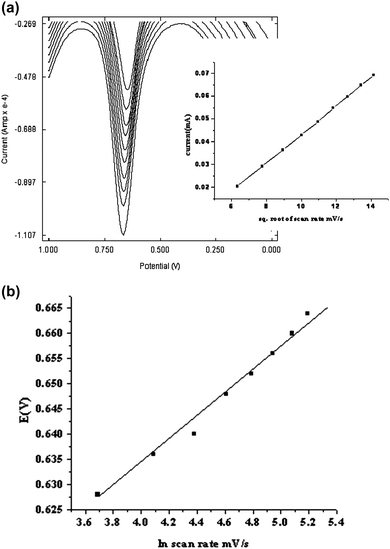 | ||
| Fig. 8 (a) Overlay of SWVs of PAM chloride at poly(p-TSA)/GCE in 0.1M phosphate buffer (pH 7) containing 1 × 10⁻³M PAM chloride at different scan rates a) 40 b) 60 c) 80 d) 100 e) 120 f) 140 g) 160 h) 180 i) 200 mVs−1. Inset anodic peak current vs. square root of scan rate. (b) Plot of peak potential against ln(scan rate). | ||
According to the Laviron's conclusion25 the relationship between the peak potential (Ep) and υ was examined. It was found that Ep varies linearly with ln υ and is shown in Fig. (8b). The no. of electrons (na) involved in the reaction can be calculated from the slope of the plot according to the relation, b = RT/αnaF, where b is the slope. α of the totally irreversible electrode process is assumed to be 0.5. The obtained value for na is around 2, which confirms that 2 electrons are involved in the oxidation of PAM chloride.
Effect of the number of scan cycles of electropolymerization on the electrocatalytic ability of poly(p-TSA)/GCE
Effect of film thickness on the oxidation peak current of 1 × 10⁻³ M PAM Chloride was investigated. The oxidation peak current gradually increased with increase of scan cycles of electropolymerization. When the cycles were beyond 20, the peak current decreased, may be due to the decreased electron transfer rate of PAM chloride with an increase in film thickness. Also, the repeatability and stability for the film modified electrode were poor when the voltammetric sweeping segments were less than 20. Hence the film thickness obtained with 20 segment sweeping was selected as the optimal condition.Calibration curve
The relationship between the anodic peak current of PAM chloride and its concentration was investigated by SWV (Fig. 9). The oxidation peak current was found to increase with an increase in the concentration over the range 1 × 10⁻⁷ M to 1 × 10⁻³ M. However a linear response was found to obtain from 2 × 10⁻⁷ M–2 × 10⁻⁶ M with a detection limit of 3 × 10⁻⁸ M.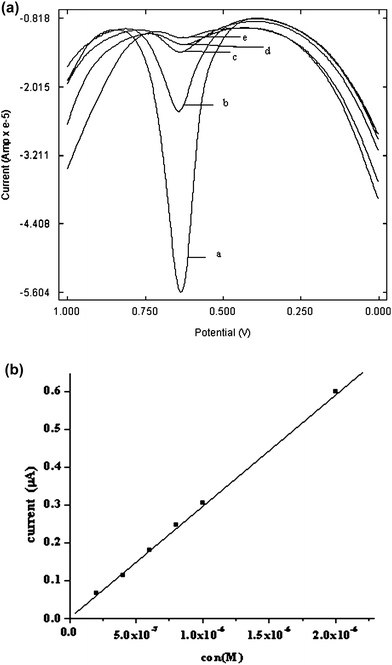 | ||
| Fig. 9 (a) Square wave voltammogram of PAM chloride of different concentrations a) 1 × 10⁻³M. b) 1 × 10⁻⁴ M c) 1 × 10⁻⁵ M d) 1 × 10⁻⁶ M e) 1 × 10⁻⁷ M at poly(p-TSA) modified GCE at 25 °C. (b) Calibration curve for PAM chloride at poly(p-TSA) modified GCE at 25 °C. | ||
To estimate the repeatability of the developed method, the relative standard deviation (RSD) of five measurements of 1 × 10⁻³ M PAM chloride at the same modified electrode was measured. The obtained RSD is 4.1% which showed the excellent reproducibility of the modified electrode.
Interference study
Under optimised experimental conditions, the effects of some foreign species on the determination of PAM chloride (1 × 10⁻⁴ M) were evaluated in detail. The results are given in Table 1. A 100-fold excess molar concentration of glucose, lactose, urea, citric acid, ascorbic acid, Na+, K+, SO42− and Cl− have almost no influence on the current response of PAM chloride.| Interferent | Concentration/mol L−1 | Signal change (%) |
|---|---|---|
| Lactose | 1 × 10⁻² | 0.23 |
| K+ | 1 × 10⁻² | 0.56 |
| Ascorbic acid | 1 × 10⁻² | 0.64 |
| Na+ | 1 × 10⁻² | 4.22 |
| Citric acid | 1 × 10⁻² | 2. 53 |
| SO42− | 1 × 10⁻² | 0.56 |
| Glucose | 1 × 10⁻² | 1.58 |
| Urea | 1 × 10⁻² | 0.78 |
| Cl− | 1 × 10⁻² | 4.22 |
Determination of PAM chloride in urine samples
The developed sensor was applied for the determination of PAM chloride in urine samples. 2 mL of urine sample and 8 mL phosphate buffer were taken in the cell. A suitable aliquot of PAM chloride was added to the above solution using a micro pipette. The solution was then thoroughly stirred. SWV was then recorded and the anodic peak current obtained was measured. This procedure was repeated for several additions of PAM chloride and the unknown concentrations were determined from the calibration graph. The recoveries obtained are in the range of 99–102%. The recovery obtained with the developed sensor was compared with that obtained using the standard method (spectrophotometric method).26 The results are shown in Table 2. It was found that there was a satisfactory agreement between the PAM chloride content determined by the developed sensor and by the reported standard method.Conclusion
A voltammetric sensor for the determination of PAM chloride has been developed based on the electropolymerization of p-TSA on GCE. The poly(p-TSA) film significantly improved the electron transfer, decreased the oxidation potential and enhanced the oxidation peak current of PAM chloride. The developed sensor was also successfully applied for the determination of PAM chloride in urine samples. The increased sensitivity, lower detection limit, ease of fabrication and regeneration of the surface of poly(p-TSA) make this sensor a better alternative over the existing methods for the determination of PAM chloride.Acknowledgements
The authors are grateful to the Defence Research and Development Organisation (DRDO), India for the financial assistance in the form of project. One of the authors (S. Issac) is grateful to the Council of Scientific and Industrial Research (CSIR) India for the fellowship.References
- K. K. Rajic, B. Stankovic, A. Granov and Z. Binenfeld, J. Pharm. Biomed. Anal., 1988, 6, 773 CrossRef.
- M. Gyenge, H. Kalasz, A. G. Petroianu, R. Laufer, K. Kuca and K. Tekes, J. Chromatogr., A, 2007, 1161, 146 CrossRef CAS.
- M. Bodiroga, D. Agbaba, D. Zivanov-Stakic and R. Popovic, J. Pharm. Biomed. Anal., 1994, 12, 127 CrossRef CAS.
- E. Bakker, Anal. Chem., 2004, 76, 3285 CrossRef CAS.
- Q. T. Cai and S. B. Khoo, Anal. Chem., 1994, 66, 4543 CrossRef CAS.
- P. Yang, W. Wei, C. Tao and J. Zeng, Bull. Environ. Contam. Toxicol., 2007, 79, 5 CrossRef CAS.
- L. Wang, P. Huang, J. Bai, H. Wang, X. Wu and Y. Zhao, Int. J. Electrochem. Sci., 2006, 1, 334 Search PubMed.
- S. A. Kumar and S. M. Chen, J. Mol. Catal. A: Chem., 2007, 278, 244 CrossRef CAS.
- S. Cosnier, Anal. Bioanal. Chem., 2003, 377, 507 CrossRef CAS.
- L. Xu, W. Chen, A. Mulchandani and Y. Yan, Angew. Chem., Int. Ed., 2005, 44, 6009 CrossRef CAS.
- P. R. Roy, T. Okajima and T. Ohsaka, Bioelectrochemistry, 2003, 59, 11 CrossRef CAS.
- Y. Ohnuki, T. Ohsaka, H. Matsuda and N. Oyama, J. Electroanal. Chem., 1983, 158, 55 CAS.
- A. Volkov, G. Tourillon, P. C. Lacaze and J. E. Dubois, J. Electroanal. Chem., 1980, 115, 279 CrossRef CAS.
- S. Issac and K. Girish Kumar, Drug Test. Anal., 2009, 1, 350 Search PubMed.
- K. Girish Kumar, P. Augustine and S. John, J. Appl. Electrochem., 2010, 40, 65 CrossRef CAS.
- R. Joseph and K. Girish Kumar, Anal. Lett., 2009, 42, 2309 CrossRef CAS.
- B. Saraswathyamma, M. Pajak, J. Radecki, W. Maes, W. Dehaen, K. Girish Kumar and H. Radecka, Electroanalysis, 2008, 20, 2009 CrossRef CAS.
- K. Girish Kumar, P. Augustine, S. John, J. Radecki and H. Radecka, Anal. Lett., 2008, 41, 1144 CrossRef.
- K. Girish Kumar, S. John, P. Augustine, R. Poduval and B. Saraswathyamma, Anal. Sci., 2007, 23, 291 CrossRef.
- P. F. Huang, L. Wang, J. Y. Bai, H. J. Wang, Y. Q. Zhao and S. D. Fan, Microchim. Acta, 2007, 157, 41 CrossRef CAS.
- L. S. Duan, F. Xie, F. Zhou and S. F. Wang, Anal. Lett., 2007, 40, 2653 CrossRef CAS.
- S. P. Ozkorucuklu, Y. Sahin and G. Alsancak, Sensors, 2008, 8, 8463 CrossRef CAS.
- L. Ozcan, M. Sahin and Y. Sahin, Sensors, 2008, 8, 5792 CrossRef CAS.
- W. Bird and D. G. M. Diaper, Can. J. Chem., 1969, 47, 145 CrossRef.
- E. Laviron, J. Electroanal. Chem., 1979, 101, 19 CrossRef CAS.
- Pharmacopoeia of India, 3rd Edition, Controller of Publications, Government of India, Delhi, 1985, 407 Search PubMed.
| This journal is © The Royal Society of Chemistry 2010 |
