Authentication of the protected designation of origin horchata de Valencia through the chemometric treatment of mineral content†
Katharina
Boeting
ac,
Zully
Aguilera de Benzo
bc,
M. Luisa
Cervera
*c and
Miguel
de la Guardia
c
aInstitute of Inorganic and Analytical Chemistry, Johannes Gutenberg-University of Mainz, Duesbergweg 10-14, D-55128, Mainz, Germany
bLaboratorio de Química Analítica, Centro de Química. Instituto Venezolano de Investigaciones Científicas. IVIC, Apdo Postal 20632, Caracas, 1020-A, Venezuela
cDepartment of Analytical Chemistry, Universitat de València, Edifici Jeroni Muñoz, 50th Dr Moliner St., 46100, Burjassot, València, Spain. E-mail: m.luisa.cervera@uv.es; Fax: +34 963544845; Tel: +34 963543486
First published on 28th September 2010
Abstract
Spanish horchata de chufa samples were authenticated based on the determination of mineral elements by inductively coupled plasma atomic emission spectrometry (ICP-OES) combined with different chemometric methods. The ability of multivariate analysis, such as principle components analysis (PCA), classification and regression trees (CARTs) and discriminant analysis (DA) were evaluated in order to achieve a correct sample classification. It was possible to clearly differentiate homemade and long-life commercial samples by all three methods and CART and DA provided an excellent tool to establish the growth origin of the tiger nuts. CART analysis employed the concentration of Mg to discriminate between long-life and homemade samples and Cu to separate Spanish and African tiger nuts. DA allowed the separation of the studied samples, obtaining a good accuracy by the re-substitution method of 100% for both, the origin of the tiger nut and the process of preparation. From the methodological point of view it is clear that DA treatment of mineral concentrations at part per million levels is an excellent tool for the control of the beverages prepared from tiger nuts grown in the Valencia area.
Introduction
Horchata de chufas is a sweet non-alcoholic beverage typically produced and consumed in Spain. It is obtained from dried tiger nut tubers (Cyperus esculentus L.) which are grounded, extracted with water and sweetened with sugar.1Provenance studies of horchata samples yield essential information to authentication studies, being especially important from the commercial point of view due to the fact that the tiger nut production area in Valencia is very restricted and it has been protected from the tubers produced in outside areas, like Africa, by the designation of origin “Chufa de Valencia”.
The main goal of provenance studies is to identify a set of characteristics in the samples that can be used to establish the samples sources.2 The content of selected minerals and trace elements in food reflects the soil type and the environmental growing conditions. A protected designation of origin (PDO) of food covers agricultural products and foodstuffs which are produced and prepared in a given geographical area using recognized know-how. The use of mineral trace-element and isotopic composition for characterizing the PDO of food samples has grown significantly, probably due to legal interest in protecting indigenous products and to the improvement in available instrumentation.3
The techniques of choice to obtain the fingerprinting of food samples are those based on a specific unique characterization and those based on multi-parameter detection capability. Inductively coupled plasma optical emission spectrometry (ICP-OES) and inductively coupled plasma mass spectrometry (ICP-MS), which are suitable for the accurate and fast determination of trace and ultra-trace elements in the same sample are thus, highly appropriated analytical tools for food authentication.
Fingerprint techniques, based on chemical composition and multivariate statistical analysis,4,5 can be used for characterizing or classifying products according to their origin, quality, variety or type. Principal component analysis (PCA) is a tool for data compression, information extraction and finds combinations of variables, or factors, which describe major trends in the samples. It is a very useful tool for identifying whether samples are the same or different, and what variables are responsible. Discriminant analysis (DA) is a technique for classifying a set of observations into predefined classes. On the other hand, classification and regression trees (CARTs) offer a methodology for explaining and predicting differences between analogous samples. If the response is categorical, the final output is a classification tree and if it is continuous, a regression tree is obtained. This technique is a splitting procedure that divides the data into sub-groups (nodes) that are more homogeneous with respect to the response of the initial data set. The splitting of the nodes continues until terminal nodes are obtained or a small number of objects in the terminal nodes are reached.6,7
To the best of our knowledge, there is no published work about the determination of trace minerals in horchata samples or analytical tools for the assessment of samples provenance. Therefore, this study has been made of the possibility of classifying horchata samples by the determination of trace elements at mg L−1 level and statistical discrimination methods in order to contribute to food's provenance studies.
Experimental
Apparatus
A dual viewed ICP-OES instrument, Perkin Elmer, Model Optima 5300 DV spectrometer (Norwalk, CT, USA) equipped with an autosampler AS 93-plus and a cross-flow nebulizer was used throughout this work. Argon C-45 (purity higher than 99.995%) supplied by Carburos Metalicos (Barcelona, Spain) was employed. The operating conditions of the ICP-OES equipment are summarized in Table 1.| Parameter | Value |
|---|---|
| RF power | 1300 W |
| Gas | Argon |
| Plasma gas | 15 L min−1 |
| Auxiliary gas | 0.2 L min−1 |
| Nebuliser gas | 0.8 L min−1 |
| Sample aspiration rate | 1.1 mL min−1 |
| View | Axial and Radial (Ca, K, Mg, Na) |
| Background correction | 2 - points |
| Number of replicates | 3 |
| Nebuliser | Cross-flow |
A microwave laboratory system, Ethos SEL from Millestone (Sorisole, Italy), equipped with a thermocouple probe, for automatic temperature control, and an automatic gas detector, operated at a maximum power 1000 W, was employed for microwave-assisted digestion of horchata samples using high pressure Teflon vessels of 100 mL inner volume. For cleaning these vessels an automatic cleaning device traceCLEAN from Millestone was used. Additionally, 9 L ultrasound water bath from Selecta (Barcelona, Spain) with 50 W power and 50 Hz frequency was employed for sample sonication.
Reagents
ICP multi-element solution (100 mg L−1) of 26 elements (Al, As, B, Ba, Be, Bi, Ca, Cd, Co, Cr, Cu, Fe, K, Li, Mg, Mn, Mo, Na, Ni, Pb, Se, Sr, Ti, Tl, V and Zn) and a multi-elemental (100 mg L−1) solution containing 16 lanthanides (Ce, Dy, Er, Eu, Gd, Ho, La, Lu, Nd, Pr, Sm, Sc, Tb, Tm, Yb, and Y) both from Scharlau Chemie S.A. (Barcelona, Spain), were used to prepare the working standard calibration solutions. For major elements (Ca, Mg, K, Na) uni-elemental AA standard solutions (1000 mg L−1) from Scharlau Chemie were employed. As internal standard a Ruthenium solution (1000 mg L−1) from Fluka (Buchs, Switzerland) was used. Nitric acid 69% (w/v) from J.T. Baker (Deventer, The Netherlands), H2O2 35% reagent grade from Scharlau and nanopure water (18.2 MΩ cm) obtained from a Milli-Q-Millipore system (Bedford, MA, USA) were used for sample preparation.Samples
Samples were collected from different supermarkets and local establishments which sell homemade products in Valencia. A total of 30 commercial and 4 homemade samples were bought. Twenty two of these samples were certificated as prepared from tiger nuts produced in Valencia. Different batches for some of them were also analyzed. Table 2 shows the details on the horchata samples employed throughout this study. Eighteen samples had the PDO specific label and the rest of them did not have this certificate.| Sample Identification | Batch |
|---|---|
| a Samples prepared from chufa de Valencia tiger nuts. | |
| CHUFI Maestro Horchateroa | 138, 139, 146, 146, 203 |
| CHUFI la Originala | 097, 166, 201, 203, 204, 215 |
| Horchata de chufa de Valenciaa | 057, 211, 217 |
| CHUFI ligera | 211, 223 |
| Puleva Che | 029-43 |
| Horchata de Chufa UHT | 923732, 923831, 924741 |
| Horchata de Chufa ecológica | 9142 |
| La Horchata | 921031, 921932, 922532 |
| Horchata de Chufa Costa | 9184 |
| Horchata de Chufa Consuma | 230, 259, 259, 175 |
| Horchata de Chufa condensada | 22409 |
| Homemade Horchata Rina | |
| Homemade Horchata unsweetened Rina | |
| Homemade Horchata Daniela | |
| Homemade Horchata unsweetened Daniela |
Two tiger nuts samples from Africa and five samples produced in Valencia were also employed to verify the differences found between the horchata samples elaborated from Spanish and African tiger nuts. Samples were homogenized, opened and stored in plastic containers at 4 °C till their analysis. The plastic containers used for storage and treatment were previously cleaned in a 10% nitric acid bath. Then, they were rinsed with Milli-Q water.
Sample digestion
For tiger nuts analysis, 0.5 g of sample were digested in the same way as that for the horchata samples.
ICP-OES determination
The calibration range for 22 trace elements was from 0.05 to 1 mg L−1, for the 16 lanthanides considered it was from 0.005 to 1 mg L−1, and for the major elements (Ca, Mg, K, Na) it was from 1 to 60 mg L−1. Ruthenium (1 mg L−1) was used as internal standard and added to both, samples and standards. Measurement of all the minor and trace elements were made in the axial mode except for Ca, Mg, Na and K which were measured in the radial mode.Statistical analysis
Evaluation and analysis of data were carried out by means of XLSTAT software version 2009.6.03.8 Discriminant analysis (DA), principle component analysis (PCA) and classification and regression trees (CARTs) were performed on the mineral profile of the studied samples.Although 42 elements were evaluated, the calculations were made using only 18 variables. The concentration of the 16 lanthanides and those of As, Ba, Be, Bi, Cr, Co, Pb, Ni were lower than the limit of detection (LOD) of the technique in all samples analyzed and thus were not used in data treatment.
Results and discussion
Evaluation of the analytical methodology
A microwave digestion method was developed for this type of sample. Samples were predigested inside the reaction vessels with the reagents, allowing the reaction mixture to react for half an hour, shaking in an ultrasonic bath, uncapped under a fume hood, prior to putting the reactors in the microwave oven. All these steps were required to avoid foam formation and overpressure during the final digestion. Microwave parameters such us power, temperature and time were evaluated on the same sample matrix in order to obtain the best results (between 500 to 1000 watts, 30 to 190 °C and 5 to 30 min, respectively). A total digestion resulted in a clear, precipitate free solution that was stable on standing at 4 °C. Selected parameters were shown in the Experimental Section.In ICP-OES emphasis is given to the effects caused by alkaline and alkaline-earth elements on emission intensity measurements at low and high aerosol loadings (concentric, microconcentric, ultrasonic and cross-flow nebulizers). These elements can modify excitation and ionization plasma conditions. These effects can be generated by physical processes that affect sample introduction, e.g. sample viscosity, surface tension, and effects induced by the presence of a high concentration of dissolved solids, or by modification of excitation and ionization conditions of the plasma. One way to solve problems produced by the matrix consists of diluting the samples, at the expense of lowering the detection limit capability. Therefore, a study of different dilution factors: 1![[thin space (1/6-em)]](https://www.rsc.org/images/entities/char_2009.gif) :104, 1:103, 1:102, 1:10, 1:2 and the direct measurement of undiluted digested sample was applied to the horchata sample solutions in order to overcome possible interferences, if any. Table 3 shows these results where it can be seen that the mineral content of the major elements (Ca, Mg, Na, K) present at the studied dilutions are not statistically different, thus, it can be said that there is not physical nor matrix interferences.
:104, 1:103, 1:102, 1:10, 1:2 and the direct measurement of undiluted digested sample was applied to the horchata sample solutions in order to overcome possible interferences, if any. Table 3 shows these results where it can be seen that the mineral content of the major elements (Ca, Mg, Na, K) present at the studied dilutions are not statistically different, thus, it can be said that there is not physical nor matrix interferences.
| Elements | Undiluted | 1/2 dilution | 1/10 dilution | 1/100 dilution |
|---|---|---|---|---|
| Ca 317.933 | 33.2 | 36.5 | 32.6 | |
| Mg 285.213 | 60.3 | 67.1 | 63.2 | |
| K 766.490 | 311.6 | 343.7 | 323.5 | 307.6 |
| Na 589.592 | 269.5 | 295.0 | 279.3 | 270.1 |
Regarding blank measurements, the intensities were at the same level than the calibration blank solution (2% HNO3) and compared with slopes of calibration these intensities represent from 0.0003% for Cd to 1.8% for Fe.
Additionally, to verify possible interference effects and baseline correction at different spectral regions, a study was carried out at several wavelengths for each element and the standard calibration curves where compared with their respective standard addition curves (see Table† in the ESI). In general, those lines recommended by the instrument, as the most sensitive ones, were chosen for further studies for several reasons: i) they present the minimum deviation between the slopes of both calibration modes (as for Al, Ba, Cu…, supporting information table and Fig. S1†), ii) the baselines of standards and samples were comparable (Fig. S2† in the ESI shows baseline differences between them in the case of Tl), and iii) no inter-element interference was present (Fig. S3† for Ni) at the wavelength chosen.
The general conclusion of the aforementioned studies indicated that digested undiluted samples and the use of three standard calibration solutions: one set of calibrations for trace elements determination; one for lanthanides and one for major elements were the most appropriate conditions for analysis.
The choice of a suitable reference element (internal standard) and the use of relative measurement of the emission intensities of the analyte and the internal standard can compensate matrix-induced signal variations as well as the flicker noise and drift, thus leading the improvement of accuracy and repeatability. In this study, the elements Ru and Sc were tested as internal standards for the determination of mineral elements in horchata samples. The results obtained from the analysis of the samples with both elements showed that there are not significant differences when using either of them. However, as the Sc is one of the lanthanide elements of interest, it is recommended to use Ru.
Mineral content of horchata samples
Table 4 shows the maximum, minimum and mean values of Al, B, Cd, Ca, Cu, Fe, Li, Mg, Mn, Mo, K, Se, Na, Sr, Tl, Ti, V and Zn concentrations for samples, as a function of their certificate label and homemade manufacture, expressed as nanograms per grams. It can be seen from this table that mineral compositions of horchata samples cannot effectively discriminate between those groups. So, it is necessary to apply statistical treatment to the aforementioned data in order to distinguish between groups. Results found to be under the detection limit were taken by assuming these values in data calculations.| Element | With POD label | Without POD label | Homemade | |||||||||
|---|---|---|---|---|---|---|---|---|---|---|---|---|
| Max | Min | Mean | SD | Max | Min | Mean | SD | Max | Min | Mean | SD | |
| a Note: Max: maximum; min: minimum; SD: standard deviation and LOD: limit of detection. b Limit of detection values: Al. 784 ng g−1; B. 51 ng g−1; Cd. 6 ng g−1; Ca. 6986 ng g−1; Cu. 51 ng g−1; Fe. 905 ng g−1; Li. 1 ng g−1; Mg. 310 ng g−1; Mn. 7 ng g−1; Mo. 18 ng g−1; K. 922 ng g−1; Se. 176 ng g−1; Na. 14024 ng g−1; Sr. 22 ng g−1; Tl. 542 ng g−1; Ti. 8 ng g−1; V. 162 ng g−1 and Zn. 170 ng g−1. | ||||||||||||
| Al | 1884 | < LOD | 1000 | 300 | 1824 | < LOD | 1000 | 300 | 1305 | 1077 | 1000 | 100 |
| B | 133 | < LOD | 80 | 20 | < LOD | < LOD | < LOD | < LOD | 54 | 52 | 50 | 20 |
| Cd | < LOD | < LOD | < LOD | < LOD | 14 | < LOD | 7 | 2 | 15 | 7 | 8 | 2 |
| Ca | 64681 | 28754 | 40000 | 10000 | 53153 | 8153 | 30000 | 10000 | 97563 | 37313 | 50000 | 1000 |
| Cu | 761 | 324 | 500 | 100 | 442 | 123 | 200 | 100 | 878 | 713 | 800 | 20 |
| Fe | 1696 | 919 | 1000 | 200 | 2369 | < LOD | 2000 | 400 | 1757 | 1340 | 2000 | 100 |
| Li | 30 | 7 | 20 | 6 | 25 | 2 | 20 | 6 | 24 | 17 | 20 | 1 |
| Mg | 79909 | 36609 | 60000 | 10000 | 61177 | 28385 | 50000 | 10000 | 128607 | 91682 | 100000 | 3000 |
| Mn | 125 | 67 | 90 | 20 | 431 | 141 | 300 | 100 | 168 | 135 | 100 | 5 |
| Mo | 47 | < LOD | 40 | 10 | 36.17 | < LOD | 30 | 7 | 51 | 25 | 40 | 9 |
| K | 378438 | 164739 | 300000 | 60000 | 519986 | 132536 | 300000 | 100000 | 503328 | 402608 | 500000 | 10000 |
| Se | < LOD | < LOD | < LOD | < LOD | < LOD | < LOD | < LOD | < LOD | 284 | 213 | 200 | 50 |
| Na | 363688 | 46688 | 300000 | 80000 | 332188 | 20893 | 100000 | 100000 | 147495 | 49939 | 100000 | 5000 |
| Sr | 523 | 242 | 400 | 90 | 667 | 108 | 300 | 200 | 1336 | 388 | 700 | 15 |
| Tl | 1606 | 574 | 800 | 300 | < LOD | < LOD | < LOD | < LOD | 973 | 785 | 900 | 150 |
| Ti | 127 | 11 | 20 | 30 | 52 | 10 | 30 | 10 | 29 | 26 | 30 | 5 |
| V | 943 | 320 | 500 | 200 | 575 | 211 | 400 | 100 | 863 | 418 | 700 | 40 |
| Zn | 2724 | 1139 | 2000 | 500 | 1633 | 641 | 1000 | 400 | 3804 | 2800 | 3000 | 100 |
Principal component analysis of horchata samples
PCA reduces the data dimension to some principal components providing a new set of variables obtained as the best linear combination of the original parameters. PCA also enables the extraction of the differences between samples and the main variables. Two principal components were enough to explain 55.9% of the variance and three principal components, explained 71.5%. However, as it can be seen in Fig. 1, the classification pattern which was obtained from 18 variables, the Al, B, Cd, Ca, Cu, Fe, Li, Mg, Mn, Mo, K, Se, Na, Sr, Tl, Ti, V and Zn concentration in ng g−1 did not produce a clear discrimination between Valencia PDO samples and those elaborated from foreign tiger nuts nor the differentiation between commercial long-life and homemade samples.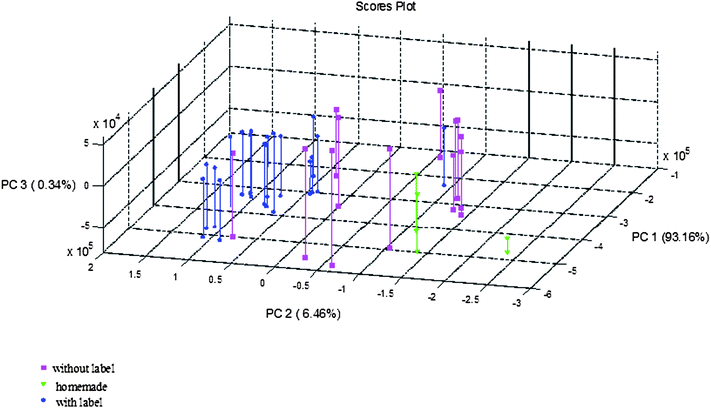 | ||
| Fig. 1 PCA scores for three different provenance horchata samples. | ||
Classification and regression trees for discrimination of horchata samples
The CART method was applied to 34 horchata samples while using the 18 aforementioned parameters. It results in a model which clearly discriminates at least between two categories, homemade and commercial products based on the Mg concentration. The tree resulting from the CART model is represented in Fig. 2 and it can be seen that Cu is also an important element to do the discrimination between PDO certificated and uncertified samples.The tree clearly confirms that homemade and commercial horchata samples can be very easy discriminated. Indeed, the correct re-substitution rate achieved by CART for homemade is 100% and only uses the value of Mg concentration. The homemade samples contained a high level of this element as compared to the rest of the samples. On the other hand, it is difficult to discriminate between samples with and without PDO label. High level of copper concentration can be used as a discriminating criterion. Labeled samples are characterized by low values of Mg, but high values of Cu. However, the correct re-substitution rate achieved in this case was only 75%.
 | ||
| Fig. 2 Classification tree of horchata de chufa samples. | ||
Discriminant analysis as a tool to verify the PDO of chufa de Valencia
A multivariate statistical analysis approach, based on discriminant analysis (DA), was employed to classify the information provided by the different elements determined. The discriminant information associated with the mineral content can be grouped in the two first discriminant functions which are shown to account for 87.3 and 12.7% of the total discriminating power. The variables included in the analysis are determined with a stepwise-LDA, using a Wilk's Lambda selection criterion and a F-statistic factor, to establish the significance of changes in Lambda when a new variable is tested. The prediction capacity of the discriminant models was studied by re-substitution in order to determine the stability of the model. In this sense, the classification results were based on the computation of the aforementioned two first discriminant functions.The relevant standardized function coefficients were derived in order to identify the most significant variables (in this case, element) that contribute to the calculation of the discriminant functions. Fig. 3a and b show the obtained results. It can be seen that all elements contribute to the classification of horchata samples according to their manufacture and the certificate label.
 | ||
| Fig. 3 Discriminant analysis plots for horchata de chufa samples. | ||
The relevant discriminant scores were calculated for each sample. Classification and differences between groups can be shown in Fig. 3b by projecting the set of discriminant scores in the two-dimensional plot defined by the first and second discriminant functions. The highest differentiation potential was shown to be linked to the direction of the first discriminate function, enabling complete resolution between homemade and commercial samples and for the second function which clearly discriminates Valencia PDO samples.
The apparent classification of results obtained by the re-substitution method is shown in Table 5. The percentage of correct classification reached 100% for all.
| From\To | Homemade | With POD label | Without POD label | Total | % correct |
|---|---|---|---|---|---|
| Homemade | 4 | 0 | 0 | 4 | 100.00% |
| With POD label | 0 | 18 | 0 | 18 | 100.00% |
| Without POD label | 0 | 0 | 12 | 12 | 100.00% |
| Total | 4 | 18 | 12 | 34 | 100.00% |
Analysis of tiger nuts
Twenty six elements were determined in tiger nut samples obtained from Valencia and Africa and except for As, Be, B, Pt, Tl and V for which signals obtained were in all cases under the limit of detection, concentrations of the order of mg kg−1 were found in the main part of cases.Data reported in Table 6 show that the concentrations of the mineral elements determined are of the order of 10 to 20 times higher than values found in horchata samples which agree well with the average composition of beverages. On the other hand, average values obtained for Spanish and African samples are quite different.
| Element | Valencia nuts/μg g−1 | Africa tiger nuts/μg g−1 | LOD/μg g−1a |
|---|---|---|---|
| a LOD: limit of detection. | |||
| Al | 20 ± 6 | 34 ± 4 | 0.3 |
| Ba | 0.4 ± 0.1 | 1.5 ± 0.2 | 0.04 |
| Bi | < LOD | <LOD - 0.3 | 0.2 |
| Cd | 0.09 ± 0.01 | 0.09 ± 0.01 | 0.02 |
| Ca | 385 ± 42 | <LOD - 80 | 76 |
| Cr | < LOD | 1.3 ± 0.4 | 0.5 |
| Co | < LOD | 0.09 ± 0.05 | 0.05 |
| Cu | 6 ± 1 | 1.5 ± 0.1 | 0.14 |
| Fe | 23 ± 4 | 35 ± 2 | 0.21 |
| Li | 0.04 ± 0.01 | 0.023 ± 0.002 | 0.003 |
| Mg | 829 ± 25 | 633 ± 71 | 18 |
| Mn | 1.6 ± 0.1 | 6.4 ± 1.0 | 0.04 |
| Mo | 0.25 ± 0.04 | < LOD | 0.15 |
| Ni | 0.7 ± 0.4 | 1.1 ± 0.1 | 0.3 |
| K | 4216 ± 461 | 6189 ± 573 | 7.8 |
| Se | 1.0 ± 0.2 | 0.9 ± 0.1 | 0.5 |
| Na | 93 ± 24 | 32.0 ± 0.1 | 27 |
| Sr | 4.4 ± 0.2 | 1.4 ± 0.2 | 1.3 |
| Ti | 0.5 ± 0.1 | 1.0 ± 0.3 | 0.12 |
| Zn | 26 ± 2 | 11 ± 3 | 0.8 |
Data found evidence of high levels of Mn, K and Ti in African samples as compared with the Spanish ones and low levels of Ca, Cu, Mg, Na, Sr and Zn in the African tiger nuts, thus evidencing once again the possibility offered by the mineral content to do the authentication of the horchata de chufa de Valencia by the proposed methodology.
Conclusion
The methodology developed through this study for the determination of mineral elements in horchata samples by inductively coupled plasma atomic emission spectrometry and the application of discriminant analysis method for mineral element data process provides an useful tool to verify the origin of horchata samples made from different provenance tiger nuts (chufa) and to differentiate between homemade and commercial samples in spite of the high dilution factor of the tiger nuts in the final beverage.In spite of the reduce number of tiger nut samples from different origins analyzed that cannot permit us to do a statistical evaluation of the proposed methodology, it is clear that mineral component is an appropriate tool for chufa de Valencia authentication and data found for solid sample analysis are in a good agreement with the results found in beverage analysis.
Acknowledgements
Authors acknowledge the financial support of the Ministerio de Ciencia e Innovacion project AGL2007-64567, Dirección General de Salud Pública-Generalitat Valenciana Project PLAT2009-A-005. Z. Benzo acknowledges the Universidad de Valencia for the invited researcher fellow UV-ESTPC-09-5768 and Instituto Venezolano de Investigaciones Científicas, IVIC for allowing her sabbatical leave.References
- L. A. Mosquera, C. A. Sims, R. P. Bates and S. O'Keefe, J. Food Sci., 1996, 61, 856–861 CrossRef.
- G. Thiel, G. Geisler and I. Blechschmidt, Anal. Bioanal. Chem., 2004, 378, 1630–1636 CrossRef CAS.
- A. Gonzalvez, S. Armenta and M. de la Guardia, Trends Anal. Chem., 2009, 28, 1295–1311 CrossRef.
- D. D Wolf, M. L. Parsons, in Pattern recognition approach to data interpretation, Ed. Plenum Press, New York and London, 1983 Search PubMed.
- K. Danzer, H. Hobert, C. Fischbacher, K-U., in Jagemann, Chemometrik-Grundlagen und Anwendungen, Springer, Berlin Heidelberg New York, 2001 Search PubMed.
- A. Gonzalvez, A. Llorens, M. L. Cervera, S. Armenta and M. de la Guardia, Food Chem., 2009, 112, 26–34 CrossRef CAS.
- X. Capron, J. Smeyers-Verbeke and D. L. Massart, Food Chem., 2007, 101, 1585–1597 CrossRef CAS.
- XLSTAT software package 2009 (http://www.xlstat.com/).
Footnote |
| † Electronic supplementary information (ESI) available: Supporting information available: Table: comparison between the slopes of the calibration and the standard addition curves. Fig. S1, S2 and S3: Spectra of standard solutions and horchata samples at different wavelengths in order to demonstrate the matrix and inter-element interferences. See DOI: 10.1039/c0ay00332h |
| This journal is © The Royal Society of Chemistry 2010 |