A flow-injection chemiluminescence method for determination of cinchona alkaloids in pharmaceuticals and biological fluids
Liqing
Li
ab and
Hanwen
Sun
*a
aCollege of Chemistry and Environmental Science, Hebei University, Key Laboratory of Analytical Science and Technology of Hebei Province, Baoding, 071002, China. E-mail: hanwen@mail.hbu.edu.cn.
bDepartment of Chemistry, Taishan University, Taian, 271021, China
First published on 8th July 2010
Abstract
A new analytical method for the determination of cinchona alkaloids by flow-injection sampling and chemiluminescence (CL) detection is developed. A weak CL can be emitted by oxidation reaction of cinchona alkaloid with potassium permanganate. The conditions for CL emission were investigated and optimized. The linear range of 1.0 × 10⁻⁷ – 8.0 × 10⁻⁵ g mL−1 was obtained for quinine, quinidine and cinchonine. The detection limit was 3.2 × 10⁻⁸ g mL−1 for quinine and 3.0 × 10⁻⁸ g mL−1 for quinidine and cinchonine. The recoveries of the three drugs from urine and serum samples were in the range of 95.0–105% with RSDs of 1.7–2.0%. The proposed method was used for the determination of cinchona alkaloids in pharmaceuticals and biological fluids with satisfactory result. The possible CL mechanism is also discussed.
Introduction
Cinchona alkaloids, which include the pharmaceuticals quinine (QN), quinidine (QD) and cinchonine (CCN), continue to have a wide variety of important uses. Quinine was the only available remedy to treat malaria, a potentially fatal disease which has been prevalent worldwide for more than three centuries,1 and which has caused the death of millions of people.2 Quinidine and cinchonine have been used clinically to treat malaria caused by Plasmodium falciparum. These drugs tend to have narrow therapeutic limits, being toxic in high doses, but ineffectual if the administered dose is too low,3,4 so the determination and assessment of quinine or quinidine and their metabolites in human biological fluids is of importance.A number of different methods have been developed for the qualitative and quantitative analysis of these compounds in a variety of sample matrices. Zero-crossing derivative spectrometry was described for CCN measurement.5 A CCN-selected electrode was used to determine CCN, which was not sensitive enough to detect CCN concentration in human body fluid.6 An ion-selective capacitive sensor was applied to determine CCN.7 In 2002, McCalley reviewed the analysis of the Cinchona alkaloids by high-performance liquid chromatography (HPLC), thin-layer chromatography, gas chromatography, capillary electrophoresis and capillary electrochromatography.8 Among these, HPLC in reversed-phase mode using UV detection is still the method of choice for the analysis of cinchona alkaloids. HPLC with fluorescence detection had been used for the determination of cinchona alkaloids and vitamin B6, this method was applied to the quality control of cinchona bark, liquid extract and cosmetics.9 A liquid chromatographic method was described for the determination of cinchona extract (whose main components are the alkaloids cinchonine, cinchonidine, quinidine, and quinine) in beverages with a detection limit of 2 × 10⁻⁶ g mL−1 for each cinchona alkaloid.10 Liquid chromatography was effective for the separation and determination of the cinchona alkaloids, but required the use of a mass of organic solvents, the procedure was complicated, and also, sensitivity needs to be improved.
The reported fluorescence method had high sensitivity,11,12 with a limit of detection (LOD) of 2 × 10⁻¹⁰ g mL−1 for QN and QD, but the method was used only for the determination of QN alone in some pharmaceutical preparations,11 QN in tonic waters and pharmaceutical shampoo, and QD in pharmaceuticals preparations.12
Chemiluminescence (CL) methods have some advantages such as sensitivity, rapidity, ease and simple instrumentation. Chemiluminescence has been used frequently for the analysis of pharmaceutical compounds. Cerium(IV) is frequently used as the oxidant in CL reactions in fluoroquenolones analysis. CL reactions of cerium(IV) and reductant in acid medium have been studied extensively for determination of fluoroquenolones.13 CL intensity is enhanced through intermolecular energy transfer from the excited SO2* state to analytes. A new sensitized CL system based on the use of acidified KMnO4 as the oxidant in the presence of formaldehyde has been described for determination of hydroxycamptothecin,14 methotrexatum,15 and adriamycin and mitomycin.16 The CL spectra showed peaks at 639 or 649 nm, in good agreement with the CL emissions of 1O21O2(1△g1△g) at 643 nm.17 Illuminant was suggested to be a singlet state bi-molecule oxygen, 1O21O2(1Δg1Δg), which formed from 1O2 (1Δg) produced in the reaction system.
Based on the oxidation of sulfide by cerium(IV), a CL method was described for the determination of QN and QD in tablets with the LOD of 1.6 × 10⁻⁶ g mL−1,18 and another CL method for the determination of QN, QD and CCN was presented with a LOD of 1 × 10⁻⁸ QN, 4 × 10⁻⁸ QD and 6 × 10⁻⁷ g mL−1 CCN, respectively.19 Because there is self absorption in acid cerium(IV) solution for CL emission, the sensitivity could not be increased further by increasing cerium(IV) content. A CL system of H2O2–NaIO4–cinchona alkaloid was used to determine QN, QD and CCN in injections with LODs of 2.5 × 10⁻⁸, 1.4 × 10⁻⁸g mL−1 and 3.5 × 10⁻⁷g mL−1, respectively.20 A flow injection CL method with Mn3+ as the oxidant was presented for determination of QN in a pharmaceutical dosage form.21 A direct CL reaction of QN and cobalt(III) in sulfuric acid medium has been described for the determination of QN in pharmaceutical preparations.22 However, these CL methods were utilized only for the determination of 1–3 kinds of cinchona alkaloids in pharmaceutical preparations. It is necessary, therefore, to develop a new and sensitive CL method for the analysis of QN, QD and CCN in biological fluids.
In our work we discovered that potassium permanganate can oxidize cinchona alkaloids and the CL intensity is greatly enhanced by sodium hyposulfite. Based on this phenomenon, a new CL method is developed for the determination of cinchona alkaloids. The proposed method was used for the simple and rapid determination of cinchona alkaloids in pharmaceuticals and biological fluids. The possible CL mechanism is also described.
Experimental
Apparatus
A MPI-B flow injection analysis system (Xi'an Ruimai Electronic Equipments Company, China) was used for the determination of cinchona alkaloids. The system consisted of two peristaltic pumps working at a constant flow rate (3.0 mL min−1) and a six-way injection valve with a sample loop (120 μL), which is automatically operated by a computer equipped with a software for operation system of MPI-B flow injection analysis. The flow cell used is a twisted glass tube in order to produce a sufficiently large surface area exposed to the adjacent photomultiplier tube (PMT) (Hamamatsu, Japan). The distance between the valve and detector is 10 cm. PTFE tubing (0.8 mm i.d.) was used to connect all components in the flow system. The KMnO4 solution and polyphosphoric acid (H6P4O13) solution were mixed through a three-way pipe and the mixture flowed into the flow cell. A mixture of sample and Na2S2O4 solution was injected to the sample valve and an analyzer recorded the signal from the CL reaction.Chemicals
All chemicals used were of analytical reagent grade. Deionized water was used throughout. Quinine, quinidine and cinchonine stock standard solutions (0.5000 g L−1) were prepared by dissolving 25.0 mg quinine, quinidine and cinchonine in 1 mL 0.2 mol L−1 HCl and diluting with water to 50 mL, respectively. More dilute solutions were prepared by diluting the freshly prepared stock solution. A stock solution of KMnO4 (5 × 10⁻² mol L−1) was prepared by dissolving a weighed amount of KMnO4 in water and diluting to volume. Na2S2O4 solution (2 × 10⁻³ mol L−1) and H6P4O13 solution (0.5 mol L−1) were prepared daily.Procedure
As shown in Fig. 1, all solutions were continuously pumped. A 120 μL mixture solution of cinchona alkaloids and Na2S2O4 were injected to a mixed stream of KMnO4 and H6P4O13 solutions. The mixed solution was transferred to the CL flow cell, and gave an intensive CL signal immediately. The signal from the CL reaction was recorded by an analyzer. The relative CL intensity is proportional to the concentration of cinchona alkaloids.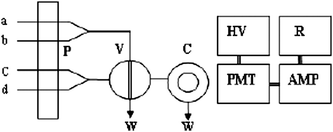 | ||
| Fig. 1 Schematic diagram of flow injection CL analysis system (a) potassium permanganate; (b) polyphosphoric acid; (c) sample; (d) sodium hyposulfite. P: peristaltic pump; V: sampling inlet valve; C: flowing cell; W: waste; PMT: photomultiplier tube; HV high voltage; V: sampling inlet valve; AMP: amplifier; R: recorder. | ||
A 1 mL volume of serum or urine sample was deproteinized by adding 4.0 mL 10% trichloroacetic acid (CCl3COOH) in a centrifuge tube, which was then centrifuged for 15 min at 4000 rpm. Human serum and urine were kindly provided by Hebei University Hospital. The standard addition method was used to avoid matrix effects.
Results and discussion
Choice of inorganic acids
The kind and concentration of acid used in the reaction has a very significant influence on the CL emission intensity. Therefore, several kinds of acid, such as HCl, H2SO4, H6P4O13, HNO3 and H3PO4, were added to the KMnO4 solution to test the effect on the CL signal. The highest emission and stable signals were observed from H6P4O13-treated potassium permanganate solutions. Hence, H6P4O13 was chosen for further work. The concentration of H6P4O13 in KMnO4 solution was subsequently optimized (Fig. 2). The CL emission intensity was hardly influenced by the concentration of H6P4O13 in KMnO4 solution. The CL intensity increased with increasing H6P4O13 concentration up to 1.0, 0.1 and 0.5 mol L−1 for QN, QD and CCN, respectively, and decreased over these concentrations. It is possible that due to H6P4O13 being easy hydrolyzed at a too low H6P4O13 concentration, CL emission efficiency of the reaction system was lower at high H6P4O13 concentration.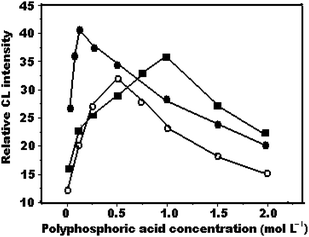 | ||
| Fig. 2 Effect of H6P4O13 concentration on relative CL intensity (a) quinine, 1 × 10⁻³ mol L−1 KMnO4, 5 × 10⁻⁴ mol L−1 Na2S2O4; (b) quinidine, 7.5 × 10⁻⁴ mol L−1 KMnO4, 5 × 10⁻⁴ mol L−1 Na2S2O4; (c) cinchonine, 1 × 10⁻³ mol L−1 KMnO4, 1 × 10⁻³ mol L−1 Na2S2O4. | ||
Effect of potassium permanganate concentration
The KMnO4 concentration not only had an effect on the sensitivity, but also influenced the linear range of the assay. The dependence of KMnO4 concentration on CL intensity was investigated for 1.0 × 10⁻⁶ g mL−1 of QN, QD and CCN. The results (Fig. 3) showed that the maximum CL intensity was obtained when the KMnO4 concentration was 1 × 10⁻³, 7.5 × 10⁻⁴ and 1 × 10⁻³ mol L−1 for QN, QD and CCN, respectively, which was subsequently chosen as the optimal concentration.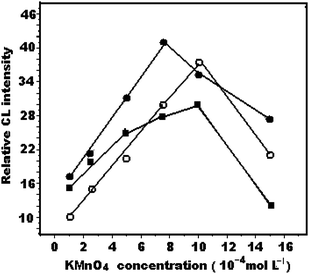 | ||
| Fig. 3 Effect of potassium permanganate concentration on relative CL intensity (a) quinine, 1.0 mol L−1 H6P4O13, 5 × 10⁻⁴ mol L−1 Na2S2O4; (b) quinidine, 0.1mol L−1 H6P4O13, 5 × 10⁻⁴ mol L−1 Na2S2O4; (c) cinchonine, 0.5 mol L−1 H6P4O13, 1 × 10⁻³ mol L−1 Na2S2O4. | ||
Several kinds of sensitizer, such as HCOH, Na2SO3, Na2S2O3, Na2S2O4 and H2O2, were added to the CL system to test the effect on the CL signal. The highest emission and the most stable signals were observed with Na2S2O4 as a sensitizer because of its higher reducing ability. The concentration of Na2S2O4 has a significant influence on CL emission intensity. The effect of Na2S2O4 concentration in the range of 1 × 10⁻⁵ mol L−1 to 1.5 × 10⁻³ mol L−1 on the CL intensity was investigated. The results (Fig. 4) showed that CL intensity increased with increasing Na2S2O4 concentrations. The maximum CL intensity was obtained when the Na2S2O4 concentration was 5 × 10⁻⁴ mol L−1, 5 × 10⁻⁴ mol L−1 and 1 × 10⁻³ mol L−1 for QN, QD and CCN, respectively.
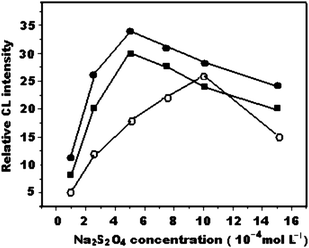 | ||
| Fig. 4 Effect of Na2S2O4 concentration on relative CL intensity (a) quinine, 1 × 10⁻³ mol L−1 KMnO4, 1.0 mol L−1 H6P4O13; (b) quinidine, 7.5 × 10⁻⁴ mol L−1 KMnO4, 0.5 mol L−1H6P4O13; (c) cinchonine, 1 × 10⁻³ mol L−1 KMnO4, 0.5 mol L−1 H6P4O13. | ||
Effect of sample volume and flow rate
The role of sample volume and flow rate is critical, for instance, if the sample volume is too small or too large, the maximum CL cannot be obtained. The highest emission was given off when the sample volume was 120 μL and flow rate was 3.0 mL min−1.Analytical performance
Under optimum conditions described above, the linearity was evaluated for each pharmaceutical using the proposed system. Regression equations of calibration curves (7 concentration points) are listed in Table 1.| Substance | Linear range/g L−1 | Correlation equation | Correlation coefficient | Detection limit/g L−1 | RSD% |
|---|---|---|---|---|---|
| I = aC + b | (n = 7) | ||||
| Quinine | 1.0 × 10⁻⁴∼8.0 × 10⁻² | I = 5.1 × 10⁻³C + 3.9 × 10⁻³ | 0.996 | 3.2 × 10⁻⁵ | 1.6 |
| Quinidine | 1.0 × 10⁻⁴∼8.0 × 10⁻² | I = 4.3 × 10⁻³C + 0.1 × 10⁻³ | 0.994 | 3.0 × 10⁻⁵ | 1.9 |
| Cinchonine | 1.0 × 10⁻⁴∼8.0 × 10⁻² | I = 10.4C × 10−3-1.1 × 10⁻³ | 0.989 | 3.0 × 10⁻⁵ | 1.7 |
The limit of detection (LOD) was determined as the sample concentration that produces a peak with a height three times the level of the baseline noise. The LOD was 3.2 × 10⁻⁸ g mL−1 (QN) and 3.0 × 10⁻⁸ g mL−1 (QD and CCN). The relative standard deviation (RSD) was lower than 2% for seven determinations of the analyte at 4 × 10⁻⁶ g mL−1.
The LOD of the proposed method was higher than that of the fluorescence method for QN and QD,11,12 lower than that of the liquid chromatographic method for QN, QD and CCN,10 and lower than that of CL methods for QN,18 QD18,19 and CCN.19,20 The high assay sensitivity allowed a 100–1000 fold dilution of the samples before analysis to avoid sample matrix effects.
Table 1 data illustrates that the proposed enhanced CL system has wider linearity, higher sensitivity and precision.
Interference studies
The influence of some common excipients on the CL intensity was investigated for determining each kind of cinchona alkaloid at 2 × 10⁻⁵ g mL−1 level by comparing with the CL emissions obtained using analyte solution alone or analyte solution with foreign species added. The tolerated ratios of foreign substances to 2 × 10⁻⁵ g mL−1 analyte were 50-fold for glucose, 25-fold for dextrin, starch, 20-fold for sodium benzoate, 100-fold for Zn2+, K+; 50-fold for Cr3+,Ba2+; 25-fold for Pb2+; 10-fold for Mn2+; 2-fold for Co2+, Cu2+and Ni2+; and equal for amounts of Fe3+. When serum and urine samples were deproteinized by adding 4.0 mL 10% trichloroacetic acid, metal ions combined with albumen were removed, so that there was no interference in the analysis of real samplesAnalysis of pharmaceutical and spiked serum and urine sample
The injection sample of quinine was a mixture which consisted of ten bottle quinine injection selected from same group randomly. The right amount of sample solution was taken in a 100 mL flask and diluted with water. A proper volume of the diluted sample solution and the standard cinchona alkaloid solution was added in a 50 mL flask, and diluted to volume with water. Under the optimum conditions described above recoveries were determined and calculated based on the equation of the standard curve. The results are listed in Table 2.| Content/10−2 g L−1 | Standard method/10−2 g L−1 | Added/10−2 g L−1 | Found/10−2 g L−1 | Recovery n = 7 (%) |
|---|---|---|---|---|
| 0.27 | 0.27 | 0.2 | 0.46 | 95.0 |
| 0.4 | 0.68 | 102.5 | ||
| 2.53 | 2.54 | 2.0 | 4.55 | 101.0 |
| 4.0 | 6.49 | 99.0 | ||
For an injection sample (labeled content: 0.136 g per 2 mL), quinine content obtained using the proposed method was 0.132 g per 2 mL with RSD (n = 7) of 2.0%, and using the official method23 was 0.133 g per a 2 mL. The results obtained by these two methods were consistent. There was no significant difference between the labeled contents and the results obtained by the proposed method.
Serum and urine samples were treated using the procedure described above, and diluted properly, then analyzed by the standard addition method. The obtained results are given in Table 3. For urine and serum samples the recoveries of the three drugs were in the range of 95.0–105% with RSDs in the range 1.7–2.0%.
Possible CL mechanism
The molecular structures of QN, QD and CCN are shown in Fig. 5. | ||
| Fig. 5 Molecular structure of cinchona alkaloid. | ||
The prime structure of QN, QD and CCN are same, and main distinction is the different substituted radical on the benzene. So they may have a similar fluorescence spectrum.9 In our work, the observed fluorescence emission spectrum of QN, QD and CCN showed a broad peak at 430∼450 nm, which is similar to that reported in the literature.7 The observed CL spectra for QN, QD and CCN each showed similar a broad peak at about 647 nm. In the case of CCN the CL spectrum and fluorescence spectrum are shown in Fig. 6.
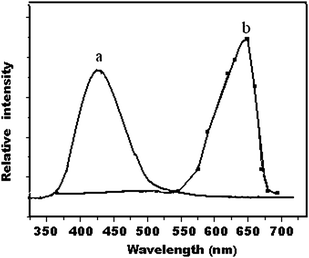 | ||
| Fig. 6 Fluoroference spectrum of (a) cinchonine and (b) CL spectrum of KMnO4–Na2S2O4-cinchona alkaloid. | ||
Adcock et al.24 collected the fluorescence data of quinine and CL spectra of sodium sulfite–potassium permanganate–quinine–sulfuric acid system, the CL spectra matched the characteristic fluorescence of quinine, showing that the CL mechanism of this system involves energy transfer from an excited sulfur dioxide to QN. Our observation showed that the CL spectra did not match the characteristic fluorescence of QN, so that the CL emission mechanism is different to that reported in literature.25 The CL spectra at 643–649 nm observed for different system14–17 coincided with the emission of 1O21O2(1Δg1Δg) (643 nm). It is shown in Fig. 6 that the CL spectra of CCN was observed at about 647 nm for this system, so this suggested that there was singlet oxygen 1O2 (1Δg) in the reaction of potassium permanganate–sodium hyposulfite–cinchona alkaloids system in acidic medium. The presence of sodium hyposulfite could accelerate the generation of 1O2 (1Δg). Two 1O2 (1Δg) formed an illuminant 1O21O2(1Δg1Δg). Therefore, the possible CL reaction scheme of the reaction in its simplest form may be attributed to the following:
| MnO4− + H+ + Na2S2O4 + cinchona alkaloids → |
| 1O2(1Δg) + H2O + Mn(II∼IV) + products |
| 2 1O2(1Δg) → 1O21O2(1Δg1Δg) |
| 1O21O2(1Δg1Δg) → 3O2(3∑g) + hv |
It should be pointed out that although singlet oxygen can emit red light (643 nm),17 the emission at 1270 nm is the characteristic emission of singlet oxygen and is now accepted as the specific emission of singlet oxygen.25 Monitoring the direct emission of singlet oxygen at 1270 nm has become the standard technique for investigation of this excited species.26 Luminescence emitted from singlet oxygen was detected by a PMT detector with high sensitivity in the near-IR region.27 Five band pass filters, 1210 nm, 1240 nm, 1270 nm, 1300 nm, or 1330 nm, were placed sequentially in front of the photodetector to allow sampling of the corresponding range of luminescence spectrum. In our work, the PMT detector on the instrument used (wavelength range: 300–650nm) had not enough high sensitivity in the near-IR region, CL emission of singlet oxygen at about 647 nm was utilized only. Monitoring the direct emission of singlet oxygen at 1270 nm is necessary to further examine the CL mechanism of the reaction system.
Conclusions
A new enhanced CL system (potassium permanganate–cinchona alkaloids–sodium hyposulfite) has been developed, and the CL reaction mechanism described. The work shows that the proposed flow injection-CL method can be successfully used for selective determination of QN, QD and CCN. The analytical performance in the assay of QN, QD and CCN in pharmaceutical preparations, human serum and urine demonstrates that the proposed method may be utilized in routine determination of cinchona alkaloids in clinical applications. The method is simple, fast, and requires only inexpensive instrumentation.Acknowledgements
The authors gratefully acknowledge the support by the Science Foundation Education Office of Hebei Province (B2008000583) and the Science Foundation Education Office of Shandong Province (No.03C52).References
- D. Butler, J. Maurice and C. O'Brien, Nature, 1997, 386, 535–536 CrossRef CAS.
- The World Health Organization (WHO) Report 2002. Reducing risk, promoting healthy life, pp.186–191 Search PubMed.
- F. Nielsen, K. Kramer-Nielsen and K. Brosen, J. Chromatogr., B, 1994, 660, 103–110 CrossRef CAS.
- L. K. Pershing, M. A. Peat and B. S. Finkle, J. Anal. Toxicol., 1982, 6, 153–156 CAS.
- M. Mariaud, P. Dubois and P. Levillain, Analyst, 1988, 113, 929–932 RSC.
- S. Z. Yao, G. L. Shen and G. L. Dai, Chin. Sci. Bull., 1983, 28, 1312–1314.
- F. Yin and X. Xu, Anal. Lett., 2004, 37, 3129–3147 CrossRef CAS.
- D. V. McCalley, J. Chromatogr., A, 2002, 967, 1–19 CrossRef CAS.
- R. Gatti, M. G. Gioia and V. Cavrini, Anal. Chim. Acta, 2004, 512, 85–91 CrossRef CAS.
- H. Masao, O. Mitsuo, I. Fusako, S. Tetsuya, Y. Akiko, O. Shuzo and I. Koichi, J. AOAC Int., 2006, 89, 1042–1047 CAS.
- Z. Gong and Z. Zhang, Fresenius J. Anal. Chem., 1997, 357, 1093–1096 CrossRef CAS.
- O. A. Silvia, R. M. Natividad and M. D. Antonio, Microchim. Acta, 2004, 147, 211–217 CrossRef CAS.
- H. W. Sun, L. Q. Li and X. Y. Chen, Anal. Chim. Acta, 2006, 576, 192–199 CrossRef CAS.
- H. W. Sun and L. Q. Li, J. Anal. Chem., 2008, 63, 485–491 CrossRef CAS.
- Y. H. He, Y. Y. Xue, M. L. Feng and J. R. Lv, Chin. J. Anal. Chem., 1998, 26, 1136–1138 CAS.
- L. Q. Li and H. W. Sun, J. Iran. Chem. Soc., 2008, 5, 140–149 Search PubMed.
- D. Slawinska and J. Slawinski, Anal. Chem., 1975, 47, 2101–2109 CrossRef CAS.
- I. I. Koukli and A. C. Calokerinos, Anal. Chim. Acta, 1990, 236, 463–468 CrossRef CAS.
- M. L. Feng, G. F. Zhang and Z. J. Zhang, Anal. Lett., 1998, 31, 2537–2548 CAS.
- S. Deng, Chin. J. Instr. Anal., 2001, 20(5), 56–58 Search PubMed.
- X. W. Zheng and Z. J. Zhang, Anal. Sci., 2000, 16, 1345–1349 CAS.
- B. X. Li, Z. J. Zhang and M. L. Wu, Talanta, 2000, 51, 515–521 CrossRef CAS.
- China Pharmacopoeia Committee, Chinese Pharmacopoeia (Part II), Beijing, Chemical Industry Press, 2000, 13–14 Search PubMed.
- J. L. Adcock, P. S. Francisa and N. Barnett, Anal. Chim. Acta, 2009, 652, 303–307 CrossRef CAS.
- A. U. Khan and M. Kasha, Proc. Natl. Acad. Sci. U. S. A., 1979, 76, 6047–6049 CAS.
- J. Kanofsky, Methods Enzymol., 2000, 319, 59–67 CAS.
- G. So, A. Karotki, S. Verma, K. Pritzker, B. Wilson and L. Y. Chiang, J. Macromol. Sci., Part A, 2006, 43, 1955–1963 CrossRef CAS.
| This journal is © The Royal Society of Chemistry 2010 |
