Modification of Winkler's method for determination of dissolved oxygen concentration in small sample volumes
Amritanshu
Shriwastav
,
Guttapati
Sudarsan
,
Purnendu
Bose
* and
Vinod
Tare
*
Environmental Engineering and Management Programme, Department of Civil Engineering, Indian Institute of Technology Kanpur, Kanpur, 208016, India. Tel: +91 512 259 7792; E-mail: pbose@iitk.ac.in; vinod@iitk.ac.in; Fax: +91 512 259 7395; Tel: +91 512 259 7403
First published on 27th August 2010
Abstract
Winkler's method is the most popular procedure for determination of dissolved oxygen (DO) concentration in water samples. However, this method requires a relatively large sample volume of 200 mL for accurate DO determination. Many alternative methods have been proposed for measuring DO concentrations in small sample volumes, but most such methods have problems of either, low accuracy, high cost, complicated instrumentation or lengthy analysis times. In this paper, a simple modification to the Winkler's method is proposed for measurement of DO concentrations in samples of 1 mL volume. The proposed method is accurate, low cost, simple and quick. DO concentrations were measured in 33 samples by both the conventional Winkler's method (WM) and the proposed method (PM). For 23 of the 33 samples analyzed, the hypothesis that the population means of the measurements are equal (μ1 = μ2) could not be rejected at 95 percent confidence level and for 19 samples, the hypothesis that the population variances of the measurements are equal (σ21 = σ22)could not be rejected at 95 percent confidence interval. It was thus concluded that in most cases, DO measurements by WM and PM give comparable results both in terms of accuracy and precision.
1. Introduction
Winkler's method (Method No. 4500-O-C)1 has been universally accepted as an accurate and reliable method2 for the measurement of dissolved oxygen (DO) concentration in a variety of water samples. This method is considered to be the benchmark for DO determination. However, the main drawback of this method is the requirement of a large sample volume of 200 mL.3Numerous alternative methods have also been developed for measurement of DO. These methods fall under three distinct categories, (1) colorimetric methods, (2) methods using gas chromatography and (3) methods using electrochemical and optical sensors. The colorimetric methods can be used for determination of DO in small sample volumes. However, they suffer from drawbacks such as requirement of expensive (e.g., gold sol) or toxic (e.g., cyanide) chemical reagents.4 The lack of proper justification in the selection of the measuring wavelength is another limiting factor for such methods.5 DO determination is also possible using gas chromatography. However gas chromatographic methods, though accurate and requiring small samples volumes, are nonetheless time consuming and expensive. Electrochemical sensors have been widely used for DO measurement and their advantages and disadvantages have been reviewed elsewhere.6 Electrochemical sensors generally suffer irreversible pressure effects, contamination by hydrogen sulfide and cross sensitivity.7 They also consume DO during measurement and hence may be unsuitable for very small sample volumes. The recent focus is on the development of optical sensors based on the principle of dynamic oxygen luminescence quenching.8 These optical sensors are easy to use, have quick response time and are durable. However, all sensors, whether electrochemical or optical, require calibration against the Winkler's method due to sensitivity of the sensors to temperature and pressure.9,10 They are also sensitive to bio-fouling and bacterial growth on the sensor surface.8
Due to the inherent limitations of alternative methods as described above and their dependency on Winkler's method for cross-checking and calibration, several modifications to the Winkler's method itself have also been proposed for measurement of DO concentrations in sample volumes of 1–10 mL.11,12,13 However, such ‘Micro-Winkler’ methods are not very popular due to the complex instrumental requirements and elaborate precautions required for avoiding the contamination of the samples through exchanges with atmospheric oxygen. These methods have been critically reviewed elsewhere.14 A gravimetric Micro-Winkler titration method has recently been proposed15 for DO measurement in small samples. However, this procedure requires multiple and accurate gravimetric measurements using a sensitive balance and hence appears to be quite complex.
Based on the literature review, it appears that almost all the methods developed for DO measurements in small samples are deficient in some way or the other. Hence there is an ongoing need for development of a better, i.e., accurate, precise, low cost, simple and quick method for DO measurement in small sample volumes.
2. Outline of the proposed method
The primary challenge in measuring DO concentrations in small samples is the prevention of contamination of the samples through interaction with the atmosphere. It is proposed that an insulating liquid layer be introduced between the water sample and the atmosphere. Required properties of the insulating liquid are; water immiscibility, density less than water, and negligible oxygen dissolution capacity. It is proposed that the insulating liquid be taken in a vial and the water sample whose DO is to be determined (1 mL volume) be directly introduced below the insulating liquid layer. The water sample is effectively sealed from the atmosphere through this step. The DO in the water sample may then be fixed and converted to equivalent amount of iodine using the same reagents as used in the Winkler's method. The iodine solution is then extracted from the vial using a syringe and titrated using Na2S2O3 for determination of the DO concentration in the sample.After several rounds of trials, n-hexane was chosen as the insulating liquid as described above. n-Hexane is lighter than water (specific gravity = 0.7) and is virtually immiscible in water. Oxygen solubility in n-hexane is 0.002 mole fraction,16i.e., oxygen is practically insoluble in n-hexane.
3. Material and methods
All reagents used were of analytical reagent grade (>99% purity, Loba Chemicals, India). De-ionized water (Milli-Q, Millipore, USA) was used for preparation of reagents and dilution of samples. The n-hexane used was of HPLC grade (>99% purity, Merck, India). Borosilicate glassware was used in this study. MnSO4 and alkali-azide-iodide solutions were prepared as per standard methods (Method No. 4500-O C).1The DO measurement procedure by the proposed method (PM) was as follows. Initially, 0.5 mL n-hexane was transferred to a 16 mL glass vial (Wheaton Science, USA). Then, 1 mL of n-hexane was taken in a 2 mL pipette, and the pipette was further filled with 1 mL of the water sample whose DO concentration was to be determined. The above sample collection procedure ensured that the sample was collected without a headspace. This sample collection step is the most crucial, since the appearance of any bubbles or air gap in the hexane–water interface or elsewhere in the pipette may lead to errors. The mouth of the pipette was then placed below the hexane layer in the vial and thus the sample was introduced below the hexane layer, avoiding any contact between the sample and the atmosphere. The sample collection in the pipette and application of the sample below the hexane layer in the vial must be done as quickly as possible so as to minimize errors. Next, 5 μL MnSO4 was introduced into the water sample below hexane layer using a 10 μL micro syringe (Hamilton, USA), followed by a similar addition of 5 μL alkali-azide-iodide solution. Precipitate formation commenced immediately after the additions and was complete within 3 min. Afterwards, 0.1 mL of conc. H2SO4 was added using a micro-pipette to the precipitate formed below hexane layer. The precipitate was dissolved within 3 min and yellow iodine solution was formed below the hexane layer. Exactly 1 mL of the iodine solution was extracted from below the hexane layer using micro syringe and transferred to a 25 mL beaker. The 1 mL iodine solution in the beaker was diluted to ∼10 mL by adding de-ionized water for ease of titration. The addition of de-ionized water merely dilutes the iodine solution, without affecting the quantity of iodine in the beaker. The contents of the beaker were titrated with 0.00625 M Na2S2O3 solution. 1 mL of this titrant corresponds to 55.5 mg L−1 of DO in the original sample. The titrant was taken in a 250 μL micro syringe (Hamilton, USA) and added drop-wise to the beaker with constant stirring until the yellow color of iodine was nearly discharged. Then, 1–2 drops of starch solution was added and titration continued until the blue color due to starch was discharged. Based on the volume of titrant required in a particular titration, the DO concentration in the original sample was calculated.
DO concentration was also determined in various samples using the Winkler's method (WM). Reagent requirements and other details of both methods are presented in Table 1.
| Sample No. | Reagent | Quantity | Strength | ||
|---|---|---|---|---|---|
| WM | PM | WM | PM | ||
| 1. | Sample | 200 mL | 1 mL | — | — |
| 2. | MnSO4 | 1 mL | 5 μL | As per WM | |
| 3. | Alkali-azide-iodide reagent | 1 mL | 5 μL | As per WM | |
| 4. | Na2S2O3 | As required | As required | 0.025M | 0.00625M |
| 5. | H2SO4 | 1 mL | 0.1 mL | As per WM | |
| 6. | Starch | 1–2 drops | 1–2 drops | As per WM | |
| 7. | n-Hexane | Not used | 1.5 mL | — | — |
4. Results and discussion
DO concentration was measured in 33 water samples (see Table 2) obtained from various places in and around the city of Kanpur, India. Of the 33 samples, 8 were tap water samples, 16 were river water samples, 6 were domestic wastewater samples diluted with tap water, 2 were ground water samples and 1 was a pond water sample. The samples were chosen such that DO concentrations could be measured in a wide variety of sample matrices. For each sample, several replicate DO measurements were made, by both WM and the PM. The calculated sample means ( ), sample standard deviations (S1, S2) and number of replicate measurements (n1, n2) for WM and PM respectively are presented in Table 2 for each sample.
| Sample no. | Type of sample | DO by Winkler's method (mg L−1) | DO by proposed method (mg L−1) | ||||
|---|---|---|---|---|---|---|---|
| Number of replicates | Sample mean | Sample standard deviation | Number of replicates | Sample mean | Sample Standard Deviation | ||
| (n1) |
|
(S1) | (n2) |
|
(S2) | ||
| Note. TW: Tap Water; DWW: Domestic Wastewater; GW: Groundwater; PW: Pond Water; RW: River Water. | |||||||
| 1 | TW #1 | 20 | 2.13 | 0.26 | 20 | 2.14 | 0.42 |
| 2 | TW #2 | 20 | 1.03 | 0.14 | 20 | 1.27 | 0.29 |
| 3 | TW #3 | 20 | 1.74 | 0.21 | 20 | 1.95 | 0.39 |
| 4 | TW #4 | 5 | 4.74 | 0.19 | 9 | 4.34 | 1.19 |
| 5 | TW #5 | 10 | 1.53 | 0.09 | 10 | 1.54 | 0.30 |
| 6 | TW #6 | 10 | 4.25 | 0.33 | 10 | 4.37 | 0.38 |
| 7 | TW #7 | 10 | 1.99 | 0.20 | 10 | 2.34 | 0.35 |
| 8 | TW #8 | 9 | 8.70 | 0.29 | 9 | 9.29 | 0.43 |
| 9 | Diluted DWW #1 | 9 | 3.12 | 0.44 | 10 | 3.44 | 0.32 |
| 10 | Diluted DWW #2 | 10 | 3.36 | 0.27 | 10 | 3.49 | 0.19 |
| 11 | Diluted DWW #3 | 10 | 3.08 | 0.52 | 10 | 3.19 | 0.57 |
| 12 | Diluted DWW #4 | 10 | 3.46 | 0.67 | 10 | 3.52 | 0.34 |
| 13 | Diluted DWW #5 | 10 | 4.56 | 0.36 | 10 | 4.48 | 0.82 |
| 14 | Diluted DWW #6 | 10 | 4.02 | 0.35 | 10 | 3.96 | 0.64 |
| 15 | GW#1 | 10 | 5.33 | 0.15 | 10 | 5.91 | 0.30 |
| 16 | GW#2 | 10 | 4.04 | 0.38 | 10 | 4.73 | 0.61 |
| 17 | PW | 10 | 3.98 | 0.54 | 10 | 4.48 | 0.43 |
| 18 | RW #1 | 10 | 3.07 | 0.11 | 10 | 3.3 | 0.37 |
| 19 | RW #2 | 10 | 4.88 | 0.54 | 10 | 5.01 | 0.34 |
| 20 | RW #3 | 10 | 6.01 | 0.28 | 10 | 6.49 | 0.45 |
| 21 | RW #4 | 10 | 5.47 | 0.66 | 10 | 5.67 | 0.81 |
| 22 | RW #5 | 9 | 5.90 | 0.35 | 10 | 5.91 | 0.63 |
| 23 | RW #6 | 10 | 3.94 | 0.30 | 10 | 4.13 | 0.37 |
| 24 | RW #7 | 10 | 4.56 | 0.48 | 10 | 4.54 | 0.61 |
| 25 | RW #8 | 10 | 6.29 | 0.27 | 10 | 6.61 | 0.62 |
| 26 | RW #9 | 10 | 4.76 | 0.93 | 10 | 4.95 | 0.34 |
| 27 | RW #10 | 10 | 4.22 | 0.28 | 10 | 4.40 | 0.29 |
| 28 | RW #11 | 10 | 4.42 | 0.73 | 10 | 4.95 | 0.34 |
| 29 | RW #12 | 10 | 5.17 | 0.50 | 10 | 5.51 | 0.91 |
| 30 | RW #13 | 10 | 5.95 | 0.59 | 10 | 6.00 | 0.80 |
| 31 | RW #14 | 10 | 5.93 | 0.26 | 10 | 6.22 | 0.43 |
| 32 | RW #15 | 10 | 5.01 | 0.24 | 10 | 5.50 | 0.37 |
| 33 | RW #16 | 10 | 4.46 | 0.69 | 10 | 4.92 | 0.30 |
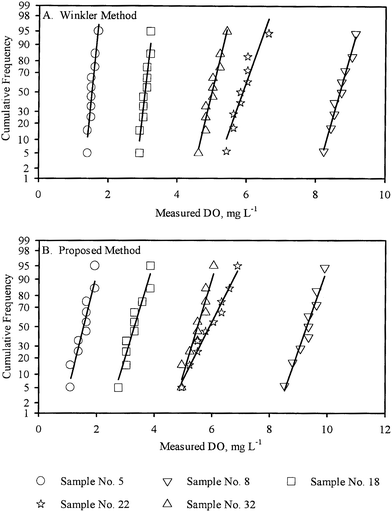
Normal plots of the sets of replicate measurements by both methods were all approximately linear, indicating that the replicate measurements were normally distributed and hence were amenable to further statistical analysis on that basis. For illustrative purposes, the normal plots for five sample measurements performed by the WM are presented in Fig. 1A. The normal plots for the same five samples measurements performed by the PM are presented in Fig. 1B.
 | ||
| Fig. 1 Normal plots of the replicate DO measurement for five samples (A) by WM, (B) by PM. | ||
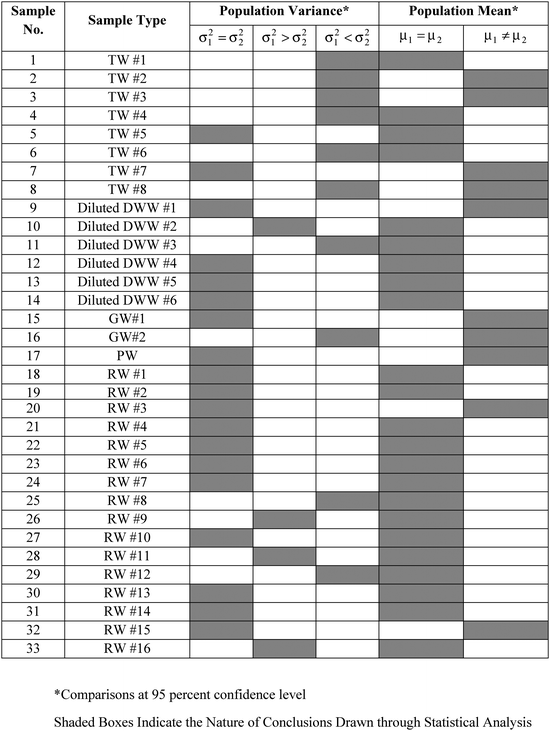
The variances (S21,S22) in the replicate measurements of a sample by WM and PM respectively were used for pair-wise comparison of the corresponding population variances (σ21,σ22) using the F-test. Of the 33 samples for which DO was measured by the two methods (WM and PM), the hypothesis that the population variances were equal (σ21 = σ22) could not be rejected at 95 percent confidence level for 19 samples. Further, the hypothesis, σ21 > σ22 could not be rejected for 4 samples, while the hypothesis, σ21 < σ22 could not be rejected for the remaining 10 samples, all at 95 percent confidence level. These results have been summarized in Table 3.

|
Further, sample variances (S21,S22) and sample means ( ) for each sample, as obtained by WM and PM respectively were used for pair-wise comparison of the corresponding population means (μ1, μ2). For samples with equal variances (see Table 3), the pair-wise comparison was done using the Student's t-test. For samples with unequal variances (see Table 3), the pair-wise comparison was done using the unequal variance t-test.17 In 23 of the 33 samples where DO measurements was done both by WM and PM, the hypothesis that the population means were equal (μ1 = μ2) could not be rejected at 95 percent confidence level.
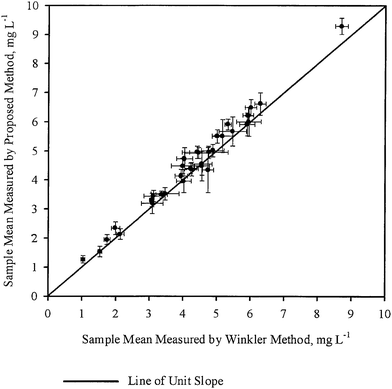
The sample means ( ) for each sample, as obtained by WM and PM respectively were plotted against each other in Fig. 2. The error bars shown in the figure correspond to corresponding 95 percent confidence intervals. A line of unit slope passing through the origin was also drawn in the same figure. All the points were observed to lie very close to the line of unit slope, which is in agreement with the general conclusions drawn in Table 3, i.e., for most samples, mean DO concentration obtained by the two methods are not statistically different. Thus in most cases, DO measurement by PM was as accurate as the DO measurement by WM.
 | ||
| Fig. 2 Comparison of the mean DO measured by WM and PM for various samples. The error bars represent 95 percent confidence intervals. | ||
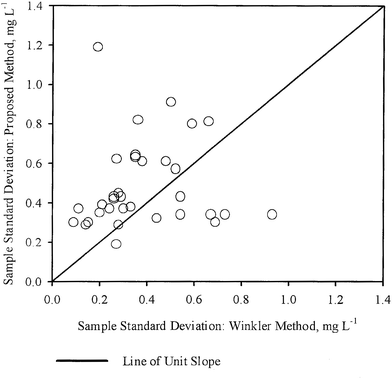
The sample standard deviations (S1,S2) for each sample, as obtained by WM and PM respectively were plotted against each other in Fig. 3. A line of unit slope passing through the origin was also drawn in the same figure. In this case, the points appear to be dispersed fairly uniformly with respect to the line of unit slope, with some points being close to the line, while the others are further away. These observations are also in general agreement with the conclusions drawn from Table 3, i.e., for most samples, variation in DO concentration measured by the two methods are not statistically different. Thus in most cases, DO measurement by PM was as precise as the DO measurement by WM.
 | ||
| Fig. 3 Comparison of the sample standard deviations about the mean for DO measurements by WM and PM. | ||
It was concluded that with careful sample handling and titration, the proposed method (PM) can produce results comparable to Winkler's method (WM) both in terms of accuracy and precision. Nonetheless, the accuracy of DO determination by PM may probably be increased by using a micro-syringe with a lower least count for the final titration. The micro syringe used in this study had a least count of 5 μL, which corresponds to an uncertainty of ∼0.25 mg L−1 DO under the conditions of the present study. This uncertainty can be lowered by using a micro syringe with lower least count.
Conclusions
The objective of this study was to develop an accurate, low cost, simple and quick method for measurement of DO in small sample volumes. Based on the results and analysis presented, it may be concluded that the proposed method addresses most of the above issues. Main conclusions of the study were the following:➢ Introduction of an insulating layer of n-hexane for prevention of oxygen transfer between the aqueous sample and the atmosphere results in consistent and accurate determination of DO in small sample volumes. This is the main innovation incorporated in the proposed method.
➢ It was also demonstrated that by taking adequate precautions, the proposed method (PM) can generally produce results that are statistically comparable with results obtained by Winkler's method (WM), both with regard to the mean DO concentration and also with regard to the variance in DO concentration about the mean.
➢ The reagent and glassware requirements for the proposed method are less than that of Winkler's method, primarily due to the smaller sample volume used. n-Hexane is the only additional reagent used but the small amount (∼1.5 mL per sample) of n-hexane required has negligible impact on the overall cost of sample analysis.
Hence the proposed method (PM) may be used for DO measurements under all circumstances where Winkler's method is presently used. The proposed method is particularly useful under the circumstances where the Winkler's method cannot be used due to limitations on available sample volume.
References
- A. D. Eaton, L. S. Clesceri, A. E. Greenberg (ed.), Standard Methods for the Examination of Water and Wastewater, twentieth ed., APHA, AWWA and WEF, American Public Health Association, Washington, D.C., 1998, pp. 4-131–4 133 Search PubMed.
- D. E. Carritt and J. H. Carpenter, J. Mar. Res., 1966, 24, 286–318 CAS.
- T. Pal and P. K. Das, Analyst, 1988, 113, 1601–1603 RSC.
- T. Pal, N. R. Jana and P. K. Das, Analyst, 1991, 116, 321–322 RSC.
- T. Labasque, C. Chaumery, A. Aminot and G. Kergoat, Mar. Chem., 2004, 88, 53–60 CrossRef CAS.
- R. N. Glud, J. K. Gundersen, N. B. Ramsing, in In situ monitoring of aquatic systems: Chemical analysis and speciation, J. Buffle and G. Horvai (ed.), John Wiley & Sons Ltd., 2000, Ch 2, 19–73 Search PubMed.
- M. Berntsson, A. Tengberg, P. O. J. Hall and M. Josejson, Anal. Chim. Acta, 1997, 355, 43–53 CrossRef CAS.
- A. Tengberg, J. Hovdenes, J. H. Andersson, O. Brocande, R. Diaz, D. Herbert, T. Arnerich, C. Huber, A. Kortzinger, A. Khripounoff, F. Rey, C. Ronning, S. Sommer and A. Stangelmayer, Limnol. Oceanogr. Methods, 2006, 4, 7–17 Search PubMed.
- D. J. Hydes, M. C. Hartman, J. Kaiser and J. M. Campbell, Estuarine, Coastal Shelf Sci., 2009, 83, 485–490 CrossRef CAS.
- C. D. Markfort and M. Hondzo, J. Environ. Qual., 2009, 38, 1766–1774 CrossRef CAS.
- A. Krogh, Ind. Eng. Chem., Anal. Ed., 1935, 7, 130–131 CrossRef CAS.
- A. Krogh, Ind. Eng. Chem., Anal. Ed., 1935, 7, 131–133 CrossRef CAS.
- R. J. Whitney, J. Exp. Biol., 1938, 15, 564–570 Search PubMed.
- L. Jalukse, I. Helm, O. Saks and I. Leito, Accredit. Qual. Assur., 2008, 13, 575–579 CrossRef CAS.
- I. Helm, L. Jalukse, M. Vilbaste and I. Leito, Anal. Chim. Acta, 2009, 648, 167–173 CrossRef CAS.
- A. M. A. Dias, R. P. Bonifacio, I. M. Marrucho, A. A. H. Padua and M. F. C. Gomes, Phys. Chem. Chem. Phys., 2003, 5, 543–549 RSC.
- B. K. Moser and G. R. Stevens, Am. Stat., 1992, 46, 19–21 CrossRef.
| This journal is © The Royal Society of Chemistry 2010 |


