In situ bismuth film modified screen printed electrodes for the bio-monitoring of cadmium in oral (saliva) fluid
Mohamed
Khairy
,
Rashid O.
Kadara
,
Dimitrios K.
Kampouris
and
Craig E.
Banks
*
Faculty of Science and Engineering, School of Biology, Chemistry and Health Science, Division of Chemistry and Materials, Manchester Metropolitan University, Chester Street, Manchester, M1 5GD, Lancs, UK. E-mail: c.banks@mmu.ac.uk; Fax: +(0)1612476831; Tel: +(0)1612471196
First published on 15th April 2010
Abstract
We demonstrate that in situ bismuth film modified screen printed electrodes may be used for the bio-monitoring of cadmium(II) in artificial and diluted human oral (saliva) fluid at the low µg L−1 range. The analytical protocol is based on anodic stripping voltammetry where the bismuth film provides enhanced sensitivity for the electroanalytical deposition of cadmium(II) coupled with a simple change in pH of the oral (saliva) fluid sample permitting quantitative measurements in an electrochemically challenging media.
Introduction
The bio-monitoring of heavy metals in biological fluids allows the exposure from anthropogenic sources to be readily assessed.1–5 The use of oral (saliva) fluid is extremely appealing as a sample media for bio-monitoring as one of its benefits is the ease of collection. In terms of the bio-monitoring of heavy metals it has been reported that the urinary excretion level of lead is not a true reflection of lead blood levels but rather exposed workers have extremely high levels of lead in sweat and saliva even though their lead blood levels are moderately elevated.6 This adds impetus for the preference of using oral (saliva) fluid as a bio-monitoring matrix.Traditional analytical techniques such as Atomic Absorption Spectroscopy (AAS), Inductively Coupled Plasma Mass Spectrometry (ICP-MS) etc. can be employed for the bio-monitoring of heavy metals but have expensive running costs with the samples requiring extensive sample digestion/pre-treatments. Electroanalysis is a methodology which is extremely useful for the portable, sensitive and selective determination of heavy metals. For example, electro-analysis can offer high throughput screening of heavy metals in river water samples at trace levels.7 However, in the present context oral (saliva) fluid is an electrochemically challenging media which results in passivation/electrode fouling of the electrode surface greatly reducing the analytical signal and limiting the accessible analytical detection ranges.8 The traditional approach is to employ the use of mercury film modified electrodes where the mercury provides extra sensitivity towards the target metal analyte compared with the underlying carbon surface with the addition of a polymeric coating such as Nafion® offering resistance to surface passivation. State-of-the-art has been reported by West et al.9 who have shown in the case of the electro-analytical sensing of lead in artificial and real saliva using Nafion ® coated mercury thin film glassy carbon electrodes that a depression in the electro-analytical signal is observed by surface-active glycoproteins.9,10 To circumvent this, power ultrasound8 was applied which allowed voltammetric useful measurements in the otherwise passivating media8,11–13 where acoustic streaming and cavitational activity9–13 removed glycoproteins and other active materials from the electrode surface. This work was extended by exploring a membrane free in situ mercury film10 and was validated in both artificial oral (saliva) fluid and real (diluted) human oral (saliva) fluid for lead and cadmium.
Electro-analysts are always in the pursuit of improved electrode substrates to improve sensitivities, linear ranges and detection limits. One established method to improve electroanalytical performance is to modify an electrode substrate with bismuth metal which can act similarly to a mercury modified electrode but has negligible toxicity.14–16 A whole range of target analytes can be beneficially detected compared to non-bismuth modified electrodes17 such as the detection of tellurium(IV),18 aminosalicylate drugs,19 antimony,20 lead and cadmium in soil,21 and lead in wine.22
Interestingly, in the case of bio-monitoring, Kruusma et al.23 were the first to show that bismuth modified electrodes could be successfully used for the electro-analytical determination of heavy metals in human blood. The electro-analytical detection of lead using anodic stripping voltammetry was shown to be possible where the application of the bismuth film imparted extra sensitivity to allow analytical useful measurements in an otherwise passivating media.23 This was followed up with the sensing of chromium24 and the simultaneously detection of lead, cadmium and zinc.25,26 In terms of bio-monitoring in oral (saliva) fluid using bismuth film, or other variants, to our knowledge, there is one report by Smyth et al. who reported on the electro-analysis of cobalt and nickel in simulated saliva.27 Given the inherent benefits of bismuth modified electrodes we find it surprising that this has not yet been utilised for bio-monitoring in oral (saliva) fluid.
Consequently we report the first ever example of using bismuth film modified screen printed electrodes for the bio-monitoring of cadmium(II) in artificial and human oral (saliva) fluid. The electro-analytical sensing of cadmium(II) is shown to be possible over the low µg L−1 range in both artificial and human oral (saliva) fluid.
Experimental section
All chemicals used were of analytical grade and were used as received without any further purification and were obtained from Sigma-Aldrich. All solutions were prepared with deionised water of resistivity not less than 18.2 MΩ cm−1.Voltammetric measurements were carried out using a µ-Autolab III (ECO-Chemie, The Netherlands) potentiostat. All measurements were conducted using a screen-printed electrode configuration. During the development of the protocol, the 3 mm graphite working electrode of the screen printed electrode was used with a platinum counter electrode and SCE as reference electrode. Screen printed electrodes were fabricated as reported previously.28 Connectors for the efficient connection of the screen printed electrochemical sensors were purchased from Kanichi Research Services Ltd (UK).29 Square-wave voltammetry was employed throughout utilising a step potential of 5 mV, amplitude of 25 mV and frequency of 50 Hz. The artificial saliva was prepared as described previously.9,30,31 The components of artificial saliva are detailed in Table 1. Note that the pH of authentic saliva is known to be 6.8 after emission from the canals9 and was therefore adjusted with tiny amounts of concentrated hydrochloric acid or sodium hydroxide to correspond to this pH.
| Chemical name | Concentration/g L−1 |
|---|---|
| Ammonium chloride | 0.34 |
| Bovine submaxillary gland mucin | 0.02 |
| Potassium chloride | 0.21 |
| Sodium citrate | 0.31 |
| Potassium phosphate | 0.66 |
| Urea | 0.18 |
| Uric acid sodium salt | 0.02 |
| Sodium chloride | 1.60 |
| Lactic acid sodium salt | 0.15 |
| Magnesium chloride | 0.003 |
| Potassium thiocyanate | 0.075 |
| Sodium carbonate | 0.028 |
| Calcium chloride | 0.022 |
| Lysozyme | 0.3 |
Results and discussion
We first turn to exploring the effect of solution pH upon an in situ formed bismuth film modified screen printed electrode using a concentration of 30 µg L−1 cadmium(II) and 1 mg L−1 of bismuth(III). As is evident in Fig. 1, the magnitude of the cadmium stripping increases dramatically from pH 1 up to pH 3 beyond which the magnitude of the stripping peak reduces as the pH is changed from pH 4 to pH 6. The voltammetric window clearly increases as the pH is changed from low values (pH 1) to high values (pH 3 and higher) as evidenced by the reduction in the non-faradaic current at potentials of −1.0 V and higher. As the voltammetric window increases the magnitude of the stripping peak increases to a maxima at pH 3, beyond this pH the magnitude of the stripping peak decreases which is likely due to bismuth(III) hydrolysis;32 clearly an optimum performance is observed at pH 3. | ||
| Fig. 1 The effect of solution pH on the voltammetric profiles from 30 µg L−1 cadmium(II) and 1 mg L−1 bismuth(III) using a screen printed electrochemical platform. Experimental conditions: deposition potential of −1.2 V (vs. SCE) and a deposition time of 200 seconds. pH 6 is the dotted line, pH 5 is the dashed line. | ||
Next, attention was turned to exploring the optimum bismuth(III) concentration. Using a fixed concentration of 30 µg L−1 cadmium(II) in pH 3 buffer solution and a deposition potential and time of −1.2 V and 200 seconds, the magnitude of the cadmium(II) stripping peak was monitored as a function of added bismuth(III) concentration. It was observed that the magnitude of the cadmium(II) stripping peak (peak height) increased as the concentration of bismuth(III) was increased up to 0.4 mg L−1. Beyond this concentration the magnitude of the stripping peak was found to plateau and beyond concentrations of 1.2 mg L−1 the stripping peak was found to start decreasing which is likely due to instability resulting from bismuth nucleating upon itself at these high concentrations. Using a fixed concentration of 0.4 mg L−1 bismuth(III) in a pH 3 buffer solution the magnitude of the cadmium(II) stripping peak was monitored as a function of applied deposition potential. The magnitude of the cadmium stripping peak was found to increase as the potential is increased up to −1.2 V beyond which the magnitude of the stripping peak plateaus. Using the electro-analytical parameters derived above, it is possible to easily observe 4 µg L−1 cadmium(II) in a pH 3 buffer solution using the in situ bismuth film modified screen printed electrochemical platform; the observed voltammetric profile is depicted in Fig. 2, where a large quantifiable peak is clearly evident.
 | ||
| Fig. 2 Square wave anodic stripping voltammetric profile of 4 µg L−1 cadmium(II) in a pH 3 buffer solution containing 0.4 mg L−1 bismuth(III) using a deposition potential of −1.2 V and deposition time of 200 seconds. The dotted line is the response in the absence of cadmium(II). | ||
We turn to exploring the analytical protocol in the presence of artificial oral (saliva) fluid. The formulation of the artificial oral (saliva) fluid is described in the experimental section. Using the electro-analytical parameters used in Fig. 2, additions of cadmium(II) were made into artificial oral (saliva) fluid. However, the voltammetric performance of the bismuth film modified screen printed electrode towards the detection of cadmium(II) was found to be extremely poor with small voltammetric peak heights with intra- and inter-measurements being un-reproducible. Interesting, using bismuth oxide screen printed electrodes as reported previously,33 we found that the response was also detrimentally affected with the voltammetric response being effectively masked from immersion into the artificial oral (saliva) fluid sample. Both these observations indicate that the components of artificial oral (fluid) saliva, particularly the glycoproteins (bovine submaxillary gland mucin) adsorb onto the bismuth surface precluding its electrochemical activity. Note that a similar observation has been reported by Compton et al. using mercury modified electrodes.9,10 In the case of the bismuth oxide screen printed electrodes, the bismuth electrode consists of bismuth oxide microparticles randomly decorated over the carbon surface and as the proteins absorb preferentially onto these bismuth domain sites, their electrochemical activity is precluded resulting in no observable voltammetry using the bismuth oxide screen printed sensor. However, in the case of the in situ bismuth film modified screen printed electrode, the surface is effectively a bismuth macroelectrode and as the proteins absorb onto the bismuth macrosurface, there remains sufficient electroactive sites (bismuth film) left to facilitate electrochemical activity. However, this electrochemical activity is not ideal with the performance of the bismuth film modified electrode being quite variable. Various efforts to dilute the artificial oral (saliva) fluid were attempted but were unsuccessful in obtaining reproducible analytical measurements. We found that the only possible way to detect low µg L−1 levels of cadmium(II) was to modify the pH of the artificial oral (saliva) fluid to pH 1. Using cyclic voltammetry we found that in the artificial oral (saliva) fluid the electrochemical reduction of bismuth ions to bismuth metal was increased to higher negative potentials with the corresponding stripping peak shifted more anodic but with little loss in its magnitude in contrast to that observed in pH 7. We believe that the conformation of the components of the oral (saliva) fluid sample is beneficially altered at this low pH for the electro-analysis to proceed.
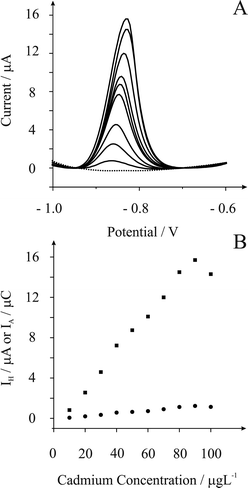
As we discovered in Fig. 1, the magnitude of the cadmium stripping peak at pH 1 is reduced compared to that at pH 3 and consequently we re-visit the electro-analytical performance of the in situ bismuth modified screen printed electrochemical platform in pH 1. Fig. 3A depicts the observed voltammetric profiles where analysis of the peak height from additions of cadmium(II) is linear over the range 10 to 80 µg L−1(IH/A = 1.9 × 10⁻⁷ A/µg L−1 − 9.5 × 10⁻⁷ A; R2 = 0.997; N = 8), further additions results in a decrease in the voltammetric response which is likely due to the bismuth nucleation sites becoming saturated. Fig. 3B compares the analysis of the voltammetric curves shown in Fig. 3A in terms of peak height (IH) and peak area (IC) where the same trend is observed but peak height gives an improved analytical response and consequently we use this herein. Based on the observed linear range (see Fig. 3B) a limit detection (based on three sigma) was found to correspond to 2.9 µg L−1.
 | ||
| Fig. 3 Part A depicts typical square wave voltammetric profiles for additions of cadmium(II) to 0.1 M HCl (pH 1.1) using a deposition potential of −1.2 V (vs. SCE) and a deposition time of 200 seconds. Part B is the analysis of the peak height, IH (squares) and peak area, IC (circles) resulting from additions of cadmium(II). | ||
Next we turn to exploring the response towards the sensing of cadmium(II) in artificial oral (saliva) fluid. Fig. 4A depicts typical square wave voltammetric profiles resulting from the additions of cadmium(II) into an oral (saliva) fluid sample with the only treatment being the pH of the sample changed to pH 1. Analysis of the peak height (IH) versus cadmium(II) concentration is depicted in Fig. 4B, where a linear response is observed from 20 to 90 µg L−1 (IH/A = 5.4 × 10⁻⁸ A/µg L−1 − 9.6 × 10⁻⁷ A; R2 = 0.998; N = 8). Based on this linear response a limit of detection (based on three sigma) was found to correspond to 4.3 (± 0.5) µg L−1.
 | ||
| Fig. 4 Typical square wave anodic stripping voltammetric profiles (A) obtained from addition of cadmium(II) to artificial oral (saliva) fluid. Part (B) depicts the analysis of the peak height from cadmium(II) additions. Parameters: deposition potential of −1.2 V, deposition time of 200 seconds. The pH of the artificial saliva was modified to pH 1 by the addition of concentrated hydrochloric acid. | ||
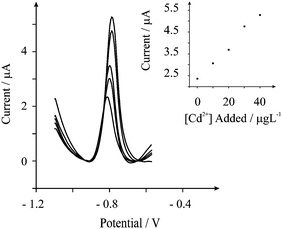
Direction was then changed to exploring the measurement of cadmium(II) in real oral (saliva) fluid. Fig. 5A depicts typical square wave voltammetric profiles resulting from the additions of cadmium(II) into an oral (saliva) fluid sample which has been diluted by a factor of 100 and the pH of the sample changed to pH 1. Analysis of the peak height (IH) versus cadmium(II) concentration is depicted in Fig. 5B, where a linear response is observed from 10 to 50 µgL−1 (IH/A = 1.0 × 10⁻⁷ A/µg L−1 − 6.0 × 10⁻⁷ A; R2 = 0.998; N = 5). Based on this linear response a limit of detection (based on three sigma) was found to correspond to 2.3 (± 0.5) µg L−1. Note the difference in sensitivity between the artificial and real oral (saliva) fluid is due to the latter (shown in Fig. 5) being diluted by a factor of 100. The inter-reproducibility of the sensor evaluated from five separate measurements using new screen printed electrodes was found to produce a % Relative Standard Deviation of 4.5%
 | ||
| Fig. 5 Typical square wave anodic stripping voltammetric profiles (A) obtained from addition of cadmium(II) to oral (saliva) fluid. Part (B) depicts the analysis of the peak height from cadmium(II) additions. Parameters: deposition potential of −1.2 V (vs. SCE), deposition time of 200 seconds. | ||
We note that West et al. and Hardcastle et al.9,10 have compared artificial oral (saliva) fluid and real diluted human oral (saliva) fluid spiked with lead and cadmium with that of authentic oral (saliva) fluid from smokers which was validated with ICP-MS indicating that recovery experiments into artificial and real human oral (saliva) fluid is an appropriate media and validatory approach. Consequently a recovery experiment was performed on the real human oral (saliva) fluid sample. The sample was spiked with 30 µg L−1 of cadmium(II) with a standard addition protocol performed in triplicate. Fig. 6 depicts the voltammetric profiles typically observed. Note that the only pre-treatment that was applied was dilution by a factor of 100 and modifying the sample to pH 1. Based on this recovery experiment, it was found that a recovery of 94 (± 1) % was possible.
 | ||
| Fig. 6 Typical square wave anodic stripping voltammetric profiles resulting from a recovery experiment of cadmium(II) in real (dilute) human oral (saliva) fluid. Parameters: deposition potential of −1.2 V (vs. SCE), deposition time of 200 seconds. | ||
The concentration range of cadmium in oral (saliva) fluid largely depends on its intended application. For example, in monitoring environmental pollutants in Mexico city, an average concentration of 0.25 µg L−1 for cadmium(II) has been reported which are considered to be higher than reported elsewhere34 while the concentrations of cadmium in the saliva of non-smoking subjects has been reported to be in the range 8000–10![[thin space (1/6-em)]](https://www.rsc.org/images/entities/char_2009.gif) 000 µg L−1 with smokers having a mean salivary cadmium concentration of 39650 ± 11530 µgL−1 (mean ppb ± SD).35 Clearly our analytical protocol has potential for the bio-monitoring of cadmium in authentic oral (saliva) fluid.
000 µg L−1 with smokers having a mean salivary cadmium concentration of 39650 ± 11530 µgL−1 (mean ppb ± SD).35 Clearly our analytical protocol has potential for the bio-monitoring of cadmium in authentic oral (saliva) fluid.
Conclusions
We have presented an electrochemical methodology for the bio-monitoring of cadmium(II) in artificial and diluted human oral (saliva) fluid at the low µg L−1 range using in situ bismuth film modified screen printed electrodes. The analytical protocol is based on anodic stripping voltammetry where the bismuth film provides enhanced sensitivity through improved nucleation sites for the electroanalytical deposition of cadmium(II) coupled with a simple change in pH of the sample allowing electrochemical measurements in a notoriously electrochemically challenging media. The methodology is cost effective as it is based on economical and disposable screen printed electrodes and hold potential in the bio-monitoring of heavy metals.References
- J. M. Christensen, Sci. Total Environ., 1995, 166, 89 CrossRef CAS.
- M. Wilhelm, D. Hafner, I. Lombeck and F. K. Ohnesorge, Sci. Total Environ., 1991, 103, 199 CrossRef CAS.
- W. McKelvey, R. C. Gwynn, N. Jeffery, D. Kass, L. E. Thorpe, R. K. Garg, C. D. Palmer and P. J. Parsons, Environ. Health. Pres., 2007, 115, 1435 Search PubMed.
- C. Timchalk, T. S. Poet, A. A. Kousba, J. A. Campbell and Y. H. Lin, J. Toxicol. Environ. Health, Part A, 2004, 67, 635 Search PubMed.
- M. Esteban and A. Castano, Environ. Int., 2009, 35, 438 CrossRef CAS.
- M. Luconi, M. F. Saliva, R. A. Olsina and L. Fernandez, Talanta, 2001, 54, 45 CrossRef CAS.
- K. Z. Brainina, I. V. Kubysheva, E. G. Miroshnikova, S. I. Parshakov, Y. G. Maksimov and A. E. Volkonsky, Field Anal. Chem. Technol., 2001, 5, 260 CrossRef CAS.
- C. E. Banks and R. G. Compton, Analyst, 2004, 129, 678 RSC.
- C. E. West, J. L. Hardcastle and R. G. Compton, Electroanalysis, 2002, 14, 1470 CrossRef CAS.
- J. L. Hardcastle, C. E. West and R. G. Compton, Analyst, 2002, 127, 1495 RSC.
- C. E. Banks and R. G. Compton, Chem. Anal., 2003, 48, 159 CAS.
- C. E. Banks and R. G. Compton, Electroanalysis, 2003, 15, 329 CrossRef CAS.
- C. E. Banks and R. G. Compton, ChemPhysChem, 2003, 4, 169 CrossRef CAS.
- J. Wang, J. M. Lu, S. B. Hocevar and B. Ogorevc, Electroanalysis, 2001, 13, 13 CrossRef CAS.
- E. A. Hutton, S. B. OgorevcHocevar, F. Weldon, M. R. Smyth and J. Wang, Electrochem. Commun., 2001, 3, 707 CrossRef CAS.
- J. Wang, Electroanalysis, 2005, 17, 1341 CrossRef CAS.
- K. E. Toghill, G. G. Wildgoose, A. Moshar, C. Mulchay and R. G. Compton, Electroanalysis, 2008, 20, 1731 CrossRef CAS.
- P. Zong and Y. Nagaosa, Anal. Lett., 2009, 42, 1997 CrossRef CAS.
- B. Nigovic, B. Simunic and S. Hocevar, Electrochim. Acta, 2009, 54, 5678 CrossRef CAS.
- P. Zong and Y. Nagaosa, Microchim. Acta, 2009, 166, 139 CrossRef CAS.
- R. O. Kadara and I. E. Tothill, Anal. Chim. Acta, 2008, 623, 76 CrossRef CAS.
- M. O. Salles, A. P. R. de Souza, J. Naozuka, P. V. de Oliveira and M. Bertotti, Electroanalysis, 2009, 21, 1439 CrossRef CAS.
- J. Kruusma, C. E. Banks and R. G. Compton, Anal. Bioanal. Chem., 2004, 379, 700 CrossRef CAS.
- L. Yong, K. C. Armstrong, R. N. Dansby-Sparks, N. A. Carrington, J. Q. Chambers and Z. L. Xue, Anal. Chem., 2006, 78, 7582 CrossRef CAS.
- J. P. Li, T. H. Peng and X. J. Zhang, Chin. J. Anal. Chem., 2002, 30, 1092 CAS.
- B. Z. Liu, L. Y. Lu, M. Wang and Y. Q. Zi, Electroanalysis, 2008, 20, 2363 CrossRef CAS.
- E. A. Hutton, B. Ogorevc, S. B. Hocevar and M. R. Smyth, Anal. Chim. Acta, 2006, 557, 57 CrossRef CAS.
- R. O. Kadara, N. Jenkinson, B. Li, K. H. Church and C. E. Banks, Electrochem. Commun., 2008, 10, 1517 CrossRef CAS.
- http://kanichi-research.com/.
- A. Goodwin, C. E. Banks and R. G. Compton, Electroanalysis, 2006, 18, 1063 CrossRef CAS.
- L. Highton, R. O. Kadara, N. Jenkinson, B. L. Riehl and C. E. Banks, Electroanalysis, 2009, 21, 2387 CrossRef CAS.
- S. B. Hocevar, B. Ogorevc, J. Wang and B. Pihlar, Electroanalysis, 2002, 14, 1707 CrossRef CAS.
- R. O. Kadara, N. Jenkinson and C. E. Banks, Electroanalysis, 2009, 21, 2410 CAS.
- M. Gonzalez, J. A. Banderas, A. Baez and R. Belmont, Tox. Lett., 1997, 93, 55 Search PubMed.
- C. Bertuzzo, J. M. Goodson, D. Mager, G. L. Pilatti, J. R. Santos, G. M. Silveria, C. C. Stadler and V. A. Kozlowski, J. Dent. Res., 2003, 82, B233.
| This journal is © The Royal Society of Chemistry 2010 |