A spot test for nitrite and nitrate detection by color band length and number of colored zebra-bands formed in a mini-column
Keizou
Niki
a,
Yoshiaki
Kiso
*a,
Takanori
Takeuchi
a,
Tatsuaki
Hori
a,
Tatsuo
Oguchi
a,
Toshiro
Yamada
b and
Masahiro
Nagai
c
aDepartment of Ecological Engineering, Toyohashi University of Technology, Tempaku-cho, Toyohashi 441-8586, Japan. E-mail: kiso@eco.tut.ac.jp; Fax: +81-532-44-6929; Tel: +81-532-44-6906
bDepartment of Water Supply Engineering, National Institute of Public Health, 2-3-6 Minami, Wako-shi, Saitama 351-0197, Japan
cDivision of Human Environment, University of Human Environments, Sanbonmatsu, Motojukucho, Okazaki, Aichi 444-3505, Japan
First published on 30th March 2010
Abstract
A detecting tube for nitrite and nitrate monitoring was developed as a spot test. The detecting tube was prepared by packing of poly(vinyl chloride) (PVC) particles coated with a quaternary ammonium salt into a mini-column. A nitrite solution was treated with sulfanilic acid and 1-naphthol; the resultant colored solution was drawn into the detecting tube by suction with a syringe, and a color band was formed in the tube. The color band length (CBL) corresponded to the nitrite concentration. Nitrate was also detected; after reduction with zinc. The nitrite and nitrate content of domestic wastewater samples was successfully detected by this method over the range of 0.5–45.3 mg-N L−1 as nitrogen concentration. Another type of detecting tube was prepared by alternately packing adsorbent and uncoated PVC particles in a mini-column. Colored zebra-bands were formed in this column, and the nitrite concentration was detected by counting the number of colored zebra-bands. Nitrite and nitrate concentrations in actual wastewater samples were detected more easily by this method, although the accuracy was somewhat lower than that obtained with the CBL method.
1. Introduction
Inorganic nitrogen (NH4+, NO2− and NO3−) and phosphate cause eutrophication,1–6 which in turn can cause the widespread and very serious problem of water pollution.7 NO2− and NO3− among the nutrients are recognized as hazardous pollutants because they cause methemoglobinemia in bottle-fed infants;8,9 10 mg-N L−1 of NO3− and 1 mg-N L−1 of NO2− are the acceptable regulation levels for drinking water in the USA.10 Therefore, controlling the discharge of these nutrients from agricultural fields and in domestic wastewaters and industrial wastewaters is a subject of much interest,11–14 as is nutrient removal during domestic wastewater treatment.Nitrogen removal is commonly conducted by biological processes that include the following steps:15 (1) nitrification (conversion of NH4+ to NO2− and NO3−) by aerobic bacteria (e.g., Nitrosomonas sp. and Nitrobacter sp.) and (2) denitrification (conversion of NO2− and NO3− to N2) by facultative anaerobic bacteria. For biological nitrogen removal systems that include both aerobic and anaerobic conditions, it is necessary to monitor nitrogen species and phosphate, as well as dissolved oxygen, redox potential, and pH.16–21
Effluent nitrate and nitrite concentrations lower than 10 or 20 mg-N L−1 are commonly accepted limits for biological nitrogen removal processes for domestic wastewater.15 Considering these target concentrations along with the aforementioned regulation levels for drinking water, the accurate detection of NO3− or NO2− + NO3− concentrations lower than 20 mg-N L−1 is important.22
Automated nitrate and nitrite monitoring systems can be applied to large-scale wastewater treatment facilities,23,24 but they are not geared toward small-scale facilities. Recently, however, nutrient-removal systems have been employed in small-scale treatment facilities.25,26 For example, in Japan, some domestic wastewater is treated on-site by means of Johkasou systems. Household Johkasous have a capacity of 1–2 m3 d−1, and various types of small-scale Johkasous (1–10 m3 d−1) are currently manufactured, including 60 types for nitrogen removal and 5 types for removal of both nitrogen and phosphorous.27 Automated analytical systems are not practical for such small-scale treatment facilities, and therefore simple and inexpensive monitoring tools are needed for appropriate tuning of the treatment systems' operating conditions.
Many kinds of specially designed kits and instruments for spot tests have been routinely used for the determination of nitrogen species.28 These include a portable spectrophotometer, ion-selective electrodes, a visual determination of sheet color intensity, and a test strip. Visual methods, including visual colorimetry and test strips, are quite inexpensive, but they are believed to have low precision mainly for the following reasons: large human errors among operators, undesirable interference from suspended solids (SS), and in general the detectable concentration level increasing as a geometric series. However, the method in which color intensity of a test strip measured by using a reflectometer enabled relatively precise detection.29
In our previous work,30–32 we developed an alternative simple determination method: a detecting tube method for the detection of phosphate, nitrate, nitrite and ammonium ions. In this method, an anionic colored compound is derived from the analyte, and the colored solution is introduced into the detecting tube. When a detecting tube packed with poly(vinyl chloride) (PVC) particles coated with a quaternary ammonium salt and biphenyl is placed upright in a sample solution, capillary penetration results in the formation of a color band, and the color band length (CBL) is correlated with the analyte concentration. However, the CBL obtained from this method is short (c; 30 mm), and it takes 5 min to introduce the sample into the detecting tube by means of capillary action.
In this work, we focused on development of faster, easier, and more accurate detecting tube methods for nitrite and nitrate in the range of c;50 mg-N L−1. We developed alternative reduction conditions from nitrate to nitrite, which included pretreatment for suppressing effect of high concentration of organic pollutants. We explored the use of suction with a syringe as a means of sample introduction in order to obtain a longer CBL. We also developed a detecting tube in which colored zebra-bands were formed, allowing easy detection by counting the number of zebra-bands (NZB). In addition, we also examined conditions to detect accurately nitrite and nitrate in the range of c;10 mg-N L−1 for monitoring of drinking waters.
2. Materials and methods
2.1 Color development
Nitrite and nitrate standard solutions were prepared with NaNO2 and NaNO3 (analytical grade; NACALAI TESQUE, Kyoto, Japan), respectively; the concentration range was 0–50 mg-N L−1. The nitrite standard solutions were stored in a refrigerator after addition of 1 mg L−1 chloroform.A mixed reagent containing sulfanilic acid (0.08 g), sodium acetate (1.875 g) and zinc powder (0.375 g) was stored in the dark. The reagents were used without further purification (reagent grade, NACALAI TESQUE, Kyoto, Japan). The mixed reagent (0.1864 g) was added to 2 mL of standard solutions or domestic wastewater samples described later, and reduction of NO3− to NO2− was allowed to occur for 7 min after shaking for 30 s. The solution then was filtered with a glass fiber filter, and 1 mL of the filtered solution was used in the following color development (anionic azo dye synthesis) procedure: 0.1 mL of 12.5% (v/v) H2SO4 solution and 0.1 mL of 1-naphthol/ethanol solution (1.25% (w/v)) were added to the filtered solution, and color development was conducted within 10 min. Although 1-naphthylethylenediamine is commonly used as a coupling reagent, the azo dye derived from the reagent was not trapped on adsorbent because of cationic character of ethylenediamine group. Therefore, 1-naphthol was used as a coupling reagent. The resulting orange solution was denoted as Col-1 solution (λmax = 474 nm). When 0.2 mL of 20% (w/v) NaOH solution was added to the Col-1 solution, the color changed to red (Col-2 solution; λmax = 514 nm). Both colored solutions were introduced to the detecting tube.
For nitrite and nitrate detection in wastewater samples containing high concentrations of organic pollutants, 0.1 g of activated carbon (particle size c; 1 mm) was added to 2 mL of the sample water, and the solution was shaken for 30 s before addition of the mixed reagent. This procedure is presented in a flow chart in Fig. 1.

2.2 Detecting tube
The adsorbent packed in the detecting tube was prepared by a similar method which is described in our previous work.30 PVC (particle size: 0.1 mm) was used as a support material and was coated with a mixture of benzylcetyldimethylammonium chloride (BCDMA) and biphenyl by the following procedure: (1) same weight of BCDMA and biphenyl were dissolved in methanol, (2) PVC was added to the solution, and (3) the methanol was evaporated with a rotary evaporator and dried in an oven at 60 °C for 3 h. The BCDMA content was 0.2% or 0.5% (w/w), and the biphenyl content was the same as the BCDMA content. All chemicals were obtained from NACALAI TESQUE (Kyoto, Japan).The adsorbent (0.2% (w/w) BCDMA) was packed into a column (poly(propylene); 3 mm i.d.; 200 mm long); melamine foam was packed on one side and the other side was packed with glass fibers (Type I column). Another column (polyacrylate; 4 mm i.d.; 110 mm long) was also used, and the adsorbent (0.5% (w/w) BCDMA) and uncoated PVC particles were packed alternately in 3-mm layers into this column, referred to as a Type II column (total packed length: 105 mm). Finally, a Type III column was prepared as follows: the adsorbent (0.5% (w/w) BCDMA) was packed to 20 mm height at the bottom of the column, and after that uncoated PVC and the adsorbent were packed in alternating 3-mm layers, as were used in the Type II column. The schematic figures of these three types of column are illustrated in Fig. 2.
 | ||
| Fig. 2 Schematic figures of color band formed in the detection tubes. | ||
2.3 Color band formation
The entire volume of each Col-1 (1.2 mL) solution was introduced into the Type I column by suction with a disposable syringe (capacity: 3 mL) connected to the column. An orange band was formed in the column, and the CBL was measured with a ruler. Since the position of the front of the color band fluctuated, the maximum and minimum lengths were measured and the average values of these lengths were used as the CBL.For Type II and Type III columns, the entire volume (1.4 mL) of each Col-2 solution was introduced to the columns by suction as described above, and colored zebra-bands were formed. NZB was counted to determine the concentrations of analyte.
2.4 Domestic wastewater samples
Domestic wastewater samples were obtained from household Johkasous, and the qualities of them are summarized in Table 1. The samples of No. A1–B3-2 in Table 1 were used to examine the effect of sample pretreatment with activated carbon: the samples included effluents from the primary treatment unit, the final effluents, and wastewater obtained by backwashing of biofilm reactors. The other samples (No.1–19) were obtained from the final effluents from other household Johkasous and were used to examine the performance of the detecting tube method. Nitrite and nitrate concentrations in these samples were also detected by an ion chromatograph (HIC-6; Shimadzu, Kyoto, Japan) under the following conditions: column, PCI-205 (TOA-DKK, Tokyo, Japan); and mobile phase, Na2CO3 (1.8 mM) + NaHCO3 (1.7 mM) at a flow rate of 1.1 mL min−1.| samples No. | SSb/mg L−1 | D-CODc/mg L−1 | NO2–Nd/mg L−1 | NO3–Nd/mg L−1 | Sample No. | SSb/mg L−1 | D-CODc/mg L−1 | NO2–Nd/mg L−1 | NO3–Nd/mg L−1 | |
|---|---|---|---|---|---|---|---|---|---|---|
| a Sample No.: A1, B1: primary effluent; A2, B2: final effluent; A3, B3: backwashed wastewaters of biofilm processes No. 1–9: Johkasous receiving only water from toilet flushing; 10–19: Johkasous for domestic wastewater treatment. b suspended solids. c dissolved chemical oxygen demand (COD). d detected by ion chromatography. | ||||||||||
| A1 | 33.3 | 44.8 | 2.4 | 3.5 | 6 | 32.1 | 50.8 | 0.2 | 16.4 | |
| A2 | 25.9 | 30.6 | 1.3 | 1.7 | 7 | 25.8 | 35.0 | 0.2 | 15.6 | |
| A3 | 1878 | 545 | 0.0 | 0.1 | 8 | 20.7 | 64.8 | 12.9 | 19.8 | |
| B1-1 | 104.9 | 61.5 | 0.5 | 1.9 | 9 | 42.9 | 35.8 | 0.0 | 25.7 | |
| B1-2 | 54.9 | — | 0.0 | 0.0 | ||||||
| B2-1 | 58.0 | 46.2 | 0.2 | 0.8 | 10 | 2.47 | 30.8 | 1.3 | 2.7 | |
| B2-2 | 5.8 | 21.4 | 0.1 | 0.7 | 11 | 35.3 | 31.0 | 0.9 | 0.9 | |
| B3-1 | 465 | 50.8 | 0.0 | 2.6 | 12 | 10.7 | 19.0 | 0.1 | 1.0 | |
| B3-2 | 60.4 | 38.1 | 0.0 | 2.7 | 13 | 8.52 | 26.0 | 0.3 | 2.7 | |
| 14 | 2.02 | 11.4 | 0.2 | 6.9 | ||||||
| 1 | 73.6 | 93.8 | 2.0 | 40.8 | 15 | 2.06 | 32.1 | 0.4 | 0.4 | |
| 2 | 45.9 | 88.6 | 0.1 | 28.1 | 16 | 75.6 | 34.6 | 0.2 | 0.3 | |
| 3 | 3.2 | 16.4 | 0.6 | 11.0 | 17 | 2.06 | 21.3 | 0.3 | 3.7 | |
| 4 | 76.7 | 53.0 | 8.7 | 3.8 | 18 | 2.08 | 48.2 | 0.6 | 0.8 | |
| 5 | 33.3 | 26.4 | 0.1 | 0.0 | 19 | 4.65 | 38.4 | 0.1 | 0.6 | |
3. Results and discussion
3.1 Effect of pretreatment on reduction of NO3− to NO2−
Nitrate standard solution was added to the wastewater samples (No. A1–B3-2); the additive NO3−-N concentration was 30 mg-N L−1. Samples with and without pretreatment with activated carbon were subjected to the color development process, in which the reduction of NO3− to NO2− was determined from the absorbance measured by a spectrophotometer. For the samples without pretreatment, the percent reduction from NO3− to NO2− was low and unstable, with an average and standard deviation of 39.9% and 24.6%, respectively. In contrast, for the pretreated samples, high and stable nitrate reduction was observed, with a percent reduction average and standard deviation of 96.9% and 3.2%, respectively. Because the activated carbon treatment was effective for samples containing high concentrations of organic pollutants, as demonstrated by these results, the pretreatment procedure was employed to process the domestic wastewater samples.3.2 Detection by CBL
The colored solutions derived from the nitrite standard solutions (0–50 mg-N L−1) were introduced into the Type I column by means of capillary penetration. This method required 5–8 min to fill the solution to the top of the column. In contrast, when the suction method was employed, the entire volume of colored solution (1.2 mL) was introduced into the column within 40 s, and substantially longer color bands were formed.The CBL results for nitrite standards, which were obtained by five parallel determinations using the Col-1 solutions, are presented in Fig. 3. The results obtained by the capillary penetration method are also shown in the figure. Although fluctuation of the color band front was observed, the relative standard deviations (RSDs) of the average CBL were less than 5.3%, and high reproducibility was obtained with the suction method. The CBL was not correlated linearly with nitrite concentration, and this discrepancy might have been caused by multi-layer adsorption of the azo dye on the adsorbent. Therefore, the calibration curve was approximated with four linear equations. Examination of the calibration curve indicated that a range of 1–50 mg-N L−1 of nitrite could be detected on the basis of CBL.
 | ||
| Fig. 3 Relationship between NO2−-N concentration and CBL (Type I column; Col-1 solution). | ||
NaNO3 (additive NO3−-N: 30 mg-N L−1) was added to each of the domestic wastewater samples (No. A1–B3-2) listed in Table 1 and was detected by the detecting tube method with and without activated carbon pretreatment. The plots of the results obtained by this method versus those obtained with an ion chromatograph are shown in Fig. 4. In the case without activated carbon pretreatment, the NO3−-N concentrations obtained by the detecting tube method were obviously lower than those obtained by the ion chromatograph because of incomplete reduction of nitrate. However, the detecting tube method results for samples subjected to activated carbon pretreatment corresponded well with the ion chromatograph results.
 | ||
| Fig. 4 Effect of pretreatment with activated carbon on reduction of NO3−-N to NO2−-N (Type I column; domestic wastewater samples: No. A1–B3-2; Col-1 solution). | ||
The detecting tube method with activated carbon pretreatment was employed to determine the total concentration of NO2−-N and NO3−-N of the domestic wastewater samples (No. 1–19). Fig. 5 shows the relationship between the results obtained by this method (three parallel determinations) and the results obtained by the ion chromatograph. The range detected by the detecting tube was 0.5–45.3 mg-N L−1 and the range detected by ion chromatography was 0.1–42.8 mg-N L−1. The error incurred with the detecting tube method was approximately −1.4 to +2.6 mg-N L−1 (average: 0.4 mg-N L−1). Therefore, the detecting tube method provided an accurate spot test for determination of NO2−-N and NO3−-N in the range of 1–50 mg-N L−1.
 | ||
| Fig. 5 Performance of detection by the Type I column (domestic wastewaters samples: No.1–19; Col-1 solution). | ||
3.3 Detection by NZB
The colored solution (Col-2) was introduced into a Type II or Type III column by means of the suction method described above. The azo dye was entrapped on the adsorbent in the column to form zebra-bands (Fig. 6). In the Type II or Type III column, the color band observed in Type I columns was effectively distributed across multiple colored zebra-bands. | ||
| Fig. 6 Photos of color bands formed by suction method (NO2−-N: 15.2 mg-N L−1). | ||
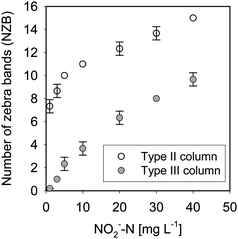
The relationship between NO2−-N concentration and NZB is shown in Fig. 7; triplicate determination was conducted for each standard nitrite solution. The error for each measurement was determined by comparing one CBL in the Type II or III column with the length of an adjacent color band. In the Type II column, many zebra-bands were formed (i.e., a large NZB was observed), with an increase of one in the NZB corresponding to an increase of 10 mg-N L−1 for NO2−-N in the range of more than 10 mg-N L−1. In contrast, for the Type III column, the NZB was smaller; counting of NZB was conducted more easily.
 | ||
| Fig. 7 Relationship between NO2−-N concentration and NZB (Col-2 solution; symbol: average; error bar: standard deviation). | ||
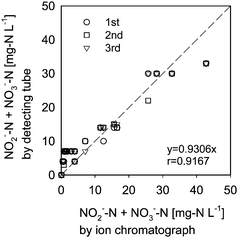
Type III columns were used for quantification of NO2−-N + NO3−-N in the domestic wastewater samples (No.1–19), and the results are shown in Fig. 8. The Type III column allowed for easy detection. However, because this type of detecting tube gave only discrete values of concentration, the accuracy was lower than that obtained by the CBL method (Type I column).
 | ||
| Fig. 8 Performance of detection by the Type III column (domestic wastewater samples: No. 1–19; Col-2 solution; n = 3). | ||
Below 5 mg-N L−1, the concentrations obtained from the samples in the Type III column were higher than those obtained by the ion chromatograph. However, the detecting tube method using a Type III column might be acceptable for monitoring the performance of small-scale wastewater treatment processes.
For monitoring environmental waters and sources of drinking water, the detection of NO2−-N + NO3−-N concentrations below 10 mg-N L−1 (a common regulatory level) is required. For this purpose, we modified a Type III column as shown in Fig. 9. Col-1 solutions were prepared with NO2− standard solutions, and 0.5 mL of the solution was introduced into the detecting tube by the suction method. NZB increased linearly with increasing NO2−-N concentration below 10 mg-N L−1 (Fig. 10). The detection was repeated 5 times for each standard solution, and the error for each measurement was determined by comparing one CBL in the modified Type III column with the length of an adjacent color band. The results obtained were very reproducible, and they indicated that NO2−-N or NO2−-N + NO3−-N could be successfully determined at c;10 mg-N L−1. For nitrite detection, the reduction process can be eliminated. This method may be a useful monitoring tool for drinking water and sources of drinking water, and pretreatment with activated carbon is unnecessary for these samples.
 | ||
| Fig. 9 Schematic figure of the modified Type III column. | ||
 | ||
| Fig. 10 Relationship between NO2−-N concentration and NZB (modified Type III column: Col-1 solution; n = 5). | ||
4. Conclusions
Use of the detecting tube method enabled rapid and accurate detection of nitrite and of nitrate after its reduction to nitrite. Use of suction to introduce the sample solutions into the detecting tube gave longer CBLs than did the capillary penetration method. Concentrations of nitrite and nitrate in domestic wastewater samples were successfully detected in the range of 0.5–45.3 mg-N L−1. The detecting tube of this type has the advantage of easy preparation. Another column-packing approach was also developed to form colored zebra-bands in a detecting tube. By use of this method, nitrite and nitrate concentrations were detected on the basis of the NZB observed in the column. Concentrations in the range of 2–40 mg-N L−1 were easily detected. The zebra-band method as a new type of spot test may be more useful for on-site monitoring of domestic wastewater samples, although the accuracy obtained with the zebra-band method was somewhat lower than that obtained by CBL determination. The zebra-band method with a modified detecting tube detected accurately nitrite in the range of c;10 mg-N L−1. However, because preparation of the detecting tube to produce colored zebra-bands is difficult, we intend to continue to optimize this method in future studies.References
- R. F. Smith and H. F. Ludwig, Water Res., 1968, 2, 625–630 CrossRef.
- G. Chiaudani and M. Vighi, Water Res., 1974, 8, 1063–1069 CrossRef CAS.
- V. H. Smith, G. D. Tilman and J. C. Nekola, Environ. Pollut., 1999, 100, 179–196 CrossRef CAS.
- K. E. Havens, T. Fukushima, P. Xie, T. Iwakuma, R. T. James, N. Takamura, T. Hanazato and T. Yamamoto, Environ. Pollut., 2001, 111, 263–272 CrossRef CAS.
- A. A. Koelmans, A. Van der Heijde, L. M. Knijff and R. H. Aalderink, Water Res., 2001, 35, 3517–3536 CrossRef CAS.
- J. A. Camargo, Á Alonso and M. de la Puente, Water Res., 2005, 39, 3376–3384 CrossRef CAS.
- J. L. Graham, J. R. Jones, S. B. Jones, J. A. Downing and T. E. Clevenger, Water Res., 2004, 38, 4395–4404 CrossRef CAS.
- A. M. Fan and V. E. Steinberg, Regul. Toxicol. Pharmacol., 1996, 23, 35–43 CrossRef CAS.
- WHO, http://www.who.int/water_sanitation_health/diseases/methaemoglob/en/.
- U.S. EPA, http://www.epa.gov/safewater/chemicalcontaminantrules/basicinformation.html%23one.
- Z. Hu, M. C. Wentzel and G. A. Ekama, Water Res., 2003, 37, 3430–3444 CrossRef CAS.
- S. Aiyuk, J. Amoako, L. Raskin, A. Van Haandel and W. Verstraete, Water Res., 2004, 38, 3031–3042 CrossRef CAS.
- C. B. Ersu, S. K. Ong, E. Arslankaya and P. Brown, Water Res., 2008, 42, 1651–1663 CrossRef.
- V. C. Machado, D. Gabriel, J. Lafuente and J. A. Baeza, Water Res., 2009, 43, 5129–5141 CrossRef CAS.
- C. P. L. Grady, G. T. Daigger and H. C. Lim, Biological wastewater treatment, 2nd ed., 1999, Marcel Dekker Inc., New York, Chapter 11 Search PubMed.
- I. Schmidt, O. Sliekers, M. Schmid, E. Bock, J. Fuerst, J. G. Kuenen, M. S. M. Jetten and M. Strous, FEMS Microbiol. Rev., 2003, 27, 481–492 CrossRef CAS.
- J. A. Baeza, D. Gabriel and J. Lafuente, Process Biochem., 2004, 39, 1615–1624 CrossRef CAS.
- T. Saito, D. Brdjanovic and M. C. M. Loosdrecht, Water Res., 2004, 38, 3760–3768 CrossRef CAS.
- M. A. Gómez, J. González-López and E. Hontoria-García, J. Hazard. Mater., 2000, 80, 69–80 CrossRef CAS.
- M. A. Gómez, E. Hontoria and J. González-López, J. Hazard. Mater., 2002, 90, 267–278 CrossRef CAS.
- C. T. Matos, A. M. Sequeira, S. Velizarov, J. G. Crespo and M. A. M. Reis, J. Hazard. Mater., 2009, 166, 428–434 CrossRef CAS.
- D. S. Lee, C. O. Jeon and J. M. Park, Water Res., 2001, 35, 3968–3976 CrossRef CAS.
- A. Daniel, D. Birot, S. Blain, P. Treguer, B. Leilde and E. Menut, Mar. Chem., 1995, 51, 67–77 CrossRef CAS.
- A. Aminot, R. Kerouel and D. Birot, Water Res., 2001, 35, 1777–1785 CrossRef CAS.
- N. Kishida, J. Kim, S. Tsuneda and R. Sudo, Water Res., 2006, 40, 2303–2310 CrossRef CAS.
- T. Ichinari, A. Ohtsubo, T. Ozawa, K. Hasegawa, K. Tezuka, T. Oguchi and Y. Kiso, Process Biochem., 2008, 43, 722–728 CrossRef CAS.
- Japan Education Center of Environmental Sanitation, Handbook of Torokukogatagapeishori Johkasou, 2008, Tokyo, Japan Search PubMed.
- E. Jungreis, Spot Test Analysis: Clinical, Environmental, Forensic, and Geochemical Applications (2nd Edition), 1997, John Wiley & Sons, Inc., New York, pp. 255–257 Search PubMed.
- L. C. Waters, R. W. Counts, A. Palausky and R. A. Jenkins, J. Hazard. Mater., 1995, 43, 1–12 CrossRef CAS.
- Y. Kiso, Y.-J. Jung, K. Kuzawa, Y. Seko, Y. Saito, T. Yamada and M. Nagai, Chemosphere, 2006, 64, 1949–1954 CrossRef CAS.
- Y. Kiso, K. Kuzawa, Y. Saito, T. Yamada, M. Nagai, Y.-J. Jung and K.-S. Min, Anal. Bioanal. Chem., 2002, 374, 1212–1217 CrossRef CAS.
- S. Asaoka, Y. Kiso, T. Oguchi, Y.-J. Jung, T. Yamada, Y. Saito and M. Nagai, Talanta, 2007, 72, 1100–1105 CrossRef CAS.
| This journal is © The Royal Society of Chemistry 2010 |