Ultra-sensitive detection of heavy metal ions in tap water by laser-induced breakdown spectroscopy with the assistance of electrical-deposition
Fang
Zhao
a,
Zhiming
Chen
a,
Fupeng
Zhang†
a,
Runhua
Li
*a and
Jianying
Zhou
b
aDepartment of Physics, School of Science, South China University of Technology, Guangzhou, 510641, China. E-mail: rhli@scut.edu.cn
bState Key Laboratory of Optoelectronic Materials and Technologies, Sun Yat-Sen University, Guangzhou, 510275, China
First published on 25th January 2010
Abstract
The trace heavy metal ions in tap water were electrically deposited on the surface of a high purity aluminium rod and then analyzed with laser-induced breakdown spectroscopy (LIBS). Cr3+, Mn2+, Cu2+, Zn2+, Cd2+ and Pb2+ in tap water samples were quantitatively analyzed and the calibration curves have been built up within the concentration range of 1–1000 μgL−1. The limits of detection of these ions were determined to be 0.16–1.35 μgL−1, which are improved 5–6 orders than directly analyzing aqueous solutions by LIBS. The influence of Ca2+ and Mg2+ in water at different concentrations to the quantitative analysis of trace heavy metal ions was evaluated. It is possible to realize reliable quantitative analysis by using different calibration curves according to the hardness of the analyzed water samples. LIBS plus electrochemical enrichment is a potential approach to high sensitivity detection of trace heavy metal ions in tap water and natural water samples, and it will find applications in environmental pollution monitoring.
1. Introduction
Toxic heavy metal ions in water pose potential dangers to the health of humans, even in trace amount. Sensitive analysis or in situ monitoring of trace heavy metal ions in water is very important. In the past decades, different instrumental analysis techniques have been used to analyze the trace heavy metal ions in water, these include AAS, ICP-AES, MPT(microwave plasma torch)-AES and ICP-MS.1–4 Other analytical techniques, such as electrochemical analysis,5–8 fluorescence measurement,9–11 absorption measurement,12 X-ray fluorescence technique,13,14 and electrolyte cathode atmospheric glow discharge (ELCAD)15 have also been developed to analyze trace heavy metals in water.To enhance the detection sensitivity of the trace or ultra-trace heavy metal ions in water, several pre-concentration methods have been developed. These include solvent or solid extraction,16–19 on-line pre-concentration using chelating resin,3,20–22 and electrochemical enrichment.13,23 Bio-monitoring techniques are an indirect method to monitor heavy metals in water, in which the contents of heavy metals in plants, cells, mussels and fish are analyzed with traditional analytical instruments.24–27
Laser-induced breakdown spectroscopy (LIBS) can be used for a rapid analysis of heavy metals in water. The detection sensitivity of direct analysis of aqueous solutions is usually poor with single-pulse LIBS, while the laser was focused on the liquid surface or into the bulk liquid. To overcome this drawback, the liquid sample can be absorbed into different solid substrates, thus transferring liquid sample analysis to solid sample analysis.28–31 Dual-pulse LIBS has been developed to enhance the detection sensitivity of single-pulse LIBS and can be successfully used to analyze elements in water.32,33 However, dual-pulse LIBS needs two laser sources, this inevitably increases the complexity and cost of the measurement system. In a previous work, we combined single-pulse LIBS with electrical-deposition enrichment method to realize ultra-sensitive trace metal analysis of water samples and predicted a potential application of this technique in monitoring of environmental pollution of heavy metal in water.34 In this previous work, the heavy metal ions were added into deionized water for experimental studies, thus the interference of other ions existed in natural water at relatively high concentrations, such as Ca2+, Mg2+, to the electrical-deposition process has not yet been studied.
The purpose of this work is to explore the feasibility of LIBS on sensitive detection of toxic heavy metal ions in natural water with the assistance of electrical-deposition enrichment method. A rotating cathode was designed to enrich the heavy metals in water and reduce gas bubble interference during the deposition process. The influence of Ca2+ and Mg2+ at high concentration to the deposition process of lead at low concentration was experimentally studied. The same level of detection sensitivity of heavy metal ions in tap water has been achieved as that in deionized water after taking longer deposition time.
2. Experimental
2.1 Electrical-deposition apparatus
The apparatus of electrical deposition is depicted in Fig. 1. High purity aluminium (99.999%) was chosen as cathode material. There are two reasons to do so: first, high purity aluminium is cheap and easy to buy; second, the strong spectral lines of aluminium within 200–450 nm region are rare and will not congest with the analysis lines of most metals. The aluminium rod used as cathode was cut to 42 mm long and 8 mm in diameter and was rotated around its axis by a stepping motor. The revolution speed of the stepping motor was set at 20 r.p.m. (revolutions per minute). A glass beaker was used as a deposition cell, in which 800 mL aqueous solution was contained. The beaker was put on a magnetic stirring apparatus and the solution was stirred with a magnetic stirrer at a revolution rate of 600 r.p.m. to ensure the homogeneity of the concentration of the analytes during electrical-deposition.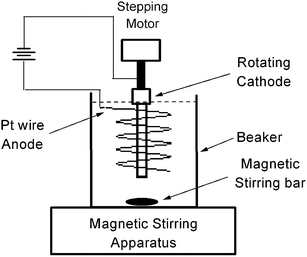 | ||
| Fig. 1 The apparatus of electrical-deposition. | ||
A platinum wire of 1 mm diameter was twisted to helix shape and used as an anode. The helix anode was 50 mm high and 30 mm in inner diameter and was immersed into the aqueous solution. The aluminium rod was placed at the position of the central axis of the helix. A variable DC voltage of 2–15 V was applied between the electrodes. The revolution of the aluminium rod during electrical-deposition process is helpful for throwing off the gas bubbles generated on rod surface effectively and ensuring the homogeneity of the deposited heavy metals on the rod surface. After electrical-deposition for a period, the aluminium rod was taken out and mounted on a translation stage for immediate elemental analysis by LIBS.
2.2 Chemicals and sample preparation
To prepare aqueous solutions of Cr3+, Mn2+, Cu2+, Zn2+, Cd2+ and Pb2+ with different concentrations, chromium(III) chloride, manganese chloride, copper chloride, zinc chloride, cadmium chloride, and lead nitrate were dissolved with deionized water to prepare aqueous solutions of the metal ions with high concentrations. Then 20 mL original solutions were diluted to 800 mL with tap water to prepare aqueous solutions for experimental studies. The chemicals were purchased from Fuchen Chemical Reagents (Tianjin, China). The purities of them were over 99.0% and no further purifications were carried out in the experiments.2.3 Experimental setup of LIBS
The experimental setup used in our laboratory was reported in detail before.28 Briefly, the fundamental output (1064 nm) of a Q-switched Nd:YAG laser was slightly defocused on the surface of an aluminium rod with a spherical lens (BK7, focal length = 150 mm). The pulse duration was 12 ns and the repetition rate was 5 Hz for the laser. Typical laser pulse energy was 50 mJ in the experiments. The aluminium rod was mounted on a specially designed translation-rotation stage that was driven by two stepping motors. During the run of the experiment, the rod moves from one end to the other end horizontally, and then rotates a small angle around its horizontal axis, and then moves back again horizontally to the starting end. The linear speed of the horizontal motion was 1 mm s−1 during the experiments to ensure that the laser hit a fresh surface for each shot. The plasma spark was imaged onto the entrance slit of a 50 cm monochromator equipped with a 2400 lines/mm diffraction grating and a photomultiplier tube (PMT). The spectral resolution of the monochromator was less than 0.1 nm in UV-visible region at 100 μm widths of both entrance and exit slits.The electrical signal of the PMT was monitored with a 250 MHz digital storage oscilloscope and the data were sent to a personal computer via a GPIB interface for further processing. To get an averaged signal of the atomic emission at analysis line wavelength and enhance the signal to noise ratio (S/N), the oscilloscope was set at 256 pulses' averaged mode and the temporal profile of the light emission was averaged for 300 shots, then the data of the profiles were recorded to calculate the line intensity. Time-resolved detection technique was applied to decrease the background contribution from the electron Bremsstrahlung emission. The optimized gate parameters for data acquisition for different atoms and their analysis line wavelengths are listed in Table 1.
3. Results and discussion
3.1 Optimization of parameters of electrical-deposition
The concentrations of trace heavy metal ions in natural water are usually very low. However, some cations, such as Ca2+ and Mg2+ exist in tap water with high concentrations, usually at the level of a few hundreds micro-mole per litre (μM). In addition, there exist some anions in tap water. In electrical-deposition process, all these ions will participate in electrochemical reactions on the electrodes, thus generate a current of a few to tens of milliampere, which depends on the amplitude of electrical-field (V/d) used. At the same time, lots of gas bubbles generated on the surfaces of both electrodes due to electrolyte of water molecules. Gas bubbles will hinder electrical-deposition of the interested heavy metal ions on the surface of aluminium rod. A revolution of the aluminium rod will be able to reduce this effect. In order to have a good analytical performance with the present system, the parameters of electrical-deposition were first optimized by experimental studies.Under ideal conditions without gas bubble interference and in a limited volume of the solution, the number of deposited atoms on the surface of the aluminium rod can be described as,34
| N = C0V(1 − e−BUt) | (1) |
Fig. 2 shows a plot of the intensity of the atomic emission of lead at 405.78 nm and copper at 324.75 nm versus the deposition voltage. The concentrations of Pb2+ and Cu2+ in the analyzed aqueous solution were 207.2 μgL−1 and 63.5 μgL−1 respectively, and the deposition time was 15 min. The optimized voltages determined in the experimental studies were both about 7.5 volts. Further increase of the voltage will decrease the number of deposited atoms during the same deposition time. This implies that the optimized deposition voltage is mainly determined by water matrix but not by electrochemical property of metal ions. Because the amount of gas bubbles generated on the surfaces of both anode and cathode is dependent on the applied voltage and hardness of water. Increasing deposition voltage will generate more gas bubbles and the interference of these bubbles to the deposition process will become more and more serious. Furthermore, for harder water (with higher concentrations of Ca2+ and Mg2+), the optimized deposition voltage will be expected to be lower.
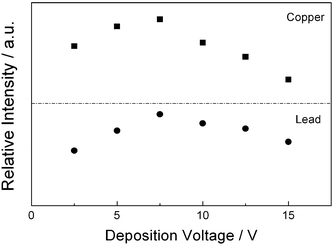 | ||
| Fig. 2 The relation of observed atomic emission intensities of copper and lead to the applied voltage between electrodes. The deposition time was 15 min and the concentration of Cu2+ and Pb2+ were 63.5 μgL−1 and 207.2 μgL−1, respectively. | ||
Fig. 3 shows the relation of emission intensity of lead atoms to the deposition time, the voltage was 7.5 volts and concentration of Pb2+ was 207.2 μgL−1. This is similar with the result obtained using deionized water as solvent, the number of deposited atoms increase with the increasing of deposition time. Considering both speed of analysis and sensitivity, 20-minute deposition time and 7.5 volts deposition voltage were selected for all six elements in the following experimental studies.
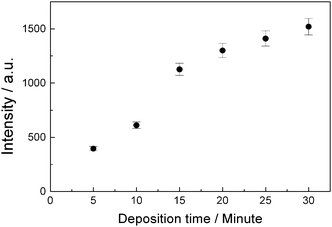 | ||
| Fig. 3 The relation of observed atomic emission intensity of lead to the deposition time. The deposition voltage was 7.5 volts and the concentration of Pb2+ was 207.2 μgL−1. | ||
3.2 Quantitative analysis
Using 7.5 volts deposition voltage and 20 min deposition time, the contents of Cr3+, Mn2+, Cu2+, Zn2+, Cd2+, and Pb2+ in tap water were analyzed using LIBS with the assistance of electrical-deposition. All six heavy metals were artificially added into tap water for building up calibration curves. Using C0 represents the original (background) concentration of ions and x represents the concentration of the added ions for one element, the real concentration of this element in the water is x + C0, then the calibration curve of the corresponding element can be fitted with the following formula if considering the self-absorption saturation effects:35| y = bc(1 − exp(−(x + C0)/c) | (2) |
| y = b(x + C0) | (3) |
Table 2 lists all the fitted results of parameters of b, c and C0 for six heavy metal ions in tap water.
| Element | b | c | C 0/μgL−1 | LOD/μgL−1 |
|---|---|---|---|---|
| Cr | 28.40 | 135.66 | 0 | 0.317 |
| Mn | 42.53 | 179.72 | 18.46 | 0.176 |
| Cu | 138.98 | 129.79 | 5.376 | 0.162 |
| Zn | 18.85 | — | 11.79 | 1.35 |
| Cd | 22.85 | 202.47 | 0 | 0.787 |
| Pb | 9.48 | 700.82 | 0 | 0.570 |
Fig. 4(a) shows the plots of emission intensity versus concentration of the added ions. The fitted curves do not pass through zero point of the axes. The absolute value of the intersection point of the fitted curve with horizontal axis is corresponding to the original concentration, C0, of each element in the tap water. That is to say, the concentration of metal ions in the tap water can be determined by this way. After knowing C0, a calibration curve can be re-plotted for each element by plotting intensity versusreal concentration of each element in the water, that is Cadded + C0 (Fig. 4(b)). Fig. 5(a) and Fig. 5(b) shows the calibration curves of copper and zinc, magnesium and chromium, cadmium and lead, respectively. Then the quantitative analysis of the trace heavy metal ions in tap water can be carried out using these calibration curves and observed spectral intensities.
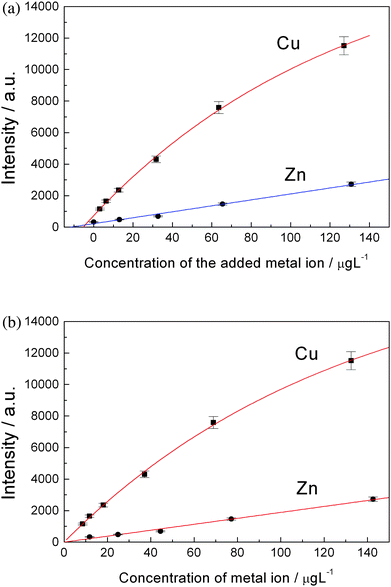 | ||
| Fig. 4 (a) A plot of observed atomic emission intensities versus concentrations of artificially added metal ions. The points were fitted with eqn (2). The absolute values of the intersect points on horizontal axis are corresponding to the original concentrations of Cu2+ and Zn2+ in tap water. (b) Calibration curves of copper and zinc. | ||
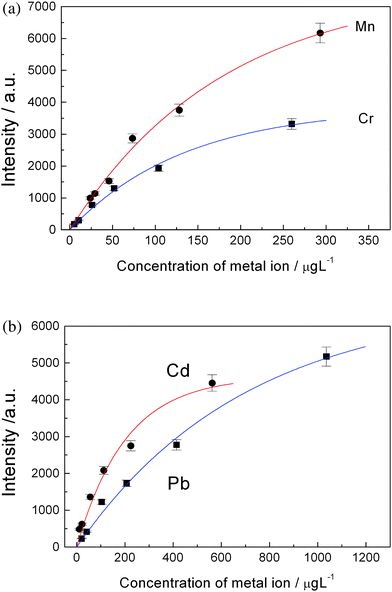 | ||
| Fig. 5 (a) Calibration curves of manganese and chromium; (b) Calibration curves of cadmium and lead. | ||
The limit of detection (LOD) of one element was estimated according to 3σ rule, that is:
 | (4) |
3.3 Influence of Ca2+ and Mg2+
In order to study the influence of the concentration of Ca2+ and Mg2+ to the deposition process of the trace heavy metal ions, different amounts of calcium chloride and magnesium chloride were added into deionized water to prepare aqueous solutions. The solutions also contained Pb2+ at the concentration of 207.2 μgL−1. The plots of observed lead emission intensity in LIBS versus the concentration of Ca2+ and Mg2+ are shown in Fig. 6(a) and 6(b), respectively. The observed emission intensity of lead decreases with increasing of the concentration of Ca2+ or Mg2+ in the water. The points can be approximately fitted with linear lines, and the slopes of the linear lines for Ca2+ and Mg2+ are −3 and −15 L mg−1, respectively. This is reasonable because Mg2+ is easier to deposit on the cathode than Ca2+ according to their electrochemical properties. Fortunately, the concentration of Mg2+ in natural water is usually lower than Ca2+ (usually Ca2+![[thin space (1/6-em)]](https://www.rsc.org/images/entities/char_2009.gif) :
:![[thin space (1/6-em)]](https://www.rsc.org/images/entities/char_2009.gif) Mg2+ is about 2
Mg2+ is about 2![[thin space (1/6-em)]](https://www.rsc.org/images/entities/char_2009.gif) :
:![[thin space (1/6-em)]](https://www.rsc.org/images/entities/char_2009.gif) 1∼2.5
1∼2.5![[thin space (1/6-em)]](https://www.rsc.org/images/entities/char_2009.gif) :
:![[thin space (1/6-em)]](https://www.rsc.org/images/entities/char_2009.gif) 1, in mg L−1), one can expect that the influence of Mg2+ to the electrical deposition process will be comparable to Ca2+ for natural water samples. We have not studied the influence of Na+ and K+ to the electrical deposition of trace heavy metals because of their lower concentrations in natural water samples in comparison with Ca2+ and Mg2+. Another reason is Na+ and K+ ions are univalent, physically, their moving speed should be slower than bivalent Ca2+ and Mg2+ ions in the same electrical field, thus the expected deposition rate of Na+ and K+ should be lower than that of Ca2+ and Mg2+.
1, in mg L−1), one can expect that the influence of Mg2+ to the electrical deposition process will be comparable to Ca2+ for natural water samples. We have not studied the influence of Na+ and K+ to the electrical deposition of trace heavy metals because of their lower concentrations in natural water samples in comparison with Ca2+ and Mg2+. Another reason is Na+ and K+ ions are univalent, physically, their moving speed should be slower than bivalent Ca2+ and Mg2+ ions in the same electrical field, thus the expected deposition rate of Na+ and K+ should be lower than that of Ca2+ and Mg2+.
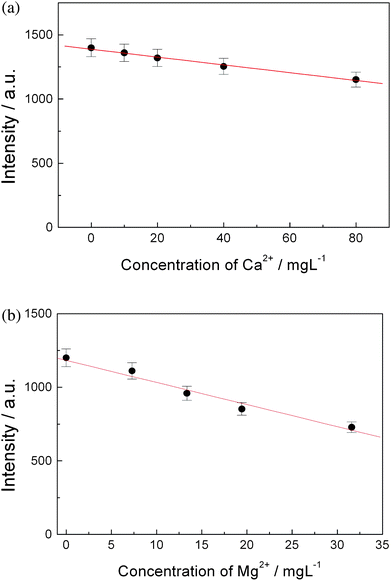 | ||
| Fig. 6 Relation of the observed intensity of atomic emission of lead to the concentration of Ca2+ and Mg2+ in the water, the concentration of Pb2+ in water was 207.2 μgL−1, the deposition voltage was 7.5 volts and deposition time was 15 min. (a) Ca2+, (b) Mg2+. | ||
3.4 Calibration curves for different water samples
Due to the influence of Ca2+ and Mg2+ to the process of electrical deposition, the calibration curves of one element obtained in different water samples must be different. Hardness is a parameter to indicate the amount of Ca2+ and Mg2+ in water. If a serious calibration curve of one element for different water samples with different hardness values has been established, then the method described here will be able to give a reliable analysis of the concentrations of trace heavy metal ions in different water samples, only need refer to the hardness of the water samples. As an example, Fig. 7 shows two calibration curves of lead obtained for two different water samples, the hardness of them are about 50 mg L−1 (CaCO3) and 80 mg L−1 (CaCO3), respectively. Where the former is tap water and the latter is tap water added with calcium chloride and magnesium chloride artificially. To simulate natural water samples, the concentration (in mg L−1) ratio of added Ca2+ to Mg2+ in this experiment is 2![[thin space (1/6-em)]](https://www.rsc.org/images/entities/char_2009.gif) :
:![[thin space (1/6-em)]](https://www.rsc.org/images/entities/char_2009.gif) 1.
1.
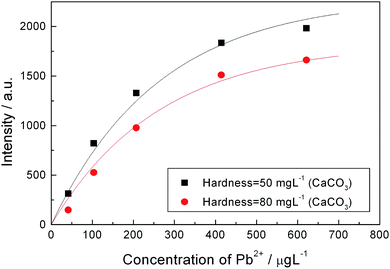 | ||
| Fig. 7 Calibration curves of lead obtained from different water samples with different hardness. The deposition time is 20 min and deposition voltage is 5 volts, which is better than 7.5 volts for harder water. | ||
3.5 Co-deposition of different metal ions
Different metal ions present different potentials of deposition on the surface of the aluminium rod, depending on their electrochemical properties. To study the possibility of simultaneous multi-element analysis of natural water samples using this technique, trace amounts (at 2 μM) of Cd2+, Cr3+ and Pb2+ were added into the water samples taken from a river and then analyzed with this technique. Atomic emission from calcium, magnesium, copper, zinc, iron, cadmium, chromium and lead etc. can all be observed in the wavelength region of 200–450 nm. This observation demonstrates that different metal ions can be co-deposited on the surface of the aluminium rod simultaneously, no matter whether their concentrations are high or low. (The concentrations of Ca2+ and Mg2+ in natural water are two-orders higher than that of added heavy metal ions, such as Cd2+, Cr3+ and Pb2+.) Therefore, a simultaneous multi-elements analysis with this technique will be possible once their calibration curves have been established.Usually the concentration of heavy metal ions in natural water is much lower than Ca2+ and Mg2+. In electrical deposition process, most of the deposited materials are calcium and magnesium, thus the plasma property will be mainly affected by aluminium (base material), calcium and magnesium. The matrix effect due to co-deposited heavy metals in laser-ablation and breakdown process should be negligible. However, the effect of calcium and magnesium has already been accounted for while establishing the calibration curves. One conclusion can be unambiguously made that, if a calibration curve of one element has been established for natural water samples, it is able to use this calibration curve in quantitative analysis for natural water samples with approximately equal hardness.
3.6 Technical discussion
One of the major advantages of LIBS combined with electrical-deposition enrichment is its high sensitivity for analyzing trace metal ions in water. The reasons include concentration enrichment, elimination of quenching effect of water molecules to atomic emission, and reduced continuum background due to low laser power density was required to ablate and excite the heavy metals deposited on the surface of the aluminium rod. Another major advantage is the possibility of simultaneous multi-elements analysis. If replacing the monochromator and PMT with a spectrometer and ICCD (Intensified Charged-Coupled Device), a spectrum between 180–900 nm can be obtained within just a few minutes with good S/N ratio and different trace metals in water samples can be quantitatively determined. The third advantage of this technique is that the operator does not need to pose in danger when analyzing toxic heavy metals. Such as in electrochemical analysis of cadmium and lead, a mercury electrode has to be used. However, mercury is harmful to operators and the environment.The only drawback of the electrical deposition is that it usually needs to take a few to tens of minutes for enrichment, which decreases the analysis speed. However, this drawback can be partially compensated if simultaneous multi-element analysis is carried out. On the other hand, if the detection sensitivity improved, it is possible to reduce the deposition time. The detection sensitivity of the present system can be further improved by using a dual-pulse LIBS setup, optimizing optical detection system and optimizing the design of the electrical-deposition apparatus.
4. Conclusions
The different trace heavy metal ions in tap water can be electrically co-deposited on the surface of an aluminium rod and analyzed by LIBS with high detection sensitivity. The limits of detection of Cr3+, Mn2+, Cu2+, Zn2+, Cd2+ and Pb2+ in tap water were determined to be 0.16–1.35 μgL−1 with present experimental setup and can be further improved. This technique is suitable for quantitative analysis of different water samples with different hardness. A sensitive simultaneous multi-element analysis will be possible using LIBS with the assistance of electrical-deposition for tap water and natural water samples, which is very important in environmental pollution monitoring.Acknowledgements
The authors are grateful to undergraduate students, Yiwen Zhang, Qifeng Guo and Junhao Lin et al., who participated in the SRP program of South China University of Technology. Linxun Lu, a graduate student of Sun Yat-Sen University, participated in some early experiments. Qian Zhang helped do more experiments in the revision process. This work was financially supported by National Science Foundation of China (Grant No.: 10874047) and SRP program (Grant No.: x2lx-y1080360) of South China University of Technology.References
- M. Rawat, M. C. Z. Moturi and V. Subramanian, Inventory compilation and distribution of heavy metals in wastewater from small-scale industrial areas of Delhi, India, J. Environ. Monit., 2003, 5, 906–912 RSC.
- J. V. Rios-Arana, E. J. Walsh and J. L. Gardear-Torresdey, Assessment of arsenic and heavy metal concentrations in water and sediments of the Rio Grande at El Paso–Juarez metroplex region, Environ. Int., 2003, 29, 957–971.
- X. Kong, Q. Jia and W. Zhou, Coupling on-line preconcentration by ion-exchange with microwave plasma torch-atomic emission spectrometry for the determination of cobalt and nickel, Microchem. J., 2007, 87, 132–138 CrossRef CAS.
- J. Riondato, F. Vanhaecke, L. Moens and R. Dams, Fast and reliable determination of (ultra-)trace and/or spectrally interfered elements in water by sector field ICP-MS, J. Anal. At. Spectrom., 2000, 15, 341–345 RSC.
- W. Yantasee, K. Hongsirikarn, C. L. Warner, D. Choi, T. Sangvanich, M. B. Toloczko, M. G. Warner, G. E. Fryxell, R. S. Addleman and C. Timchalk, Direct detection of Pb in urine and Cd, Pb, Cu, and Ag in natural waters using electrochemical sensors immobilized with DMSA functionalized magnetic nanoparticles, Analyst, 2008, 133, 348–355 RSC.
- R. D. Riso, M. Waeles, P. Monbet and C. J. Chaumery, Measurements of trace concentrations of mercury in sea water by stripping chronopotentiometry with gold disk electrode: influence of copper, Anal. Chim. Acta, 2000, 410, 97–105 CrossRef CAS.
- M. L. Tercier-Waeber, F. Confalonieri, M. Koudelka-Hep, J. Dessureault- Rompré, F. Graziottin and J. Buffle, Gel-integrated voltammetric microsensors and submersible probes as reliable tools for environmental trace metal analysis and speciation, Electroanalysis, 2008, 20, 240–258 CrossRef CAS.
- S. B. Hocevar, I. Švancara, B. Ogorevc and K. Vytřas, Antimony film electrode for electrochemical stripping analysis, Anal. Chem., 2007, 79, 8639–8643 CrossRef CAS.
- E. M. Ali, Y. Zheng, H. Yu and J. Y. Ying, Ultrasensitive Pb2+ detection by glutathione-capped quantum dots, Anal. Chem., 2007, 79, 9452–9458 CrossRef CAS.
- C. Chang, C. Huang, C. Liu and H. Chang, Oligonucleotide-based fluorescence probe for sensitive and selective detection of mercury(II) in aqueous solution, Anal. Chem., 2008, 80, 3716–3721 CrossRef CAS.
- J. Ueberfeld, N. Parthasarathy, H. Zbinden, N. Gisin and J. Buffle, Coupling fiber optics to a permeation liquid membrane for heavy metal sensor development, Anal. Chem., 2002, 74, 664–670 CrossRef CAS.
- T. Shtoyko, A. T. Maghasi, J. N. Richardson, C. J. Seliskar and W. R. Heineman, Spectroelectrochemical sensing based on attenuated total internal reflectance stripping voltammetry. 1. Determination of lead and cadmium, Anal. Chem., 2003, 75, 4585–4590 CrossRef CAS.
- A. Ritschel, P. Wobrauschek, E. Chinea, F. Grass and C. Fabjan, An electrochemical enrichment procedure for the determination of heavy metals by total-reflection X-ray fluorescence spectroscopy, Spectrochim. Acta, Part B, 1999, 54, 1449–1454 CrossRef.
- R. Sitko, B. Zawisza and Z. Mzyk, Chemofiltration of mercury water samples through zinc sulfide layer and determination by wavelength-dispersive X-ray fluorescence spectrometry, J. Anal. At. Spectrom., 2006, 21, 13–18 RSC.
- P. Mezei and T. Cserfalvi, Electrolyte cathode atmospheric glow discharges for direct solution analysis, Appl. Spectrosc. Rev., 2007, 42, 573–604 CrossRef CAS.
- G. J. Batterham, N. C. Munksgaard and D. L. Parry, Determination of trace metals in sea-water by inductively coupled plasma mass spectrometry after off-line dithiocarbamate solvent extraction, J. Anal. At. Spectrom., 1997, 12, 1277–1280 RSC.
- T. Tanaka, Y. Ando, T. Saitoh and M. Hiraide, Preconcentration of traces of cobalt, nickel, copper and lead in water by thermoresponsive polymer-mediated extraction for tungsten filament electrothermal vaporization-inductively coupled plasma mass spectrometry, J. Anal. At. Spectrom., 2002, 17, 1556–1559 RSC.
- E. Castillo, J. L. Cortina, J. L. Beltran, M. D. Prat and M. Granados, Simultaneous determination of Cd(II), Cu(II) and Pb(II) in surface waters by solid phase extraction and flow injection analysis with spectrophotometric detection, Analyst, 2001, 126, 1149–1153 RSC.
- K. T. Jiann and B. J. Presley, Preservation and determination of trace metal partitioning in river water by a two-column ion exchange method, Anal. Chem., 2002, 74, 4716–4724 CrossRef CAS.
- K. H. Lee, M. Oshima and S. Motomizu, Inductively coupled plasma mass spectrometric determination of heavy metals in sea-water samples after pre-treatment with a chelating resin disk by an on-line flow injection method, Analyst, 2002, 127, 769–774 RSC.
- H. Karami, M. F. Mousavi, Y. Yamini and M. Shamsipur, On-line preconcentration and simultaneous determination of heavy metal ions by inductively coupled plasma-atomic emission spectrometry, Anal. Chim. Acta, 2004, 509, 89–94 CrossRef CAS.
- H. J. Chang, Y. H. Sung and S. D. Huang, Determination of ultra-trace amounts of cadmium, cobalt and nickel in sea-water by electrothermal atomic absorption spectrometry with on-line preconcentration, Analyst, 1999, 124, 1695–1699 RSC.
- P. Ugo, S. Zampieri, L. M. Moretto and D. Paolucci, Determination of mercury in process and lagoon waters by inductively coupled plasma-mass spectrometric analysis after electrochemical preconcentration: comparison with anodic stripping at gold and polymer coated electrodes, Anal. Chim. Acta, 2001, 434, 291–300 CrossRef CAS.
- A. A. Olajire, A survey of heavy metal deposition in Nigeria using the moss monitoring method, Environ. Int., 1998, 24, 951–958 CrossRef CAS.
- M. H. Devier, S. Augagneur, H. Budzinski, K. L. Menach, P. Mora, J. F. Narbonne and P. Garrigues, One-year monitoring survey of organic compounds (PAHs, PCBs, TBT), heavy metals and biomarkers in blue mussels from the Arcachon Bay, France, J. Environ. Monit., 2005, 7, 224–240 RSC.
- A. M. Zou, M. L. Chen, Y. Shu, M. Yang and J. H. Wang, Biological cell-sorption for separation/preconcentration of ultra-trace cadmium in a sequential injection system with detection by electrothermal atomic absorption spectrometry, J. Anal. At. Spectrom., 2007, 22, 392–398 RSC.
- Z. Birungi, B. Masola, M. F. Zaranyika, I. Naigaga and B. Marshall, Active biomonitoring of trace heavy metals using fish (Oreochromis niloticus) as bioindicator species. The case of Nakivubo wetland along Lake Victoria, Physics and Chemistry of the Earth, 2007, 32, 1350–1358 Search PubMed.
- Z. Chen, H. Li, M. Liu and R. Li, Fast and sensitive trace metal analysis in aqueous solutions by laser-induced breakdown spectroscopy using wood slice substrates, Spectrochim. Acta, Part B, 2008, 63, 64–68 CrossRef.
- P. Yaroshchyk, R. J. S. Morrison, D. Body and B. L. Chadwick, Quantitative determination of wear metals in engine oils using LIBS: The use of paper substrates and a comparison between single- and double-pulse LIBS, Spectrochim. Acta, Part B, 2005, 60, 1482–1485 CrossRef.
- R. L. Vander Wal, T. M. Ticich, J. R. West and P. A. Householder, Trace metal detection by laser-induced breakdown spectroscopy, Appl. Spectrosc., 1999, 53, 1226–1236 CrossRef CAS.
- D. M. Díaz Pace, C. A. D'Angelo, D. Bertuccelli and G. Bertuccelli, Analysis of heavy metals in liquids using Laser Induced Breakdown Spectroscopy by liquid-to-solid matrix conversion, Spectrochim. Acta, Part B, 2006, 61, 929–933 CrossRef.
- M. Lawrence-Snyder, J. Scaffidi, S. M. Angel, A. P. M. Michel and A. D. Chave, Sequential-pulse laser-induced breakdown spectroscopy of high-pressure bulk aqueous solutions, Appl. Spectrosc., 2007, 61, 171–176 CrossRef CAS.
- V. I. Babushok, F. C. DeLucia Jr., J. L. Gottfried, C. A. Munson and A. W. Miziolek, Double pulse laser ablation and plasma: Laser induced breakdown spectroscopy signal enhancement, Spectrochim. Acta, Part B, 2006, 61, 999–1014 CrossRef.
- Z. Chen, H. Li, F. Zhao and R. Li, Ultra-sensitive trace metal analysis of water by laser-induced breakdown spectroscopy after electrical-deposition of the analytes on an aluminium surface, J. Anal. At. Spectrom., 2008, 23, 871–875 RSC.
- C. Aragón, J. A. Aguilera and F. Peñalba, Improvements in quantitative analysis of steel composition by laser-induced breakdown spectroscopy at atmospheric pressure using an infrared Nd:YAG laser, Appl. Spectrosc., 1999, 53, 1259–1267 CAS.
Footnote |
| † Present address: National Astronomical Observatories, Chinese Academy of Sciences, Beijing 100012. |
| This journal is © The Royal Society of Chemistry 2010 |
