Application of dispersive liquid–liquid microextraction combined with sweeping micellar electrokinetic chromatography for trace analysis of six carbamate pesticides in apples
Shuaihua
Zhang
,
Chao
Li
,
Shuangju
Song
,
Tao
Feng
,
Chun
Wang
and
Zhi
Wang
*
Key Laboratory of Bioinorganic Chemistry, College of Science, Agricultural University of Hebei, Baoding, 071001, Hebei, China. E-mail: wangzhi@hebau.edu.cn; Fax: +86 312-7521513; Tel: +86 312-7521513
First published on 23rd November 2009
Abstract
A rapid and sensitive method for the multiresidue analysis of six commonly used carbamate pesticides in apples was developed by using dispersive liquid–liquid microextraction (DLLME) coupled with sweeping micellar electrokinetic chromatography (MEKC). Parameters that affect the extraction and sweeping efficiency, such as the kind and volume of the extraction and disperser solvent, extraction time, salt addition, sample matrix and concentration of organic modifiers in the separation buffer were investigated and optimized. Under optimized conditions, the enrichment factors were achieved in the range from 491 to 1834. The linearity of the method for methiocarb, diethofencarb, carbaryl and isoprocarb was in the range of 6–500 ng g−1, and for fenobcarb and tsumacide in the range of 9–500 ng g−1, with the correlation coefficients (r) ranging from 0.9952 to 0.9990. The limits of detection (LODs) at a signal-to-noise ratio of 3 ranged from 2.0 to 3.0 ng g−1. The recoveries of the six carbamates for apple samples at spiking levels of 20.0 and 100.0 ng g−1 were 85.5–108.1% and 85.4–113.3%, respectively. The proposed method has been successfully applied to the analysis of the target carbamate residues in apple samples with satisfactory results.
Introduction
Carbamates comprise an important class of highly effective commercial pesticides widely used as insecticides, fungicides, nematocides, miticides, and molluscicides for the protection of a large variety of crops. They are increasingly used instead of organochlorine and organophosphorus pesticides due to their broad spectrum of activity, low environmental persistence and generally low mammalian toxicity. However, they are suspected carcinogens and mutagens since they are acetylcholinesterase inhibitors, which is the enzyme responsible for the hydrolysis of acetylcholine.1 Their residues are often distributed in aqueous food such as fruits and vegetables because of their high solubility in water. The widespread use of carbamates in agriculture has led to an increase in their presence in these products. Therefore, evaluation and monitoring of trace levels of these pesticides in food samples is of great importance and demands efficient, selective and sensitive analytical techniques.A variety of chromatographic methods for the determination of carbamate pesticides exist. Gas chromatography (GC)2–4 and high performance liquid chromatography (HPLC)5–10 are still the main analytical tools for this purpose. However, since many of these compounds are polar, nonvolatile, and thermally labile, they often need to be derivatized before chromatographic analysis when GC is used. More recently, capillary electrophoresis (CE), because of its high separation efficiencies, short analysis time, small sample requirements and low operation cost, has also been used for pesticide residue analysis.11 However, the main drawback of CE is the low concentration sensitivity due to the small injection volume and short optical path in most commonly used UV detection. This problem has prevented CE from being more widely used in pesticide analysis. One solution to these problems is to apply off-line and /or on-line sample concentration methods. Several on-line preconcentration strategies, with the advantages of simplicity and economy, have been developed to increase the sensitivity of CE.12–16 One of these preconcentration techniques was first introduced by Quirino and Terabe12 and is referred to as sweeping. It consists of the introduction of a large sample zone prepared in a matrix devoid of pseudostationary phase, wherein the analytes are picked-up and accumulated by the pseudostationary phase that penetrates the sample. This technique has been successfully applied for the on-line preconcentration of aromatic amines,17,18 phenoxy acid herbicides,19 quaternary ammonium herbicides,20 triazine herbicides,21–23 phenolic compounds,24,25 and various pesticides.11,22
For off-line concentration methods, several sample preparation methods have been developed for the determination of carbamate pesticides, including liquid–liquid extraction (LLE),5 solid-phase extraction (SPE),6 supercritical fluid extraction (SFE),7 microwave-assisted extraction (MAE),7,8 solid-phase microextraction (SPME)9 and liquid-phase microextraction (LPME).2,4 Recently, liquid-phase microextraction (LPME) has emerged as a new attractive alternative for sample preparation because of its simplicity, effectiveness, low cost, and small volume of organic solvents consumed. Different configurations of this technique have been reported, including single-drop liquid-phase microextraction (SDME)2 and hollow fiber-based liquid-phase microextraction (HF-LPME).4 However, some disadvantages exist in these methods: fast stirring speed tends to break up the organic drop;26 air bubbles are sometimes formed in SDME or HF-LPME;27 extraction is time-consuming and equilibrium could not be attained even after a long time extraction in most cases in LPME.28
Dispersive liquid–liquid microextraction (DLLME), which was first reported by Assadi and co-workers in 2006,29 can overcome some of above-mentioned limitations with the advantages of simplicity of operation, rapidity, low cost, high recovery, and high enrichment factor. In the method, the extraction solvent and disperser solvent are rapidly injected into the aqueous sample by syringe. The mixture is then gently shaken and a cloudy solution containing fine droplets of extraction solvent dispersed entirely in the aqueous phase is formed. The analytes in the sample are extracted into the fine droplets, which are further separated by centrifugation, and the enriched analytes in the sedimented phase are determined by either chromatographic or spectrometric methods. The performance of DLLME has been demonstrated in the determination of a variety of trace organic pollutants in environmental samples, especially in water samples, by using gas chromatography or liquid chromatography.29–34 However, until now, there are very few literatures reporting about the applications of DLLME in combination with capillary electrophoresis (DLLME-CE) for the analysis of organic pollutants in real samples. Therefore, the exploration of the potential applications of the DLLME technique for the analysis of more complex matrix samples, such as soil and food, especially in combination with CE, is very desirable.
In this work, a DLLME procedure coupled with sweeping MEKC has been developed for the simultaneous determination of six carbamate pesticides (methiocarb, fenobcarb, diethofencarb, carbaryl, isoprocarb and tsumacide) in apples. The effects of some important experimental parameters that influence the DLLME and sweeping efficiency were studied. To the best of our knowledge, this may be the first report about the application of the combination of DLLME with sweeping MEKC for the determination of these pesticides in real fruit samples.
Experimental
Reagents, chemicals and materials
Carbamates (methiocarb, fenobcarb, diethofencarb, carbaryl, isoprocarb and tsumacide) were purchased from Agricultural Environmental Protection Institution (Tianjin, China). The individual stock solutions were prepared in methanol at a concentration of 20.0 μg mL−1 and stored in glass-stopper bottles at 4 °C. The mixed standard solution containing 20.0 μg mL−1 of each carbamate was prepared in methanol. Standard working solutions at various concentrations were prepared daily by an appropriate dilution of the stock solutions with double-distilled water after dryness under a stream of nitrogen.All chemicals were of analytical reagent grade. Sodium dodecyl sulfate (SDS) was purchased from Sigma-Aldrich (St. Louis, MO, USA). Dichloromethane (CH2Cl2), chloroform (CHCl3), carbon tetrachloride (CCl4), bromobenzene (C6H5Br) and chlorobenzene (C6H5Cl) were purchased from Beijing Chemical Reagents Company (Beijing, China). All the solvents were sonicated and filtered through 0.45 μm filter purchased from Tianjin Automatic Science Instrument Co. (Tianjin, China) prior to use. Apple samples were obtained from local supermarkets.
Apparatus
All CE experiments were performed on a Beckman P/ACE MDQ Capillary Electrophoresis System (Beckman Coulter, Fullerton, CA, USA), equipped with an auto sampler and a diode array detector (DAD). An uncoated fused-silica capillary (Yongnian Ruifeng Optical Fiber Factory, Hebei, China) of 50 cm (effective length, 40 cm) × 75 μm i.d was used throughout the experiments. The DAD was set at 200 nm for detection utilizing an 800 μm × 100 μm aperture to maximize sensitivity. All of the operations were computer-controlled using Beckman P/ACE MDQ software.Sample preparation
An apple sample (ca. 20.0 g) was chopped in a food chopper, then homogenized by using a food homogenizer and subsequently centrifuged at 5000 rpm for 10 min. The supernatant was transferred to a Büchner funnel and filtrated twice under reduced pressure. The filtrate was diluted to 25.0 mL with doubly distilled water. A 5.00 mL aliquot of the above sample solution was placed in a 10 mL screw cap glass tube with conic bottom and centrifuged at 5000 rpm for 10 min. The supernatant was then transferred to another similar tube and 1 mL of acetone (as disperser solvent) containing 60 μL of chloroform (as extraction solvent) was rapidly added into the sample solution. Then, the mixture was shaken by hand for 1 min. A cloudy solution that consisted of very fine droplets of CHCl3 dispersed into aqueous sample was formed, and the analytes were extracted into the fine droplets. After centrifugation at 5000 rpm for 5.0 min, the chloroform phase was sedimented at the bottom of the centrifuge tube. The sedimented phase was completely transferred to another test tube with conical bottom using a 100 μL microsyringe and then evaporated to dryness with a mild nitrogen stream, and then dissolved with 20 μL of double-distilled water for CE analysis.General electrophoresis procedure
The capillary was conditioned prior to use with 0.1 M NaOH for 10 min at 20 psi, followed with purified water for 5 min, and finally with the background solution (BGS) for 5 min. To ensure repeatability, the capillary was flushed between consecutive analyses with 0.1 M NaOH for 3 min at 20 psi, then with purified water for 3 min, and finally with the BGS for 5 min.For sweeping, sample was prepared in water. The BGS (3.64 mS cm−1) was 10 mM H3PO4 (pH 2.5) containing 50 mM SDS and 25% methanol for the experiments. The sample water solution (< 2.0 μS cm−1) was introduced into the capillary by hydrodynamic injection at 0.5 psi for 240 s from the cathode end of the capillary. Electrophoresis was performed at a constant voltage of −20 kV at 20 °C, with diode array detection at 200 nm. The identification of the six carbamates was made by both their migration times and ultraviolet absorption spectra by DAD detection. The peak areas of each analyte was used for quantification.
Calculation of enrichment factors
For DLLME, the terms of the enrichment factor (EF) and extraction recovery (R%) were used according to eqn (1) and (2) as follows:28–30 | (1) |
 | (2) |
For sweeping, the sensitivity enhancement factor (EFSM) in terms of peak height was calculated according to the following equation:14,15
| EFSM = (Hsweeping-MEKC/Hnormal injection) × γsample concentration dilution factor | (3) |
For the combination of the DLLME with sweeping-MEKC in this work, the sensitivity enhancement factor (EFDSM) in terms of peak height was achieved according to the following equation:
| EFDSM = (HDLLME-sweeping-MEKC/Hnormal injection) × γsample concentration dilution factor | (4) |
Results and discussion
Optimization of the sweeping conditions
Sweeping is an on-line sample concentration technique in MEKC. It occurs when the sample matrix is prepared in a buffer solution with conductivity that is similar, lower or higher than BGS and without adding pseudostationary phase (micelles). When charged micelles in BGS penetrate the sample zone during the application of voltage, picking or accumulation of the analytes occurs due to partitioning or interaction of analytes with the micelles. Therefore, the analytes zones are narrowed due to a partitioning mechanism as the sample molecules are incorporated into the micelles phase.In this experiment, two millilitres aqueous solution containing 10.0 μg mL−1 each of carbamate pesticides was used to study the sweeping performance under different experimental conditions, such as sample matrix, buffer concentration, buffer pH, SDS concentration, organic solvent content, and injection time.
Effect of the buffer and SDS concentration
Buffer concentration has a significant effect on the separation performance because it can influence the Joule heating, the electro-osmotic flow (EOF), ionic strength, and the current produced in the capillary. Phosphoric acid, the most commonly used buffer system in CE at low pH, was chosen as the running buffer in this work. To obtain the best separation of the six pesticides, the influence of the H3PO4 concentration on the separation was tested by keeping a constant SDS concentration of 50 mM and changing the concentration of H3PO4 to 5, 10, 25, 50, and 100 mM, respectively, The result demonstrated that with increased concentration of H3PO4, the migration time was decreased, and the resolution of the analytes slightly decreased before 50 mM. On the other hand, high H3PO4 concentrations had a negative effect on the detection limits because when the concentration of H3PO4 was increased, the effect of Joule heat became more pronounced, which could cause an increased baseline noise. As a result, 10 mM H3PO4 was selected for subsequent investigations.To explore the effect of SDS concentration, a series of buffer solutions containing 25, 50, 75, 100, and 150 mM SDS, respectively, were examined. The result indicated that the theoretical plate numbers (N) of the peaks were increased and migration time decreased with increased SDS concentration before 50 mM, and at SDS concentrations of above 50 mM, the theoretical plate number was almost the same. Therefore, 50 mM SDS was selected for further studies.
Effect of the buffer pH
The acidity of the running buffer affects the zeta-potential (ζ), the EOF, as well as the overall charge of the analytes, and therefore, will influence the migration time and separation efficiency of the analytes. With negative polarity at low pH, the migration direction of both the EOF and the analytes was opposite to that of the SDS micelles. Since the electrophoretic velocity of SDS was greater than the EOF, the analytes were brought to the detector with the aid of the SDS micelles. In this study, the running buffers of 10 mM H3PO4 containing 50 mM SDS and 25% methanol at five different pH values (1.5, 2.0, 2.5, 3.0, 3.5 and 4.0) were examined for the optimization of the buffer pH. It was found that the migration time of the analytes was increased when pH was increased; the baseline separations with good peak shapes could be achieved at pHs between 2.0 and 3.0, but the separation for the analytes was poor at pH 1.5. The peak of tsumacide was broadened when pH was higher than 3.0. Consequently, pH 2.5 was chosen for further optimizations.Effect of organic modifier concentration
The addition of organic additives, such as acetonitrile or methanol, in the buffer could influence both resolution and theoretical plate number because they could cause a difference in affinity between micelles and analytes. In our experiments, the effect of methanol concentration was investigated by changing its concentration to 5, 10, 15, 20, 25 and 30% (v/v), respectively. When the methanol concentration was increased, the resolutions between the analytes were improved but with increased migration time. Giving an overall consideration of both resolution and migration time, 25% of methanol was selected for the experiment.Choice of sample matrix
In the early work of sweeping, the conductivity of the sample zone was usually adjusted to be nearly equal to that of the running micellar solution but no micelle was added to the sample solution. Therefore, homogeneous electric field strength was assumed throughout the whole capillary under sweeping conditions, which is different from field-enhanced stacking techniques.13,35 Later, Palmer et al. reported that the sample solution with a conductivity of two to three times greater than that of BGS and devoid of the micelle, improved the focusing effect in MEKC.36 Quirino et al. in their later work also showed that the sample matrix could have a lower, similar, or higher conductance than the separation solution.37To examine the influence of sample solution on the separation of the analytes, the sample was dissolved in solutions containing either 10 mM (2.25 mS cm−1), 20 mM (3.71 mS cm−1), 50 mM (5.80 mS cm−1), 100 mM (11.81 mS cm−1) phosphoric acid, or double-distilled water (< 2.0 μS cm−1), respectively. As is shown in Fig. 1, with increased phosphoric acid concentration, the peaks became broadened, especially for tsumacide, and double-distilled water gave the best separation efficiency although the migration time was prolonged. This result is in agreement with those reported by Quirino et al.37,38 Therefore, double-distilled water, which had the 103 times lower conductivity than that of the BGS (3.64 mS cm−1), was used for the preparation of the sample.
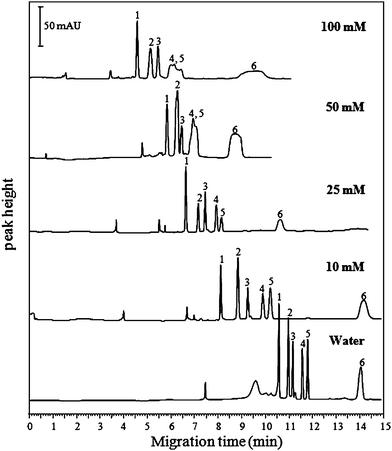 | ||
| Fig. 1 Effect of the phosphoric acid concentration in sample matrix on the separation of the pesticides. Conditions: BGS, 10 mM H3PO4 containing 50 mM SDS and 25% methanol at pH 2.5. Voltage, −20 kV; Temperature, 20 °C; DAD detection, 200 nm; Injection, 0.5 psi, 240 s. Peak identifications: 1 methiocarb, 2 fenobcarb, 3 diethofencarb, 4 carbaryl, 5 isoprocarb, and 6 tsumacide. | ||
Effect of injection time
The effect of injection time on the enrichment of the analytes was investigated by changing the sampling time from 5 to 10, 60, 120, 240, and 360 s at 0.5 psi, corresponding to the injection length of 0.6, 1.2, 7.3, 14.6, 29.3, and 43.9 cm, respectively. As a result, with increased injection time, the concentration factor increased but the resolution between the analytes was decreased. When injection time exceeded 360 s, the peak broadening became more pronounced. Giving an overall consideration of both resolution and sensitivity, the sampling time of 240 s at 0.5 psi (29.3 cm, 58.4% of the capillary length) was selected.Based on the above optimizations, the optimal experimental conditions for sweeping MEKC were selected as follows: BGS was 10 mM phosphate at pH 2.5 containing 50 mM SDS and 25% methanol; sample was prepared in double-distilled water; sample injection was performed at 0.5 psi for 240 s. Under these optimized conditions, the sensitivity enhancement factors (EFSM) of the sweeping MEKC for the pesticides were between 7.1 and 12.4.
Optimization of DLLME
In order to optimize the DLLME procedure, 5.0 mL double-distilled water spiked with 100 ng mL−1 each of the six carbamate pesticides was used to study the extraction performance of the DLLME under different experimental conditions. All experiments were performed in triplicate, and the means of the results were used for optimization.Selection of extraction solvent
The selection of an appropriate extraction solvent is crucial for the DLLME process. The extraction solvent has to meet some requirements. It should have a higher density than water, a low solubility in water, and high extraction capability for the target analytes, and should form a stable two-phase system in the presence of a dispersive solvent when injected to an aqueous solution. Generally, the solvents with density higher than water are mainly halogenated hydrocarbons. In this study, six extraction solvents including carbon tetrachloride (CCl4), chloroform (CHCl3), dichloroethane (C2H4Cl2), dichloromethane (CH2Cl2), bromobenzene (C6H5Br), and chlorobenzene (C6H5Cl) were investigated for the extraction. For CH2Cl2 and C2H4Cl2, a two-phase system was not observed with any dispersive solvent studied. Fig. 2 shows the effect of the extraction solvents (CCl4, CHCl3, C6H5Br and C6H5Cl) on the extraction recovery with acetone as dispersive solvent. As can be seen from Fig. 2, CHCl3 gives the highest extraction efficiency for all the pesticides investigated. Therefore CHCl3 was selected as the extraction solvent.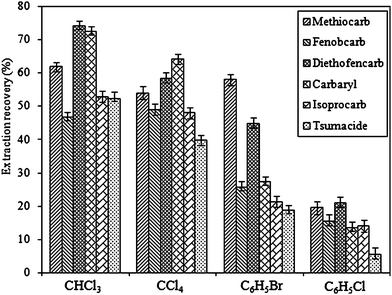 | ||
| Fig. 2 Effect of different extraction solvents on the extraction recovery of the carbamates. Extraction conditions: sample volume, 5.0 mL; dispersive solvent, 1.0 mL acetone; extraction solvent volume, 50 μL. | ||
Selection of disperser solvent
For DLLME method, the disperser solvent should be miscible with both water and the extraction solvent. In this study, acetone, acetonitrile and tetrahydrofuran were selected as the disperser solvent, and the effect of these solvents on the performance of DLLME was investigated. Fig. 3 shows that the best extraction recoveries were achieved when acetone was used as a disperser solvent. Consequently, acetone was selected for the experiments.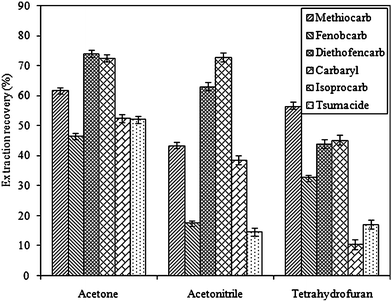 | ||
| Fig. 3 Effect of different dispersive solvents on the extraction recovery of the carbamates. Extraction conditions: sample volume, 5.0 mL; dispersive solvent volume, 1.0 mL; extraction solvent, 50 μL CHCl3. | ||
Effect of extraction solvent volume
To study the effect of the extraction solvent volume on the performance of the presented DLLME procedure, different volumes of CHCl3 (40.0, 50.0, 60.0, 70.0, and 80.0 μL) with a constant volume of the disperser solvent acetone (1.0 mL) were investigated. Fig. 4 illustrates the extraction recovery versus the volume of the extraction solvent (CHCl3). It was observed that the extraction recovery was increased with increased volume of CHCl3 from 20 to 60 μL; after that, the extraction recoveries remained almost constant for methiocarb and isoprocarb, but decreased for fenobcarb, diethofencarb, carbaryl and tsumacide by increasing the volume of CHCl3. Thereby, 60 μL of CHCl3 was selected.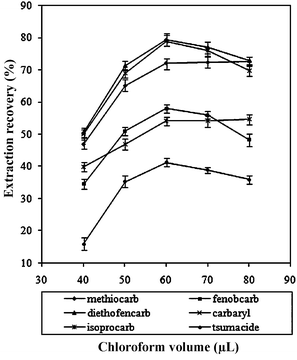 | ||
| Fig. 4 Effect of the extraction solvent (CHCl3) volume on the extraction recovery of the carbamates. Extraction conditions: sample volume, 5.0 mL; dispersive solvent, 1.0 mL acetone; extraction solvent, CHCl3. | ||
Effect of disperser solvent volume
The influence of the volume of the disperser solvent acetone was investigated by changing its volume to 0.5, 1.0, 1.5 and 2.0 mL, respectively. The results (Fig. 5) indicate that with increased volume of acetone, the extraction efficiency was increased first, and then decreased for all the six pesticides. The reason could be that at a low volume of acetone, a cloudy state was not formed well, thus giving a low recovery; at a higher volume of acetone, the solubility of the pesticides in water was increased, leading to decreased extraction efficiency because of a decrease in distribution coefficient. Based on the experimental results in Fig. 5, 1.0 mL of acetone was chosen.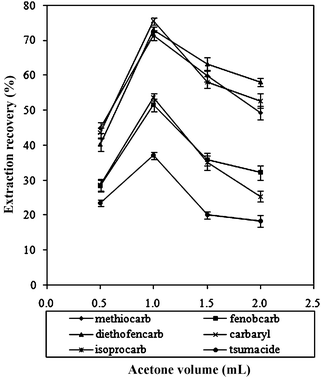 | ||
| Fig. 5 Effect of the dispersive solvent (acetone) volume on the extraction recovery of the carbamates. Extraction conditions: sample volume, 5.0 mL; extraction solvent, 60 μL CHCl3. | ||
Effect of extraction time
In DLLME, extraction time is defined as the interval between the addition of the mixture of the extraction solvent (CHCl3) and dispersive solvent (acetone) to the sample and the start of centrifugation. The effect of the extraction time was studied over the time range from 1 to 40 min with constant experimental conditions, and the results showed that the extraction time has no remarkable impact on the extraction recoveries. It is revealed that the DLLME method is time-independent. The reason for this is that there is an infinitely large surface area between extraction solvent and aqueous phase after the formation of cloudy solution. This could lead to a very fast transition of the analytes from aqueous phase to extraction solvent, and therefore the equilibrium state can be achieved very quickly. The short extraction time is one of the big advantages of the DLLME technique. In this experiment, shaking the solution by hands for 1 min was adopted.Effect of ionic strength
The influence of ionic strength on the performance of DLLME was investigated by adding different amounts of NaCl (0–5%, w/v). The results exhibited that the salt addition of 0–5% (w/v) had no significant effect on the extraction recoveries. However, the enrichment factor was slightly decreased. Therefore, no salt was added in all the subsequent experiments.Under the above optimized experimental conditions, the DLLME enrichment factors for the six pesticides were ranged from 74 to 151, respectively.
Sensitivity enhancement of the combination of the DLLME with sweeping-MEKC
A comparison of the conventional MEKC, sweeping MEKC and the proposed DLLME-sweeping MEKC method is demonstrated in the electropherograms in Fig. 6. Table 1 summarizes and compares the enrichment factors for DLLME alone, sweeping MEKC alone, and the combination technique of DLLME with sweeping MEKC, respectively. Compared with the sensitivity obtained with normal hydrodynamic sample injection (0.5 psi, 5 s), the DLLME-sweeping MEKC method provided about 500- to 1800-fold sensitivity enhancement without obvious loss of resolution. The above results demonstrated that the proposed DLLME-sweeping MEKC indeed markedly improved the detection sensitivity compared with conventional MEKC.| Pesticides | DLLME | Sweeping-MEKC | DLLME-Sweeping-MEKC | |||
|---|---|---|---|---|---|---|
| EF | %RSD | EFSM | %RSD | EFDSM | %RSD | |
| Methiocarb | 143 | 4.3 | 10.1 | 3.4 | 1401 | 3.3 |
| Fenobcarb | 103 | 5.0 | 8.7 | 5.2 | 872 | 4.6 |
| Diethofencarb | 146 | 4.1 | 12.4 | 4.7 | 1834 | 5.6 |
| Carbaryl | 151 | 4.6 | 10.9 | 3.8 | 1558 | 7.2 |
| Isoprocarb | 101 | 5.9 | 9.9 | 1.7 | 957 | 6.3 |
| Tsumacide | 74 | 6.3 | 7.1 | 3.1 | 491 | 5.9 |
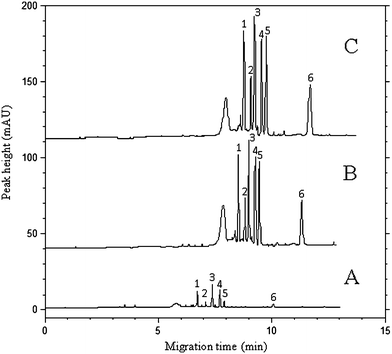 | ||
| Fig. 6 Comparison of the electropherograms obtained by conventional MEKC method (A), the sweeping MEKC method without DLLME (B), and the combination of DLLME with sweeping MEKC method (C). (A) Sample: 10 μg mL−1 standard solution of each pesticide prepared in BGS; injection at 0.5 psi for 5 s. (B) Sample: 10 μg mL−1 in double-distilled water; injection at 0.5 psi for 240 s. (C) Sample: 0.1 μg mL−1 in double-distilled water; after DLLME, injection at 0.5 psi for 240 s. Separation conditions are the same as described in the experimental section. Peak identifications are the same as in Fig. 1. | ||
Method evaluation
20.0 g of homogenized apple sample, which was free of carbamate pesticides, was accurately weighed and put into a 50 mL centrifuge tube. An appropriate amount of mixture standard solution of the target analytes was added into it. A series of working samples containing each of methiocarb, fenobcarb, diethofencarb, carbaryl, isoprocarb and tsumacide at six concentration levels of 10.0, 20.0, 50.0, 100.0, 200.0 and 500 ng g−1 were obtained for the establishment of the calibration curve. The samples were then prepared and extracted with the DLLME procedures established above as in Section 2.3. For each level, five replicate extractions were performed and the peak areas of each analyte were used as quantification signals. The linear range, correlation coefficients (r), the limits of detection (LODs, S/N = 3) and the limits of quantification (LOQs, S/N = 10) are summarized in Table 2. The LODs were between 2 and 3 ng g−1, and LOQs between 6 and 9 ng g−1, respectively. The signal was linear over the concentration range from their corresponding LOQs to 500 ng g−1 for all the six carbamate pesticides in apples, with the correlation coefficients (r) ranging from 0.9952 to 0.9990. The LOQs for methiocarb, diethofencarb and carbaryl were much lower than the maximum residue limits (MRLs) admitted by the European Union (EU) or by the Codex Alimetarius Commision in fruit and vegetables,39 meaning that the method can satisfy the sensitivity requirements for the analysis of these compounds in fruit and vegetables.| Pesticides | LR/ng g−1 | r | RSD(%) | LODs/ng g−1 | LOQs/ng g−1 | MRLs/μg g−138 | ||
|---|---|---|---|---|---|---|---|---|
| Intraday (n = 5) | Interday (n = 15) | EU-Spain | FAO/WHO | |||||
| a LR: linear range. | ||||||||
| Methiocarb | 6–500 | 0.9990 | 3.2 | 5.7 | 2 | 6 | 0.01–0.2 | 0.05 |
| Fenobcarb | 9–500 | 0.9961 | 4.3 | 7.2 | 3 | 9 | — | — |
| Diethofencarb | 6–500 | 0.9983 | 3.9 | 6.1 | 2 | 6 | 0.05–1 | — |
| Carbaryl | 6–500 | 0.9986 | 3.0 | 5.4 | 2 | 6 | 1–5 | 5–7 |
| Isoprocarb | 6–500 | 0.9952 | 4.6 | 8.3 | 2 | 6 | — | — |
| Tsumacide | 9–500 | 0.9968 | 4.4 | 7.6 | 3 | 9 | — | — |
The intraday (n = 5) and interday (n = 7) RSD values of the migration times by applying this method to apple samples under the same experimental conditions for a whole analysis, were 2.2% and 3.7%, respectively.
Reproducibilities of the proposed DLLME-sweeping-MEKC method was evaluated in terms of intraday and interday precisions, by extracting the spiked apple sample at the concentration of each pesticide at 50.0 ng g−1 in the same day and on the three consecutive days. The results, expressed as the relative standard deviations (RSDs) of peak areas, are presented in Table 2. An acceptable precision was obtained in all cases with intraday RSD values below 4.6% and interday RSD values within 8.3%.
Analysis of pesticide residues in apples
The developed DLLME-sweeping MEKC method was applied to determine the carbamate pesticides in apple samples and three different batches of apples produced at three different regions were analyzed. As a result, only one batch was contaminated by fenobcarb and carbaryl at the concentration of 9.7 and 8.3 ng g−1, respectively. The concentrations of these two pesticides in apples are much lower than the MRLs (0.5 μg g−1 for fenobcarb; 2 μg g−1 for carbaryl) set by Chinese government and therefore the apples are qualified for human consumption in China. The extraction recoveries for six pesticides were performed by spiking apple samples with each pesticide at the concentration of 20 and 100 ng g−1, respectively. The results are presented in Table 3. As can be seen, the recoveries of the method for the analytes are between 85.4% and 113.3% at the concentration levels of 20 and 100 ng g−1, and the RSDs ranged from 4.3% to 7.4%, respectively. Fig. 7 shows the typical chromatograms of the extracted carbamates from apple sample before and after spiking with 20.0 ng g−1 each of the six carbamates.| Pesticides | Spiked/ng g−1 | Found/ng g−1 | Recovery (%) | RSD (%) |
|---|---|---|---|---|
| a : ND = not detected. | ||||
| Methiocarb | 0 | NDa | ||
| 20 | 18.3 | 91.3 | 4.6 | |
| 100 | 88.4 | 88.4 | 6.5 | |
| Fenobcarb | 0 | 9.7 | 5.9 | |
| 20 | 17.1 | 85.5 | 6.3 | |
| 100 | 86.2 | 86.2 | 5.2 | |
| Diethofencarb | 0 | ND | ||
| 20 | 18.7 | 93.5 | 4.3 | |
| 100 | 109.3 | 109.3 | 6.2 | |
| 0 | 8.3 | 6.5 | ||
| Carbaryl | 20 | 21.2 | 106.2 | 6.9 |
| 100 | 85.4 | 85.4 | 5.7 | |
| 0 | ND | |||
| Isoprocarb | 20 | 17.7 | 88.2 | 5.5 |
| 100 | 92.4 | 92.4 | 4.9 | |
| 0 | ND | |||
| Tsumacide | 20 | 21.6 | 108.1 | 7.4 |
| 100 | 113.3 | 113.3 | 6.7 |
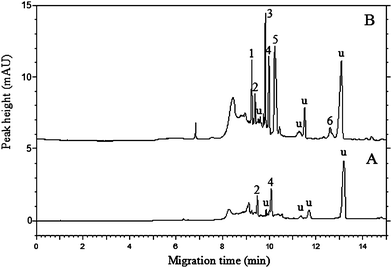 | ||
| Fig. 7 Electropherograms for unspiked (A) and spiked (B) apple samples at 20 ng g−1 of each pesticide obtained by DLLME-sweeping MEKC. The experimental conditions and peak identifications are the same as in Fig. 6, and u represents unidentified peaks. | ||
Comparison of DLLME with other sample preparation techniques
The extraction efficiency of DLLME-sweeping-MEKC method was compared with other reported methods such as HF-LPME4,40 and SPME9,41 from the viewpoint of LODs, RSDs, and extraction time. As listed in Table 4, the present method has comparable LODs and RSDs with other reported extraction methods, but requires much shorter extraction time. SPME and HF-LPME required a longer time for equilibrium to be established. The time to reach equilibrium determines the maximum amounts of the analytes that can be extracted, and therefore affect the sensitivity of the method. Generally, the extraction time for SPME and HF-LPME required about 20–90 min. However, the DLLME method can reach the equilibrium extremely fast due to the large surface areas between the extraction solvent and the aqueous solution. This is the most important advantage of the DLLME. Furthermore, the DLLME process does not require special instrumentation. Although the there is no clean-up effect for DLLME, the chromatograms for apple samples in the current method are sufficiently clean for quantification. Therefore, the current method is indeed simple, rapid, easy to use and environmentally-friendly.| Methods | samples | Linearity | LOD | RSD (%) | Extraction time/min | References |
|---|---|---|---|---|---|---|
| a μg L−1. b ng g−1. | ||||||
| HF-LPME-GC-MS | water | 1–400a | 0.2–0.8a | 4.86–7.81 | 20 | 4 |
| HF-LPME-HPLC-UV | water | 1–1000a | 0.024–0.42a | 1.90–9.53 | 30 | 40 |
| SPME-HPLC-MS | fruit juices | 50–5000a | 5–10b | 1–17 | 90 | 9 |
| In-tube SPME-HPLC | water | 5–10000a | 1a | 1.7–5.3 | — | 41 |
| DLLME-Sweeping-MEKC | apple | 10–500b | 2.0–3.0b | 4.7–6.5 | 1 | This method |
Conclusions
In this work, a new method has been developed for the analysis of six carbamate pesticide residues in apple samples by combining DLLME with on-line preconcentration procedure of sweeping-MEKC. The results demonstrate that the proposed method has high enrichment factors, good recoveries and reproducibility within a short analysis time. The DLLME-sweeping MEKC method has been successfully applied to the analysis of methiocarb, fenobcarb, diethofencarb, carbaryl, isoprocarb and tsumacide in apples, indicating that the proposed method is suitable for the determination of the pesticides in real samples.Acknowledgements
Financial support from both the Natural Science Foundations of Hebei (B2008000210) and the Scientific Research Foundation of Agricultural University of Hebei is gratefully acknowledged.References
- Q. X. Li, B. D. Hammock and J. N. Seiber, J. Agric. Food Chem., 1991, 39, 1537–1544 CrossRef CAS.
- C. López-Blanco, S. Gómez-Álvarez, M. Rey-Garrote, B. Cancho-Grande and J. Simal-Gándara, Anal. Bioanal. Chem., 2005, 383, 557–561 CrossRef CAS.
- E. Crespo-Corral, M. J. Santos-Delgadoa, L. M. Polo-Díeza and A. C. Soriab, J. Chromatogr., A, 2008, 1209, 22–28 CrossRef CAS.
- J. Zhang and H. K. Lee, J. Chromatogr., A, 2006, 1117, 31–37 CrossRef CAS.
- B. Mayer-Helm, L. Hofbauer and J. Muller, Rapid Commun. Mass Spectrom., 2006, 20, 529–536 CrossRef CAS.
- G. Ozhan, S. Ozden and B. Alpertunga, J. Environ.Sci. Health Part B, 2005, 40, 827–840 CrossRef.
- L. Sun and H. K. Lee, J. Chromatogr., A, 2003, 1014, 165–177 CrossRef CAS.
- R. C. Prados-Rosales, M. C. Herrera, J. L. Luque-García and M. D. Luque de Castro, J. Chromatogr., A, 2002, 953, 133–140 CrossRef CAS.
- G. Sagratini, J. Mañes, D. Giardiná, P. Damiani and Y. Picó, J. Chromatogr., A, 2007, 1147, 135–143 CrossRef CAS.
- C. Basheer, A. A. Alnedhary, B. S. Madhava Rao and H. K. Lee, J. Chromatogr., A, 2009, 1216, 211–216 CrossRef CAS.
- A. Juan-García, G. Font and Y. Picó, J. Chromatogr., A, 2007, 1153, 104–113 CrossRef CAS.
- J. P. Quirino and S. Terabe, Science, 1998, 282, 465–468 CrossRef CAS.
- S. L. Simpson Jr, J. P. Quirino and S. Terabe, J. Chromatogr., A, 2008, 1184, 504–541 CrossRef CAS.
- J. B. Kim, K. Otsuka and S. Terabe, J. Chromatogr., A, 2001, 932, 129–137 CrossRef CAS.
- L. Y. Zhu, C. H. Tu and H. K. Lee, Anal. Chem., 2002, 74, 5820–5825 CrossRef CAS.
- A. S. Ptolemy and P. Britz-McKibbin, Analyst, 2008, 133, 1643–1648 RSC.
- J. P. Quirino, Y. Iwai, K. Otsuka and S. Terabe, Electrophoresis, 2000, 21, 2899–2903 CrossRef CAS.
- K. Isoo, K. Otsuka and S. Terabe, Electrophoresis, 2001, 22, 3426–3432 CrossRef CAS.
- J. P. Quirino, S. Terabe, K. Otsuka, J. B. Vincent and Gyula Vigh, J. Chromatogr., A, 1999, 838, 3–10 CrossRef CAS.
- O. Nunez, J. B. Kim, E. Moyano, M. T. Galceran and S. Terabe, J. Chromatogr., A, 2002, 961, 65–75 CrossRef CAS.
- C. E. Lin, Y. C. Liu, T. Y. Yang, T. Z. Wang and C. C. Yang, J. Chromatogr., A, 2001, 916, 239–245 CrossRef CAS.
- C. L. da Silva, E. C. de Lima and M. F. M. Tavares, J. Chromatogr., A, 2003, 1014, 109–116 CrossRef CAS.
- S. H. Zang, Y. Y. Yang, D. D. Han, C. Wang, Z. Zhou, X. H. Zang and Z. Wang, Chin. Chem. Lett., 2007, 18, 316 CrossRef.
- H. Y. Huang, W. C. Lien and I. Y. Huang, Electrophoresis, 2006, 27, 3202–3209 CrossRef CAS.
- M. R. N. Monton, J. P. Quirino, K. Otsuka and S. Terabe, J. Chromatogr., A, 2001, 939, 99–108 CrossRef CAS.
- E. Psillakis and N. Kalogerakis, TrAC, Trends Anal. Chem., 2002, 21, 54–64 CrossRef.
- G. Shen and H. K. Lee, Anal. Chem., 2002, 74, 648–654 CrossRef CAS.
- F. Ahmadi, Y. Assadi, S. M. R. Milani Hosseini and M. Rezaee, J. Chromatogr., A, 2006, 1101, 307–312 CrossRef CAS.
- M. Rezaee, Y. Assadi, M. R. M. Hosseini, E. Aghaee, F. Ahmadi and S. Berijani, J. Chromatogr., A, 2006, 1116, 1–9 CrossRef CAS.
- D. Nagaraju and S. D. Huang, J. Chromatogr., A, 2007, 1161, 89–97 CrossRef CAS.
- P. Liang, J. Xu and Q. Li, Anal. Chim. Acta, 2008, 609, 53–58 CrossRef CAS.
- J. Xiong and B. Hu, J. Chromatogr., A, 2008, 1193, 7–18 CrossRef CAS.
- M. T. Naseri, P. Hemmatkhah, M. R. Milani Hosseini and Y. Assadi, Anal. Chim. Acta, 2008, 610, 135–141 CrossRef.
- Q. H. Wu, C. Wang, Z. M. Liu, C. X. Wu, X. Zeng, J. L. Wen and Z. Wang, J. Chromatogr., A, 2009, 1216, 5504–5510 CrossRef CAS.
- J. P. Quirino and S. Terabe, Anal. Chem., 1999, 71, 1638–1644 CrossRef CAS.
- J. Palmer, N. J. Munro and J. P. Landers, Anal. Chem., 1999, 71, 1679–1687 CrossRef CAS.
- J. P. Quirino, J. B. Kim and S. Terabe, J. Chromatogr., A, 2002, 965, 357–373 CrossRef CAS.
- J. P. Quirino and S. Terabe, J. High Resolut. Chromatogr., 1999, 22, 367–372 CrossRef CAS.
- M. Fernández, Y. Picó and J. Mañes, J. Chromatogr., A, 2000, 871, 43–56 CrossRef CAS.
- K. Hylton and S. Mitra, J. Chromatogr., A, 2007, 1154, 60–65 CrossRef CAS.
- Y. N. Gou, R. Eisert and J. Pawliszyn, J. Chromatogr., A, 2000, 873, 137–147 CrossRef CAS.
| This journal is © The Royal Society of Chemistry 2010 |
