Mechanisms of supported bilayer detection using field-effect devices
Chiho
Kataoka-Hamai
ab and
Yuji
Miyahara
*ab
aBiomaterials Center and International Center for Materials Nanoarchitectonics (MANA), National Institute for Materials Science, Tsukuba, Ibaraki 305-0044, Japan. E-mail: miyahara.yuji@nims.go.jp; Fax: +81 29 860 4714; Tel: +81 29 860 4506
bCREST, Japan Science and Technology Agency, Tokyo, 102-0075, Japan
First published on 18th November 2009
Abstract
The adsorption of positively charged supported lipid bilayers (SLBs) on field-effect devices was studied using various salt solutions to make it possible to understand the signal generation mechanisms of the devices. The flat-band voltage change that occurred with SLB formation was dependent on the type of monovalent cations contained in the solution. Zeta potential data showed that the intrinsic charge of the bilayers was almost constant in the presence of any of the examined alkali ions. The results suggest that the lipid charge does not solely determine the flat-band voltage. The binding affinity of alkali ions to silicon nitride showed a similar trend to the dependence of the flat-band voltage change on alkali ions. The results indicate that the specific interaction of small inorganic ions with the device surface has a significant influence on the magnitude of the signal response that occurs with SLB formation. It appears that salt ions specifically bound to the device surface and the charge of the bilayers both contribute to the signal generation mechanisms.
Introduction
Field-effect devices, which usually have an electrolyte-insulator-semiconductor (EIS) structure, are potentiometric sensors that detect electrostatic potential at an electrolyte-insulator interface. The binding of charged species to sensors modulates the carrier distribution in a semiconductor. This carrier redistribution is measured as changes in the conductivity or capacitance of the semiconductor.1,2 In this work, the capacitive changes were examined by monitoring the flat-band voltage (VFB) of field-effect devices. Recent studies have used different configurations from the conventional simple EIS structures. Examples include diamond, carbon nanotube, and silicon nanowire field-effect transistors.3–5The ability of field-effect devices to detect unlabeled molecules is advantageous as regards their application to biosensors. DNA or RNA hybridization and protein binding have been successfully monitored in previous studies.3,6 The large amount of experimental evidence gained from those studies has established the general consensus that charged biomolecules cause the accumulation or depletion of carriers in semiconductors, resulting in changes in conductance or capacitance. A low ionic strength has to be used to minimize the counterion screening of charged molecules.7 Solution pH can also strongly affect the signal response because protons may associate with the surface sites of devices.4,8–10 Charged biomolecules partially screened by counterions and pH changes have therefore been used as probes for field-effect detection. However, the current knowledge of signal generation mechanisms may be insufficient for a clear understanding of the magnitude of signals. This is because the specific interaction of small inorganic ions with the sensor surface might be involved in the reconstruction of the electrostatic environment during biomolecular binding. Indeed, in the present study we found that the flat-band voltage of devices is not determined solely by the analyte charge, ionic strength, and pH, at least with regards to supported lipid bilayer (SLB) systems. When SLBs with an identical charge were formed on the sensor surface at the same ionic strength and the same pH via vesicle fusion, the flat-band voltage change was significantly affected by the type of monovalent cations contained in the buffer. Unexpectedly, the charge of the SLBs did not account for the up to 1.4-fold signal difference. This motivated us to investigate the roles of small inorganic ions on the SLB detection.
In this work, we examined the effect of salt ions on the flat-band voltage change that we observed with SLB adsorption in order to elucidate the signal generation mechanisms. We used SLBs consisting of 1,2-dioleoyl-3-trimethylammonium-propane, chloride salt (DOTAP) since our previous studies showed that cationic DOTAP vesicles readily fuse to form SLBs on an anionic device surface and these SLBs yield a large shift in the flat-band voltage.11 Here we propose detection mechanisms in which the lipid charge and the specific adsorption of salt ions on the sensor surface both affect the device signals.
Experimental
Formation of supported bilayers
Supported bilayers were formed via vesicle fusion.12 DOTAP was purchased from Avanti Polar Lipids (Alabaster, AL, USA). Large unilamellar vesicles (LUVs, d ∼ 100 nm) were prepared in the desired buffers by extruding DOTAP solutions with a lipid concentration of 2 mM. The lipid concentration was not determined after extrusion. The silicon nitride surface was rinsed three times with acetone and then five times with ethanol, followed by thorough rinsing with water. The surface was then dried in a nitrogen stream, and hydrated in buffer overnight. In flat-band voltage measurements, LUV solutions (∼0.7 mM lipid) were deposited on the hydrated silicon nitride surface and incubated for 10 min. After incubation, the surface was rinsed with large amounts of buffer to remove nonadsorbed lipids. These procedures yielded supported DOTAP bilayers with saturation coverage. The buffer used in all the experiments was 20 mM salt, 10 mM potassium phosphate, pH 7.0. LiCl, NaCl, KCl, RbCl, CsCl, LiBr, and KBr were used as the salts.Atomic force microscopy
Atomic force microscopy (AFM) experiments were performed using an SPI4000/SPA400 (SII NanoTechnology, Tokyo, Japan) and an MFP-3D (Asylum Research, Santa Barbara, CA, USA) in the tapping mode. Silicon nitride cantilevers (k ∼ 1.6 N/m, SI-DF3, SII NanoTechnology, Tokyo, Japan; and k ∼ 0.1 N/m, BL-AC40TS-C2, Olympus, Tokyo, Japan) were used.Flat-band voltage measurements
The flat-band voltage change is generally expressed as ΔVFB = −ΔΨ0, where Ψ0 is the electrical potential of the insulator surface relative to the bulk solution.2,8 The adsorption of charged molecules on devices causes the insulator surface potential to vary, and consequently is detected as a flat-band voltage change.Field-effect devices were fabricated from Si3N4 (40 nm)/SiO2 (30 nm)/p-Si (10 Ω·cm) wafers (Hitachi ULSI Systems, Tokyo, Japan) as described previously.11 Briefly, glass tubes (5.5 mm inner diameter, 10 mm height) were attached to the silicon nitride surface using epoxy resin (ZC-203T, PELNOX, Kanagawa, Japan) to form chambers. Aluminium electrodes were attached to the silicon on the rear of the device using silver paste after the silicon surface had been polished with sandpaper. Epoxy resin was applied to the nitride surface outside the chambers to provide electrical insulation.
The flat-band voltage was determined from the capacitance–voltage (C–V) characteristics using the methods detailed in our previous report.11 Briefly, a reference electrode (Ag/AgCl/KCl(3.3 M)/1% agar salt bridge) was immersed in buffer in the chamber. The reference electrode and the aluminium electrode of the device were then connected to a 4294A precision impedance analyzer (Agilent Technologies, Santa Clara, CA, USA). The measurements were performed under dark conditions to preclude carrier generation by ambient light. To obtain C–V data, a small ac voltage (50 mV, 150 Hz) was superimposed on a dc voltage that was swept from −5 to 3 V. As detailed in our previous report, the flat-band voltage of the substrates that we used corresponds to a dc voltage that yields a capacitance of 0.57Ci where Ci is an accumulation capacitance.11VFB values can therefore be determined from the C–V data. Each VFB value was obtained by averaging 5 or 10 determinations.
When the C–V measurements were conducted for supported DOTAP bilayers (Fig. 1a), a flat-band voltage (VFB(DOTAP)) was obtained before and after the SLB formation. We then calculated the variation (ΔVFB(DOTAP)) by subtracting the value obtained before lipid adsorption from that obtained after adsorption. The definition of ΔVFB(DOTAP) is identical to that of ΔVFB in our previous study.11 For convenience, the ΔVFB(DOTAP) values were plotted after being multiplied by −1 (Fig. 1a). The same salt solution was used in a sequence of experiments comprising C–V measurements for the clean nitride surface, vesicle adsorption, and the subsequent C–V measurements.
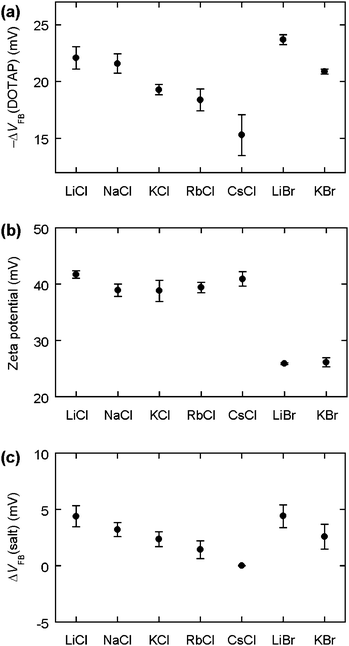 | ||
| Fig. 1 (a) −ΔVFB(DOTAP). Values are the average for eight sensors. (b) Zeta potential of DOTAP vesicles. Points are the mean for 4–8 determinations. (c) ΔVFB(salt). Values are the average for six sensors. The horizontal axis shows the salt contained in the buffer (20 mM salt, 10 mM potassium phosphate, pH 7.0). The definition of −ΔVFB(DOTAP) and ΔVFB(salt) is provided in the Experimental section. Scale bars show standard errors. | ||
When the specific adsorption of salt ions on silicon nitride was examined (Fig. 1c), a flat-band voltage (VFB(salt)) was obtained for the clean silicon nitride surface in 20 mM salt, 10 mM potassium phosphate, pH 7.0 for different component salts. The values are reported as the difference from that obtained for 20 mM CsCl, 10 mM potassium phosphate, pH 7.0 (ΔVFB(salt)).
Zeta potential measurements
The zeta potential of DOTAP vesicles (Fig. 1b) was determined using a laser electrophoresis zeta potential analyzer (LEZA-600, Otsuka Electronics, Osaka, Japan).Results and discussion
AFM measurements
AFM measurements were carried out to examine the adsorption behaviors of DOTAP vesicles in the presence of different ions. When vesicle solutions with a lipid concentration of ∼0.1 mM were incubated with the surface for 20 s, flat elevated patches were typically observed. An example image is shown for the NaCl solution (Fig 2a). The elevated patches were 4.5–4.8 nm high (Table 1), which is in good agreement with the typical bilayer thickness (4–5 nm).13 The data showed that changing the salt resulted in a negligible height difference at the AFM resolution level (Table 1).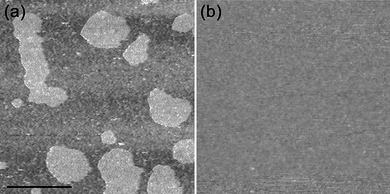 | ||
| Fig. 2 AFM images obtained after adsorption of DOTAP vesicles in 20 mM NaCl, 10 mM potassium phosphate, pH 7.0. (a) Adsorption of ∼0.1 mM lipid for 20 s. (b) Adsorption of ∼0.7 mM lipid for 10 min. Scale bar, 0.5 µm. | ||
| Salt | Height (nm) |
|---|---|
| LiCl | 4.6 ± 0.12 |
| NaCl | 4.8 ± 0.094 |
| KCl | 4.5 ± 0.27 |
| RbCl | 4.6 ± 0.18 |
| CsCl | 4.7 ± 0.15 |
| LiBr | 4.8 ± 0.090 |
| KBr | 4.8 ± 0.046 |
Saturation coverage of planar bilayers was obtained after vesicle solutions with a lipid concentration of ∼0.7 mM were incubated with the surface for 10 min. A typical image is shown for the NaCl solution (Fig. 2b). Continuous SLBs with a similar appearance were observed for all the salt solutions, indicating that the SLBs had similar characteristics at least within the AFM resolution limit. These full surface density SLBs were examined in the C–V measurements.
Flat-band voltage change with supported bilayer formation
The flat-band voltage was reduced with SLB adsorption, resulting in positive −ΔVFB(DOTAP) values for all the buffers (Fig. 1a). The data are consistent with our previous conclusion that the flat-band level is lowered through the interaction between carriers in silicon and the positive charge of the lipid headgroups.11 The magnitude of −ΔVFB(DOTAP) changed in a cation-dependent manner. For the chloride salts, the −ΔVFB(DOTAP) values decreased progressively in the order Li+ > Na+ > K+ > Rb+ > Cs+. For the bromide salts, the −ΔVFB(DOTAP) values decreased in the sequence Li+ > K+. These results show that the surface potential of silicon nitride varied by different amounts when the SLBs were formed in the presence of different cations. A major purpose of the present study was to elucidate the role of the alkali ions in the flat-band voltage change.The charged silicon nitride and bilayer surfaces interact with salt ions nonspecifically in the diffuse layer and specifically in the Stern layer. The nonspecific interaction is solely dependent on the valance and concentration of the electrolytes, and is independent of their chemical properties.14 Since all the salts were monovalent and added to the buffers with the same concentration, we expect the effect of the nonspecific interaction to remain constant. Thus, we rule out the possibility that the cation-dependent flat-band voltage shift originated from the nonspecific interaction of the cations with the bilayers or the silicon nitride surface. We therefore focused on the specific adsorption of cations in order to understand the basic principles that change the flat-band voltage shift with the identity of the cations.
We suspected that two potential mechanisms were responsible for the cation-dependent voltage change. With the first mechanism the surface potential of the bilayers differs due to the different affinities of the cations to the lipid headgroups. To examine the specific binding of the cations to the lipids, we obtained the zeta potential of free DOTAP vesicles in various buffers (Fig. 1b). The second potential mechanism involves the specific binding of cations to silicon nitride. Silicon nitride has –O− groups that can associate with cations (M+) in an electrolyte to form –O−M+ complexes.15 If these surface complexes alter the interaction between DOTAP and silicon nitride or if they are dissociated during SLB attachment, the −ΔVFB(DOTAP) might be affected depending on the association constants between the cations and –O− sites. To test this possibility, we investigated the affinity of cations to silicon nitride by examining the ΔVFB(salt) (Fig. 1c) and the dependence of the flat-band voltage on the salt concentration (Fig. 3). In the first two sections below, we describe these experiments, which we performed to explore the two potential mechanisms. In the third section, we propose possible models that account for the −ΔVFB(DOTAP) dependence on cations. In the last section, we describe anion behavior.
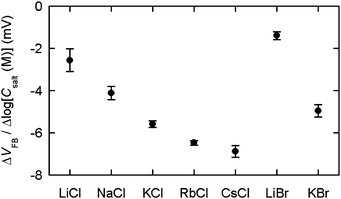 | ||
| Fig. 3 The slope obtained by linear approximation for VFBvs. logCsalt. Points are the average for six sensors. Scale bars show standard errors. | ||
Zeta potential measurements for DOTAP vesicles
The zeta potential of free DOTAP vesicles did not change significantly when the cationic species was changed (Fig. 1b). The chloride buffers produced a zeta potential of ∼40 mV and did not show any systematic variation for the cations. In addition, the bromide buffers yielded a value of ∼25 mV for both Li+ and K+. These results suggest that the monovalent cations have a similar affinity to the hydrophilic region of DOTAP. This similar affinity is reasonable since the cationic vesicles would repel alkali ions. From the zeta potential data, the cationic adsorption on the bilayers, namely the charge of the bilayer surface, seemed unlikely to explain the −ΔVFB(DOTAP) values, which varied with the type of cation.Specific adsorption of cations on silicon nitride
The zeta potential data were independent of the cations, which argues against the first potential mechanism whereby differences in the bilayer potential were the dominant parameter varying the flat-band voltage shift. We therefore tested the remaining potential mechanism whereby the specific binding of cations to silicon nitride is involved in the cation-dependent flat-band voltage shift. Because a silicon nitride surface has an isoelectric point in an acidic pH region,16 the sensor surface is negatively charged at pH 7 owing to the presence of SiO− groups. Thus, cations can specifically bind to SiO− sites. We examined ΔVFB(salt) to investigate the specific interaction between alkali ions and silicon nitride (Fig. 1c). With the chloride solutions, the ΔVFB(salt) values decreased progressively in the order Li+ > Na+ > K+ > Rb+ > Cs+. With the bromide solutions, the values also decreased in the order Li+ > K+. The solution pH was constant in all the measurements. The dependence of ΔVFB(salt) on cations therefore suggests that different alkali ions have different affinities to the nitride surface. The −ΔVFB(DOTAP) and the ΔVFB(salt) data exhibited a similar pattern where the values decreased as the atomic number of the alkali ions increased. Thus, we reasoned that the specific binding of the cations to silicon nitride might explain why the flat-band voltage change that occurs with SLB formation is dependent on the cations.To further understand the affinity of alkali ions to silicon nitride, we examined the flat-band voltage for the clean silicon nitride surface in 10 mM potassium phosphate [pH 7.0] containing 10, 30, and 100 mM salt. Three VFB values obtained with the different salt content were plotted as a function of the salt concentration (Csalt). The data points were then fitted to a linear relation to obtain the slope, i.e. the VFB variation with the salt concentration (ΔVFB/Δlog(Csalt)) (Fig. 3). The data showed that the sensitivity of the flat-band voltage to the salt level is enhanced in the order LiCl < NaCl < KCl < RbCl < CsCl and LiBr < KBr, indicating that the association constant of cations with silicon nitride is elevated in the order Li+ < Na+ < K+ < Rb+ < Cs+. As p-type silicon was used in this study, the reduction in VFB is equivalent to a decrease in the net negative charge on the silicon nitride surface. Hence, the observed negative values of ΔVFB/Δlog(Csalt) demonstrate that the binding of alkali ions to the sensor surface renders the nitride surface less negatively charged. Silicon nitride has surface species that are characterized by the following equilibria:10
| SiOH2+ ⇄ SiOH + H+ |
| SiOH ⇄ SiO− + H+ |
| SiNH3+ ⇄ SiNH2 + H+ |
When cations are specifically adsorbed on silicon nitride, an additional equilibrium exists:15
| SiO− + M+ ⇄ SiO−M+ |
The formation of SiO−M+ species shifts the above equilibria. It is conceivable that this equilibrium shift leads to the reduction in the net negative charge on the sensor surface.
SLB detection mechanisms
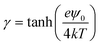
It is expected that the −ΔVFB(DOTAP) dependence on cations originates from the specific binding of the cations to silicon nitride. We propose two models to explain the roles of the specifically bound cations (Fig. 4). One possible model is that the separation between the SLBs and the silicon nitride changes in the increasing sequence Li+ < Na+ < K+ < Rb+ < Cs+ (Fig. 4a). The ΔVFB/Δlog(Csalt) data showed that the net negative charge on the sensors becomes smaller in the order Li+ > Na+ > K+ > Rb+ > Cs+ (Fig. 3). Thus, a nitride surface with a different amount of negative charge may possibly adsorb the cationic SLBs with a different bilayer-sensor distance, i.e. a different hydration layer thickness.17 When the bilayer-sensor separation is large, many counterions will be accommodated to screen the charged bilayers. In contrast, with a small separation, efficient screening will be precluded. Therefore, the different bilayer-sensor distance could influence −ΔVFB(DOTAP). Nonetheless, the topographic height of the bilayer patches was similar for all the salt solutions in the AFM data (Table 1). Thus, the difference in the bilayer-sensor separation must be smaller than the AFM resolution limit. When a planar surface with a surface charge density σ is placed in contact with a solution containing a monovalent salt with a number density n in bulk, potential at a distance x from the surface (ψ(x)) is given by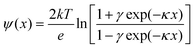

where k is the Boltzmann constant, T is temperature, e is the elementary charge, εr is a relative permittivity, and ε0 is the vacuum permittivity.18 Assuming an electrolyte concentration of 20 mM and an area per lipid of 0.71 nm2,19 the calculated potential at x = 0, 1, 1.5, and 2 nm is 169, 69, 52, and 40 mV, respectively. In the region of the typical hydration layer thickness (∼1–2 nm),17 a difference of only a few angstroms, which is beyond the AFM resolution limit, can yield a significant difference in the potential. Since it was unsuccessful to determine the height of bilayers with angstrom accuracy in the current studies, further investigation will be needed.
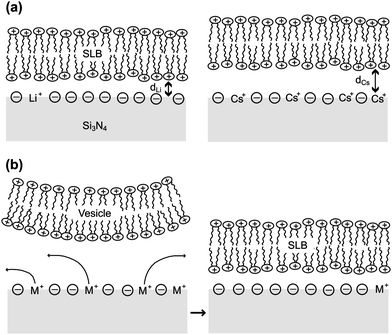 | ||
| Fig. 4 Possible mechanisms to explain the dependence of the −ΔVFB(DOTAP) on monovalent cations. (a) The bilayer-sensor separation differs in the presence of different cations. (b) Cations are desorbed from silicon nitride during SLB adsorption. | ||
The second plausible model is one where the specifically bound cations are desorbed from the nitride surface during SLB formation (Fig. 4b). The nitride surface can interact more favorably with DOTAP after cation desorption because the dissociation of cations results in a more negatively charged sensor surface. The cation desorption occurring with the DOTAP adsorption may be regarded as competitive adsorption of DOTAP and alkali ions. The flat-band voltage change in this model is determined by the contributions from the positive charge of DOTAP and the negative charge that results from cation desorption. Because of these opposite contributions, the −ΔVFB(DOTAP) value is decreased when more alkali ions are desorbed from the silicon nitride surface. Provided that the cations are released from the nitride surface during SLB attachment in the increasing sequence Li+ < Na+ < K+ < Rb+ < Cs+, we can explain the fact that the −ΔVFB(DOTAP) value varies in the decreasing sequence Li+ > Na+ > K+ > Rb+ > Cs+. Indeed, the data showed that the alkali ions were bound to the silicon nitride with an increasing affinity of Li+ < Na+ < K+ < Rb+ < Cs+ (Fig. 3), indicating that the number of cations that can dissociate from the sensor surface is increased in the order Li+ < Na+ < K+ < Rb+ < Cs+. This model hypothesizes that the favorable interaction between SLBs and silicon nitride provides sufficient energy to remove Cs+, which has the highest affinity to the silicon nitride surface.
Desorption of bromide ions from the bilayer surface during SLB formation
Although we were primarily concerned with the −ΔVFB(DOTAP) dependence on the cations, a comparison of the flat-band voltage shift (Fig. 1a) and the zeta potential data (Fig. 1b) also provided intriguing results with respect to the anions. In contrast to the similar affinity of cations to the lipid headgroups, Cl− and Br− appeared to have different binding affinities to the DOTAP vesicles. The zeta potential of vesicles in the bromide solutions was much lower than that in the chloride buffers (Fig. 1b), indicating that more Br− ions were specifically bound to the vesicle surface than Cl−. These results are consistent with a Hofmeister series where Br− adsorbs to phosphatidylcholine bilayers and cationic surfactant micelles to a much larger degree than Cl−.20 Despite the clear indication of Br− adsorption, such specific adsorption was not observed for the flat-band voltage change (Fig. 1a). If the SLBs adsorb more Br− than Cl− as found with the vesicles, the bromide solutions should yield smaller −ΔVFB(DOTAP) values than the chloride solutions. Nonetheless, the −ΔVFB(DOTAP) value for the bromide buffers was similar to that for the chloride buffers, which contained the same cations. Thus, it seems likely that Br− was desorbed from at least the lower leaflet of the SLBs. When the specifically adsorbed Br− is removed from the lower leaflet of the SLBs, the negatively charged nitride surface can interact more favorably with the positively charged leaflet of the DOTAP bilayers. It is therefore reasonable that the bromide ion desorption takes place. We expect the sensor signals to be mainly determined by the lower leaflet because the lower leaflet would exert a greater influence on the surface potential of silicon nitride than the upper leaflet. The ratio between the contributions from the lower and upper leaflets is not yet understood. If the sensors detect the electric potential of the two leaflets with similar sensitivity, the current data would indicate that Br− is desorbed from both leaflets. In contrast, if the sensors detect the lower leaflet almost exclusively, the removal of Br− would be proven only for the lower leaflet. In this case, the upper leaflet becomes invisible in the flat-band voltage signals, and consequently the association or dissociation of the anions cannot be examined for the upper leaflet.Conclusions
We have demonstrated that the flat-band voltage change that occurs with SLB adsorption decreases in the sequence Li+ > Na+ > K+ > Rb+ > Cs+. The cation-dependent flat-band voltage shift is expected to occur due to the specific binding of alkali ions to silicon nitride. The difference in the bilayer-sensor separation and the desorption of alkali ions from the sensor surface were proposed as possible mechanisms to explain the fact that the flat-band voltage shift varies with the cationic species. We have also shown that Br− ions specifically bound to the vesicles are removed from at least the lower leaflet during SLB formation. The removal of the anions from the bilayer surface seems to occur to enhance the electrostatic interaction between the cationic bilayers and the anionic silicon nitride surface.Acknowledgements
A part of this work was supported by the Nanotechnology Network Project of the Ministry of Education, Culture, Sports, Science and Technology (MEXT), Japan. We thank Dr Taro Takemura for his assistance with the zeta potential analyses.References
- P. Bergveld, Sens. Actuators, B, 2003, 88, 1–20 CrossRef.
- A. Poghossian, S. Ingebrandt, M. H. Abouzar and M. J. Schoning, Appl. Phys. A: Mater. Sci. Process., 2007, 87, 517–524 CrossRef CAS.
- K. S. Song, G. J. Zhang, Y. Nakamura, K. Furukawa, T. Hiraki, J. H. Yang, T. Funatsu, I. Ohdomari and H. Kawarada, Phys. Rev. E: Stat., Nonlinear, Soft Matter Phys., 2006, 74, 041919 CrossRef; K. Maehashi, T. Katsura, K. Kerman, Y. Takamura, K. Matsumoto and E. Tamiya, Anal. Chem., 2007, 79, 782–787 CrossRef CAS; T. Dastagir, E. S. Forzani, R. Zhang, I. Amlani, L. A. Nagahara, R. Tsui and N. Tao, Analyst, 2007, 132, 738–740 RSC.
- A. Härtl, B. Baur, M. Stutzmann and J. A. Garrido, Langmuir, 2008, 24, 9898–9906 CrossRef.
- W. U. Wang, C. Chen, K. H. Lin, Y. Fang and C. M. Lieber, Proc. Natl. Acad. Sci. U. S. A., 2005, 102, 3208–3212 CrossRef CAS; E. Stern, J. F. Klemic, D. A. Routenberg, P. N. Wyrembak, D. B. Turner-Evans, A. D. Hamilton, D. A. LaVan, T. M. Fahmy and M. A. Reed, Nature, 2007, 445, 519–522 CrossRef CAS; B. L. Allen, P. D. Kichambare and A. Star, Adv. Mater., 2007, 19, 1439–1451 CrossRef CAS.
- F. Pouthas, C. Gentil, D. Côte and U. Bockelmann, Appl. Phys. Lett., 2004, 84, 1594–1596 CrossRef CAS; T. Uno, H. Tabata and T. Kawai, Anal. Chem., 2007, 79, 52–59 CrossRef CAS.
- J. Fritz, E. B. Cooper, S. Gaudet, P. K. Sorger and S. R. Manalis, Proc. Natl. Acad. Sci. U. S. A., 2002, 99, 14142–14146 CrossRef CAS.
- L. Bousse, J. Chem. Phys., 1982, 76, 5128–5133 CrossRef CAS.
- L. Bousse, N. F. Derooij and P. Bergveld, IEEE Trans. Electron Devices, 1983, 30, 1263–1270; A. B. Kharitonov, M. Zayats, A. Lichtenstein, E. Katz and I. Willner, Sens. Actuators, B, 2000, 70, 222–231 CrossRef.
- D. L. Harame, L. J. Bousse, J. D. Shott and J. D. Meindl, IEEE Trans. Electron Devices, 1987, 34, 1700–1707 CrossRef.
- C. Kataoka-Hamai, H. Inoue and Y. Miyahara, Langmuir, 2008, 24, 9916–9920 CrossRef CAS.
- P. S. Cremer and S. G. Boxer, J. Phys. Chem. B, 1999, 103, 2554–2559 CrossRef CAS; C. Hamai, P. S. Cremer and S. M. Musser, Biophys. J., 2007, 92, 1988–1999 CrossRef CAS; C. Hamai, T. Yang, S. Kataoka, P. S. Cremer and S. M. Musser, Biophys. J., 2006, 90, 1241–1248 CAS; E. M. A. Pereira, D. F. S. Petri and A. M. Carmona-Ribeiro, J. Phys. Chem. B, 2006, 110, 10070–10074 CrossRef CAS; B. Seantier and B. Kasemo, Langmuir, 2009, 25, 5767–5772 CrossRef CAS.
- G. Caracciolo, D. Pozzi and R. Caminiti, Appl. Phys. Lett., 2007, 90, 183901 CrossRef; M. J. Higgins, M. Polcik, T. Fukuma, J. E. Sader, Y. Nakayama and S. P. Jarvis, Biophys. J., 2006, 91, 2532–2542 CrossRef CAS; Z. V. Leonenko, D. Merkle, S. P. Lees-Miller and D. T. Cramb, Langmuir, 2002, 18, 4873–4884 CrossRef CAS; H. Schönherr, J. M. Johnson, P. Lenz, C. W. Frank and S. G. Boxer, Langmuir, 2004, 20, 11600–11606 CrossRef.
- A. J. Bard and L. R. Faulkner, Electrochemical Methods: fundamentals and applications, John Wiley & Sons, Hoboken, 2001 Search PubMed.
- L. Bousse, N. F. De Rooij and P. Bergveld, Surf. Sci., 1983, 135, 479–496 CrossRef CAS; C. D. Fung, P. W. Cheung and W. H. Ko, IEEE Trans. Electron Devices, 1986, 33, 8–18.
- P. Chavez, W. Ducker, J. Israelachvili and K. Maxwell, Langmuir, 1996, 12, 4111–4115 CrossRef CAS; M. N. Niu, X. F. Ding and Q. Y. Tong, Sens. Actuators, B, 1996, 37, 13–17 CrossRef; A. Poghossian, Sens. Actuators, B, 1997, 44, 551–553 CrossRef.
- T. M. Bayerl and M. Bloom, Biophys. J., 1990, 58, 357–362 Search PubMed; P. Fromherz, V. Kiessling, K. Kottig and G. Zeck, Appl. Phys. A: Mater. Sci. Process., 1999, 69, 571–576 CrossRef CAS; M. B. Hochrein, C. Reich, B. Krause, J. O. Radler and B. Nickel, Langmuir, 2006, 22, 538–545 CrossRef CAS; S. J. Johnson, T. M. Bayerl, D. C. McDermott, G. W. Adam, A. R. Rennie, R. K. Thomas and E. Sackmann, Biophys. J., 1991, 59, 289–294 CrossRef CAS; V. Kiessling and L. K. Tamm, Biophys. J., 2003, 84, 408–418 CrossRef CAS; C. E. Miller, J. Majewski, T. Gog and T. L. Kuhl, Phys. Rev. Lett., 2005, 94, 238104 CrossRef CAS.
- J. N. Israelachvili, Intermolecular and Surface Forces, Academic Press, London, 1992 Search PubMed.
- A. A. Gurtovenko, M. Patra, M. Karttunen and I. Vattulainen, Biophys. J., 2004, 86, 3461–3472 CrossRef CAS.
- J. A. Loughlin and L. S. Romsted, Colloids Surf., 1990, 48, 123–137 CrossRef CAS; H. I. Petrache, T. Zemb, L. Belloni and V. A. Parsegian, Proc. Natl. Acad. Sci. U. S. A., 2006, 103, 7982–7987 CrossRef CAS; L. S. Romsted, Langmuir, 2007, 23, 414–424 CrossRef CAS.
| This journal is © The Royal Society of Chemistry 2010 |