Cytotoxicity of arsenic-containing chemical warfare agent degradation products with metallomic approaches for metabolite analysis
Karolin K.
Kroening
a,
Morwena J. V.
Solivio
a,
Mónica
García-López
ab,
Alvaro
Puga
c and
Joseph A.
Caruso
a
aUniversity of Cincinnati/Agilent Technologies Metallomics Center of the Americas, Department of Chemistry, University of Cincinnati, Cincinnati, OH 45221-0172, USA. E-mail: joseph.caruso@uc.edu
bOn student study leave to the University of Cincinnati from the Department of Analytical Chemistry, Instituto de Investigación y Análisis Alimentario (IIAA), University of Santiago de Compostela, Spain
cDepartment of Environmental Health, University of Cincinnati, Cincinnati, Ohio, 45221-0172, USA
First published on 18th November 2008
Abstract
The arsenic metallome in African Green Monkey kidney cells is probed by measuring cytotoxicity, cellular arsenic uptake and speciation studies on arsenic-containing chemical warfare agent degradation products (CWDPs) during cell uptake. Inorganic arsenic compounds and methylated species also were studied during cell uptake as a means of providing cytotoxicity information relative to the CWDPs. The degradation products used were phenylarsine oxide (PAO), phenylarsonic acid (PAA), diphenylarsinic acid (DPAA), triphenylarsine (TPA) and triphenylarsine oxide (TPAO). These are the warfare agent’s primary degradation products. The parent warfare agents (red agents) are diphenylarsine chloride (DA or referred to as Clark I) and diphenylarsine cyanide (DC or Clark II), sternutator agents, sneezing gases able to cause bronchial irritation. Cytotoxicity levels and cellular uptake were compared to those of inorganic species: sodium arsenite, NaAsO2 [As(III)], sodium arsenateNa2HAsO4 [As(V)] and methylated arsenicals such as dimethylarsinic acid (DMA) and methylarsonic acid (MMA). The arsenic uptake was demonstrated in an African Green Monkey kidney cell line , CV-1. Quantification of lactate dehydrogenase activityreleased from damaged/dying cells was then measured via an LDH assay . The purpose of this study is to initially investigate toxicity to cells when exposed to different arsenic containing compounds over different concentrations and time ranges from 3 h to 24 h. Furthermore, exposed cells were then analyzed for different arsenic species by high performance liquid chromatography (HPLC) with inductively coupled plasma mass spectrometry to isolate and speciate arsenic fractions followed by nanoLC electrospray ionization mass spectrometry to analyze the molecular level changes of the arsenic based degradation products in the kidney cells. Metabolic changes to the arsenic species were found, and interestingly, at the lowest uptake levels, cytotoxicities were generally higher for the chemical warfare agent degradation products than the inorganic arsenic species.
Introduction
Arsenic, a hazardous metalloid, is the inorganic component of a chemical warfare agent named Blue Cross, which contains diphenylchloroarsine (DA, Clark I) and diphenylcyanoarsine (DC, Clark II). These agents were mainly used during World War I as vomiting agents; the main purpose was to be “mask breakers” by penetrating the canister; thereby forcing the opposing troops to remove their masks and be further exposed to toxic agents. A concern with these compounds is the possibility of prolonged systemic effects, such as headache, mental depression, chills, nausea, abdominal cramps, vomiting and diarrhea, all lasting for several hours after exposure. The agents are dispersed as aerosols and they produce their effects by inhalation or by direct action on the eyes. When released indoors, they can cause serious illness or death.1,2Chemical warfare agent degradation products (CWDPs) include diphenylarsinic acid (DPAA), phenylarsonic acid (PAA) and phenylarsine oxide (PAO). In the degradation pathway, byproducts such as triphenylarsine (TPA) and triphenylarsine oxide (TPAO) are found and their structures are shown in Fig. 1. Previous papers have mentioned that groundwater and soil have been contaminated from some of these organoarsenical compounds, leading to environmental problems.3,4 Oyama et al. reported as recently as 2007 the presence of degradation products DPAA, PAA and PAO in groundwater and soil in Kamisu City, Japan.5 With known population exposure, it is important to understand the biological uptake mechanism for these degradation products in mammalian organisms. Examples of other studied arsenic species include sodium arsenate, Na2HAsO4 [As(V)], sodium arsenite, NaAsO2 [As(III)], dimethylarsinic acid (DMA) and methylarsonic acid (MMA) as shown in Fig. 1 as well as parent agents Clark I and Clark II.
 | ||
| Fig. 1 Structures of primary warfare agents, their degradation products and other arsenic species used in the cytotoxicity study. | ||
The aim of this work was to do an initial study investigating CWDPs cytotoxicity on mammalian cells by comparing the effects of different CWDP concentrations over different time periods. To generate metallomics information an As speciation study was performed utilizing liquid chromatography (LC) coupled to both inductively coupled plasma mass spectrometry (ICPMS) and electrospray ionization mass spectrometry (ESI-MS) to identify the molecular level changes the CWDPs might undergo.
The cytotoxicity evaluation was conducted on an African Green Monkey CV-1 cell line based on quantification of lactate dehydrogenase activity as released from damaged/dying cells. Kidney cells were chosen as target cells because kidneys take up and excrete a variety of substances produced by the cell metabolism. A comparison of different concentration levels over different time ranges was completed, following the toxic compounds addition to the cells. The cells treated with the various arsenic species were then tested for cellular arsenic uptake by ICPMS detection of the monoisotopic 75As.
The interest in arsenic speciation analyses continues to grow with the increasing need to assess its biological effects. Total arsenic analyses, though necessary, are insufficient to fully address the complexities and questions posed by biological systems. While As totals are useful, they provide no information on the various arsenic forms, which have widely varying toxicities. The inorganic species, which are commonly found in the environment, are known to be the most toxic species, while some of the organic arsenic forms are less toxic and even innocuous.6 Hence, speciation analysis is required and further identification and verification by molecular mass spectrometry as necessary.
Materials and methods
Chemicals
Ammonium acetate (Fisher Scientific, Fairlawn, NJ, USA) was the buffer used for liquid chromatography (LC) separation. The buffer pH was adjusted to 8.3 using ammonium hydroxide, also from Fisher Scientific. Methanol (Tedia Company, Fairfield, OH, USA), was the organic modifier. The As(V) standard, sodium arsenate monobasic was acquired from Sigma Aldrich, St. Louis, MO, USA, while the As(III) standard, sodium (meta) arsenite was procured from Sigma Aldrich, Madrid, Spain. The methylated arsenic species standard, methylarsonic acid (MMA) was from Chem. Service, Westchester, PA, USA, while dimethylarsinic acid (DMA) was obtained from Fluka Chemie, Melville, NY, USA. The degradation products, phenylarsine oxide (PAO) and phenylarsonic acid (PAA) were purchased from Alfa Aesar, Lancaster, UK, while diphenylarsinic acid (DPAA) was purchased from Wako Pure Chemical Industries Ltd., Osaka, Japan. CWDPs’ byproducts, triphenylarsine (TPA) and triphenylarsine oxide (TPAO) were acquired from Sigma-Aldrich Inc., Steinheim, Germany.Cells, media and culture conditions
The cell line used for the experiments was Cercopithecus aethiops (African Green Monkey) kidney cells, CV-1. The CV-1 lines, disease normal, morphology fibroblast, were available from the Puga labs at the University of Cincinnati. The cells were grown in Dulbecco’s Modified Eagle’s Medium (DMEM; ATCC, Manassas, VA, USA) supplemented with 10% fetal bovine serum (FBS; Gibco Invitrogen Corporation, Carlsbad, CA, USA) in a humidified incubator under 95% air and 5% CO2 and at a temperature of 37 °C. Subculture passages were performed twice a week using trypsin–EDTA: 0.05% trypsin 0.53 mM EDTA × 4Na (Gibco Invitrogen Corporation, Carlsbad, CA, USA). Dimethyl sulfoxide (DMSO; Fisher Scientific, Fairlawn, NJ, USA) was used for frozen stock ampoules at passage 5. Cells used for the experiments were from passages 5 to 12 at a stage of about 80% confluency as estimated by referring to microscopic images.Cytotoxicity assay
The LDH cytotoxicity detection kit was obtained from Fisher Scientific, Pittsburgh, PA, USA. Triton X-100 (Sigma-Aldrich Chemie, Steinheim, Germany) was used for high controls. This LDH assay was specifically chosen because of its good sensitivity. More specifically it allows for detection based on the lowest number of cells that can be quantified and is compatible with a variety of culture media and liquid handling systems for various detection target applications: cell proliferation, viability (number of live cells), cytotoxicity (number of dead cells). This assay provides a fast and simple method for quantifying cytotoxicity based on lactate dehydrogenase activityreleased from damaged/dead cells by absorbance measurements at 492 nm.Unlike many other cytoplasmic enzymes, which exist in many cells either in low or unstable amounts (e.g., alkaline and acid phosphatase), LDH is a stable cytoplasmic enzyme present in all cells and rapidly released into the cell culture supernatant upon plasma membrane damage. LDH activity can be determined by a coupled enzymatic reaction: LDH oxidizes lactate to pyruvate, which then reacts with tetrazolium salt INT to form formazan. The increase in the amount of formazan produced in culture supernatant directly correlates to the increase in the number of lysed cells. The formazandye is water soluble and can be detected spectrophotometrically at 492 nm.7
During these experiments the amount of FBS had to be lowered to 1% instead of 10% as recommended because of possible interference during the absorbance measurement. Target cells were seeded in a 96 well microtiter plate (5 × 10³ cells/well) together with different concentrations of the above mentioned As compounds and tested on different incubation time frames.
Triton X-100, known to be highly toxic to the cells, was added for a high control to measure the correct cell death. The cell medium was used as low control to indicate the favorable environment for cell growth. These two controls were used for the calculation of cytotoxicity by subtracting the low control from the high control as background correction. A microtiter with blank control has been plated also and has been subtracted from the final values. The LDH assay required the following steps: addition of a mixture of lyophilized catalyst and thawed dye solution and no exposure to light for 30 min, centrifugation at 250 × g for 10 min, 2 times dilution with DDI water, and the LDH activity measured at 492 nm.
Instrumentation
Imaging
A Nikon Eclipse TE300 inverted epi-fluoresence microscope with a MagnaFire Digital CCD Camera System (BioRad MRC1024. Birad, MO, USA) was used to photograph cell growth indicating various stages of confluency.Microwave digestion
An Intellivent Explorer microwave digestion/extraction system (CEM Corporation, Matthews, NC, USA) equipped with magnetic stirrer and accelerated cooling profile utilizing compressed gas, was used to digest the arsenic treated cells in preparation for As total analysis in 10 mL glass tubes sealed with polytetrafluoroethylene faced septa caps. The cells were washed five times to eliminate any residue from the cell culture medium and then digested in the microwave system for 3 min with 50![[thin space (1/6-em)]](https://www.rsc.org/images/entities/char_2009.gif) :50 v/v nitric acid in DDI water at a temperature of 350 °C and a maximum pressure of 1.38 MPa (200 psi).
:50 v/v nitric acid in DDI water at a temperature of 350 °C and a maximum pressure of 1.38 MPa (200 psi).
Sonicator
A Fisher Scientific (Fisher Scientific, Pittsburgh, PA, USA) ultrasonic cleaner featuring a 40 kHz industrial transducer with sweep frequency to ensure uniform ultrasonic activity within the tank, was used to disrupt the cellular membrane prior to speciation analyses. One milligram (1 mg) of cells was washed five times with DDI water then sonicated for 20 min to accomplish physical cell disruption. Sonication is a good method for samples on the order of 1 mg. To avoid excessive heating the sample was immersed in an ice bath.Centrifuge
A Sorvall RC-5B refrigerated superspeed centrifuge (Dupont Instruments, ON, Canada) was used to separate the arsenic species from the other cellular contents in preparation for the speciation assay . Lysed cells were centrifuged for 30 min at 2500 rpm and 1 mL of the supernatant was analyzed under chromatographic separation.High performance liquid chromatography (LC)
An Agilent (Agilent Technologies, Santa Clara, CA, USA) 1100 high performance liquid chromatography system equipped with a high pressure binary gradient pump, autosampler, vacuum degasser, column compartment with Peltier heating/cooling, and UV detector was used to separate the arsenic species being investigated in this study. The UV detector was used in line with the ICPMS. A C3 column (Agilent Technologies), Zorbax 300S-C3, (4.6 × 150 mm, 3.5 μm) was used for the separation and speciation experiments, which were accomplished under isocratic conditions with 10 mM ammonium acetate as mobile phase (pH 8.2) and 15% (v/v) methanol as organic modifier using the C3 column. A 100 μL portion of the digested cell sample treated with the arsenic species being investigated was injected into the LC-ICPMS at a flow rate of 1.0 mL min−1.Inductively coupled plasma mass spectrometer (ICPMS)
An Agilent 7500cx ICPMS (Agilent Technologies, Santa Clara, CA) equipped with a shield torch system and a collision/reaction cell was used for element specific detection of arsenic at m/z 75. Electronic coupling of the ICPMS with the LC was accomplished through the use of a remote cable, which allowed for synchronized starting prior to each chromatographic run. The experiments have been performed by detecting at m/z of 75 with the ICPMS by using a flow rate of 3.5 mL min−1 of H2 as cell reaction gas and quadrupole and octopole bias at −16 V and −18 V, respectively, for a net +2V energy discrimination barrier. ICPMS parameters and LC settings are given in Table 1.| ICPMS parameters | |
|---|---|
| Instrument | Agilent 7500cx ICPMS |
| Forward power | 1500 W (with shielded torch) |
| Plasma gas flow rate | 14.6 L min−1 |
| Auxiliary gas flow rate | 1.1 L min−1 |
| Carrier gas flow rate | 0.93 L min−1 |
| Nebulizer | Glass expansion micro-concentric |
| Spray chamber | ≈2 °C (Scott double channel) |
| Sampling depth | 7.5 mm |
| Sampling and skimmer cones | Nickel |
| Dwell time | 0.1 s |
| Isotope monitored (m/z) | 75As |
| Octopole reaction system | H2 (flow rate: 3.5 mL min−1) |
| QP bias | −16 V |
| Octopole | −18 V |
| HPLC parameters | |
|---|---|
| Instrument | Agilent 1100 HPLC |
| Flow rate | 1.0 mL min−1 |
| Injection volume | 100 μL |
| Buffer | 10 mM NH4COOH + 15% MeOH |
| PH | 8.2 |
| Column | Zorbax 300S-C3, (4.6 × 150 mm, 3.5 μm) |
| ESI-MS parameters | |
|---|---|
| Instrument | MSD Ion Trap XCT Ultra system |
| Flow rate | 18 μL h−1 |
| Drying gas | N2, 4 L min−1 |
| Temperature | 300 °C |
| MS capillary voltage | 1800 V |
| Skimmer | 25.0 V |
| Capillary exit | 110.7 V |
| Trap drive | 32.3 V |
Electrospray ionization mass spectrometry (ESI-MS)
All electrospray experiments were accomplished by taking As specific fractions pre-determined by HPLC-ICPMS and directly infusing them to the ion trap mass spectrometer using a syringe pump on an MSD Ion Trap XCT Ultra system (Agilent Technologies, Santa Clara, CA) equipped with an on-chip nano column of Zorbax 300SB C18 for enrichment (4 mm × 75 μm, 5 μm) and an analytical column Zorbax C18 (45 mm × 75 μm, 5 μm). Sample loading onto the enrichment column was set at a flow rate of 18 μL h−1 with the mobile phase used for chromatographic separation. The following MS conditions were used: 4 L min−1 nitrogen drying gas at a temperature of 300 °C; MS capillary voltage, 1800 V; skimmer, 25.0 V; capillary exit, 110.7 V; trap drive, 32.3 V. The MS scan range was 50–400 m/z in standard-enhanced scan mode. ESI-MS, ESI-MS2 spectra were taken.Results and discussion
Cytotoxicity of different arsenic species in African Green Monkey CV-1 cells
The study of cell viability requires the quantification of the number of viable cells in a cell culture. Cells were tested with exposure to four different concentrations: 0.5, 5, 50 and 500 μM, of the five CWDPs, two inorganic arsenic species As(III) and As(V) and the methyl organoarsenicals DMA and MMA, in addition to cell medium, low and high controls. Additionally a zero control has been plated for all the above mentioned products. Further, three different time frames (3, 12 and 24 h) for cell exposure were utilized to assess the prolonged effect on target cells. Cells for the experiments were chosen when their confluency level reached about 80%. Confluency is an indication of the cell growth phase, referred to proliferation throughout the culture medium. The confluency level was based on microscopic images, for example, those shown in Fig. 2a and b, showing a distinction in cell density between confluent and non-confluent cells. Fig. 2a, also demonstrates the difference in appearance between live and dead cells. Live CV-1 cells adhere to the substratum and have fibroblast-like morphology, while dead CV-1 cells are round and are detached. The black dots in the image are probably organelles or proteins present in the cell.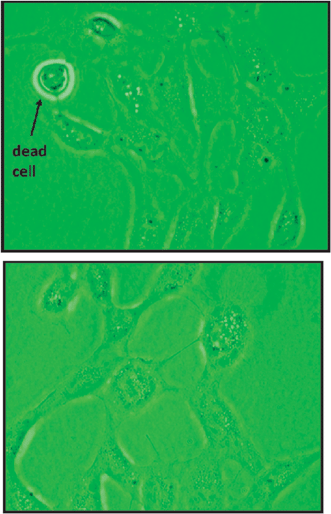 | ||
| Fig. 2 (a) Image of CV-1 cells after 4 days of cultivation, showing evidence of about 80% confluency and the ability to detect for dead cells. (b) Cell confluency after 1 day of cultivation, indicating low proliferation, therefore very low confluency. | ||
The results indicate that treatment with CWDPs after 24 h of incubation resulted in higher cytotoxicity compared to the other arsenic species (Fig. 3a–i). Overall, PAO caused the most cell death. The cytotoxicity level of PAO at the highest concentration (500 μM) is 3.5 ± 0.3 times higher than DMA, 2.3 ± 0.1 times higher than the As(V) species and 1.7 ± 0.1 higher than As(III). Also TPA and TPAO, other products in the degradation pathway, show still higher toxicity levels compared to non CWDPs. It may be possible that species with phenyl groups more easily enter the cell membrane, but the relationship between chemical structure and passage through the mitochondrial membrane is not yet clear.8 As(III) shows higher toxicity when compared with As(V), but possibly lower toxicity relative to several CWDPs. Also it is generally known that As(III) forms of methylated species have genotoxicities similar to inorganic As(III), which may extend to additional organoarsenicals. It has been suggested that the difference between As(III) and As(V) is due to the faster uptake of As(III) by endothelial cells with inorganic arsenic exerting its toxicity, at least in part, viaintracellular oxidative stress.9 The experiment also showed that the higher the concentration of arsenic species added, the stronger the cell damage. Calculations for cytotoxicity were performed based on triplicate experiments and error bars at ±1 std dev. obtained for each experiment (as is generally accepted for these types of experiments).
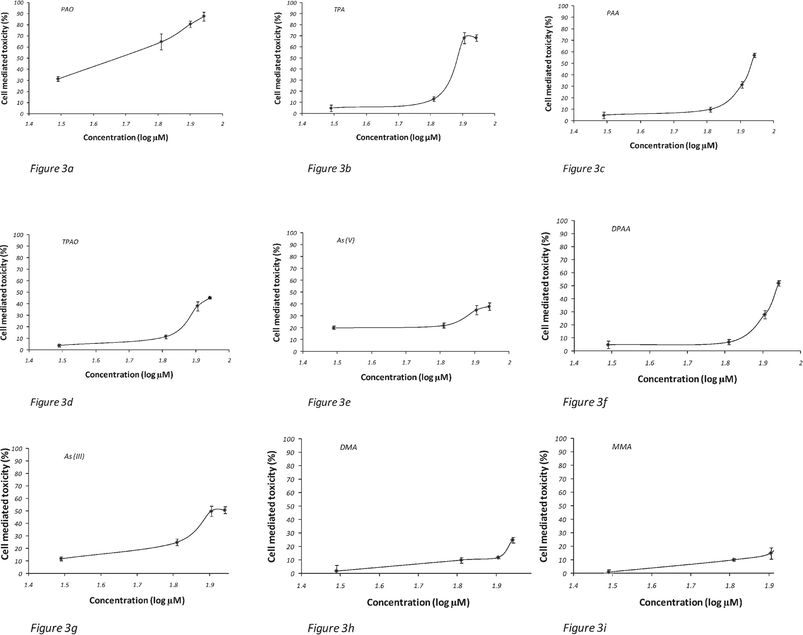 | ||
| Fig. 3 (a–i) Cytotoxicity studies at different arsenic species concentrations (0.5, 5, 50, 500 μM) taken at 24 h exposure. Error bars represent ±1 std dev. | ||
Fig. 4 demonstrates cell damage/death after incubated exposure for 3, 12 and 24 h, respectively, to the arsenic compounds (concentration at 500 μM). Significant differences between different exposure times are noted. PAO, TPA and sodium arsenite have strong cytotoxicity after 3 h and the prolonged exposure to arsenic does not significantly increase cell death when compared to the pentavalent species. The relative PAO toxicity on target cells grows only 8.5% from 3 to 24 h of exposure, while toxicity increases 24% for DMA and 32% for MMA.
 | ||
| Fig. 4 Toxicity effects on target cells after 3, 12 and 24 h based on different As species with 500 μM added in each experiment performed in triplicate with ±1 std dev. shown as the error. | ||
Tsuchiya et al. conducted experiments on the metabolism of arsenic species, providing evidence that pentavalent inorganic arsenic is metabolized to the trivalent form, which is then methylated. Therefore, the most active arsenic compound is trivalent inorganic arsenite, followed by the pentavalent inorganic arsenate.10 This explanation might be applied to the CWDPs’ trivalent arsenic compounds also, but further investigation is required, since very little information about metabolic interactions and toxicity is known about chemical warfare degradation compounds.
Metallomics approach
Cellular arsenic uptake
Comparison of total arsenic uptake has been studied in the cell culture medium and on the cells. Fig. 5 shows evidence of a higher cellular uptake from the CWDPs. PAO arsenic concentration was 4.8 ± 0.7 times higher than MMA. This suggests that the toxicity is associated with the cellular uptake of the arsenicals. PAA and DPAA are inverted in Fig. 5 (with respect to their III or V arsenic forms), compared to the cytotoxicity results in Fig. 3 where PAA appears to be 1.1 ± 0.2 times more toxic than DPAA, although the error analysis indicates no difference. Considering the As concentration present in the cells, DPAA has a higher uptake of As. As earlier suggested, this may be due to the two phenyl groups on DPAA that permit more interaction with the cell membrane, showing that cytotoxicity and As uptake are not complementary for these two compounds. Relative concentrations with relative standard deviation based on calculations for experiments repeated in triplicate are: MMA 16% ± 1.1, DMA 18% ± 0.8, As(V) 22% ± 1.3, As(III) 47% ± 0.8, TPAO 48% ± 1.2, PAA 52% ± 0.4, DPAA 61% ± 0.3, TPA 67% ± 1, PAO 78% ± 0.4 based on 1 mg of cell pellet after addition of 500 μM of arsenic species and an incubated exposure time of 24 h. | ||
| Fig. 5 Cellular arsenic uptake results based on a 500 μM addition, after 24 h exposure to varying As species. Cellular As uptake percentage refers to the amount of As present in 1 mg of cell pellet. Error bars indicate ±1 std deviation. | ||
Speciation of arsenic compounds after cell exposure
The aim of this work was not only to measure cytotoxicity levels of cells exposed to different arsenic species, but also to understand what changes these toxicant species might undergo after cell metabolism has taken place. Each cell inoculant was analyzed for total arsenic uptake with ICPMS. Additionally, several compounds have been speciated by using LC coupled to ICPMS and subsequently by ESI-MS for mass identification. Because of low uptake for most of the species, speciation was not possible for all.For each compound a standard LC separation was run with As species standards, media and cells. The culture medium was treated with the same amount of As species at the same conditions as for the target cells, i.e. after 24 h As species exposure to 500 μM solution in an incubator.
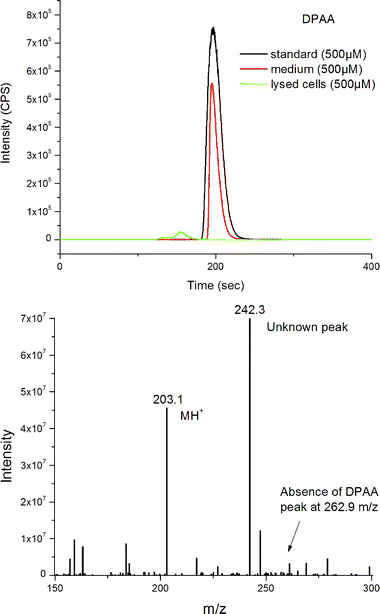
Fig. 6a shows HPLC-ICPMS detection, demonstrating that DPAA was not present in its original form after metabolism, but it is still present in the medium, indicating the species changes occur during cell metabolism. An unknown low intensity peak at 160 s, when compared to the peak from DPAA in the medium, is due to the lower arsenic uptake and possible sample loss during cell lysis.
 | ||
| Fig. 6 (a) LC-ICPMS for speciation analysis with DPAA standard, spiked medium, and target cells showing complete loss of DPAA to PAA as determined by spike addition. (b) ESI mass spectrum obtained for the collected peak in Fig. 6a. | ||
Identification of the unknown LC-ICPMS peak with nanoLC-CHIP-ITMS (+ ion mode) and spiked LC-ICPMS analysis demonstrates the complete chemical transformation of DPAA to PAA after cell interaction (Fig. 6b). Evidence is shown for the molecular ion, [PAA+H]+ at m/z = 203.1. The mass spectrum represents the fraction collected for the unknown peak in Fig. 6b. There is no evidence of this conversion in the medium. It is interesting to note in Fig. 6a how the [DPAA+H]+ peak, expected at m/z = 262.9, is absent. In the cell medium the mass spectrum, performed under the same conditions, stands out with a relative abundance of 5 × 10⁷ and no PAA mass peak is shown. LC-ICPMS with standard spike confirmed this observation. The outstanding peak at m/z 242.3, which also is present in the cell blank, requires further investigation by exact mass identification, currently underway. ESI-MS2 data of this unidentified compound show characteristic peaks at m/z = 279.0 and 372.9. T. Nakayama et al.11 have suggested possible conversions involving phenylarsonic acid–diglutathione complex, PAA-(GSH)2 and fragments of this might offer possibilities. Also no sulfur or phosphorous were detectable in the fraction taken from ICPMS for ITMS experiments. Further mass spectrometry is required for the identification of the 242.3 m/z peak.
Fig. 7a demonstrates that PAO metabolizes also to PAA, with a higher intensity yield. The ESI experiment (Fig. 7b) and LC-ICPMS std spike analysis confirms the presence of this As species. The peak at m/z = 203.1 shows the presence of PAA. The main peak of m/z = 169.1 [PAO+H],+ due to PAO is completely absent. Peaks at m/z = 185.3 are due to water loss [PAA-H2O]+. Also an outstanding peak of m/z = 242.3 is present and not yet identified.
 | ||
| Fig. 7 (a) LC-ICPMS for speciation analysis with PAO standard, spiked medium and target cells. (b) ESI-MS mass spectrum obtained for the collected peak in Fig. 7a. | ||
The fact that both arsenic containing CWDP compounds, DPAA and PAO, transform to PAA matches with their degradation pathways as reported by Oyama.5
TPA and TPAO, byproducts of the CWDPs degradation pathway, the two inorganic species As(III) and As(V), as well as the methylated species DMA and MMA gave poor intensity in the LC-ICPMS separation. The As uptake by the cells was sufficient for total analysis, but too low for speciation. Minimal sample is due to the logistics in preparing larger sample amounts. However, this has been resolved and larger sample quantities are being prepared.
Conclusions
The cytotoxicity experiments monitoring LDH activity show evidence for the chemical warfare degradation products, diphenylchloroarsine and diphenylcyanoarsine, PAO, PAA, DPAA, TPA and TPAO providing stronger cell death when compared to sodium arsenite, sodium arsenate, DMA and MMA. This enhanced interaction may be caused by greater membrane permeability through the phenyl groups. Generally, trivalent arsenic species demonstrate toxicity more quickly than the pentavalent species, as might be expected since MMA(III) is thought to be as toxic as As(III).The study also indicates possible metabolic changes CWDPs might undergo after interaction with the African Green Monkey kidney CV-1 cells. Two degradation products, DPAA and PAO generate PAA in their degradation pathway and confirm that the metallomic approach of multiple mass spectrometries is highly viable.
Acknowledgements
The authors are grateful to Dr Larry Sallans, Ms Jennifer Siverling, and Ms Heather Trenary, University of Cincinnati, for their helpful comments. Also, the authors wish to acknowledge CEM and Agilent Technologies for the instrumentation used in these experiments. M. G.-L. thanks the Spanish Ministry of Education and Science for an a FPU grant.References
- D. Hank Ellison, Handbook of Chemical and Biological Warfare Agents, CRC Press LLC, Boca Raton, 2000, ch. 1, p. 40 Search PubMed.
- Navy Warfare Library (located on the Reference Page) and the Navy Warfare Development Command SIPRNET Doctrine Discussion Group (DDG): http://www.nwdc.navy.mil/content/Library/Library.aspx.
- Spring-8, Research Frontiers 2006, Chap. Environmental Science, p. 122.
- B. Daus, J. Mattusch, R. Wennrich and H. Weiss, Talanta, 2008, 75, 376–379 CrossRef CAS.
- S. Oyama, S. Hanaoka, Cytotoxicity of Arsine Containing Chemicals Related to OCWs in Japan, CWD2007 (Brussels, 18 May, 2007) Search PubMed.
- Sang-Ho Nam, Jae-Jin Kim and Soung-Sim Han, Bull. Korean Chem. Soc., 2003, 24(12), 1805–1808 CAS.
- LDH Cytotoxicity Detection Kit Manual, Takara Bio Inc., Cat.# MK401, v.03.10, p. 4.
- C. Drahl, Chem. Eng. News, 2008, 86(34), 11.
- S. Hirano, Xing Cui, Song Li, S. Kanno, Y. Kobayashi, T. Hayakawa and A. Shiraim, Arch. Toxicol., 2003, 77(6), 305–312 CAS.
- T. Tsuchiya, T. Tanaka-Kagawa, H. Jinno, H. Tokunaga, K. Sakimoto, M. Ando and M. Umeda, Toxicol. Sci., 2005, 84(2), 344–351 CrossRef CAS.
- T. Nakayama, T. Isobe, K. Nakamiya, J. S. Edmonds, Y. Shibata and M. Morita, Magn. Reson. Chem., 2005, 43, 543–550 CrossRef CAS.
| This journal is © The Royal Society of Chemistry 2009 |