Direct analysis of cryptotanshinone and tanshinone IIA in biological samples and herbal medicinal preparations by a green technique of micellar liquid chromatography
Li
Zhu
a,
Li
Ding
a,
Qianli
Zhang
a,
Lin
Wang
a,
Fei
Tang
a,
Qian
Liu
a and
Shouzhuo
Yao
*ab
aCollege of Chemistry and Chemical Engineering, Hunan University, Changsha, 410082, China. E-mail: szyao@hnu.cn; aily8521845@163.com; Fax: +86 731-8821848; Tel: +86 731-8821968
bKey Laboratory of Chemical Biology and Traditional Chinese Medicine Research, Hunan Normal University, 410081, China
First published on 18th November 2008
Abstract
Nowadays, chromatographic methods are widely applied in contemporary chemistry, e.g.HPLC, HPLC–MS, etc. However, organic solvents are required here, sometimes even in large quantities, including toxic acetonitrile, methanol, etc. Hence, chemical methods with less or no use of organic solvents, the so-called green chemistry methods are attracting great interest. In this paper, a green micellar liquid chromatography (MLC) method is proposed, and the use of a micellar mobile phase to give a more sensitive and rapid separation than in conventional high-performance liquid chromatography (HPLC). As an example, the method was successfully applied to the analysis of cryptotanshinone (CT) and tanshinone IIA (TS), which are usually used as the bioactive markers in biological samples or herbal medicinal preparations. No extraction step is required. A C18 column and a micellar mobile phase of 0.15 M sodium dodecyl sulfate (SDS) and 6.4% n-butanol were used. No interferences were caused by proteins or endogenous compounds in the urine, serum samples and herbal medicinal preparations. The limits of detection (LODs) for CT and TS were 12.5 and 15 ng mL−1 in micellar solutions, 18 and 25 ng mL−1 in urine samples and 20 and 30 ng mL−1 in serum samples, respectively. Compared with conventional reversed-phase chromatography where methanol–water (75 : 25, v/v) is used as the mobile phase, the proposed MLC method is more sensitive and time-saving.
Introduction
At present, chromatographic methods are widely applied in chemical analysis.1 The liquid chromatography methods are rapid with high-resolution and are rather sensitive. With these advantages, liquid chromatography methods are being applied in many fields, such as biochemistry,2 environmental analysis,3food analysis,4etc. Chromatographic coupling techniques are also an important trend, e.g., HPLC–FLD,5HPLC–MS,6etc. However, these methods usually need a mass of organic, toxic or inflammable solvents (such as acetonitrile and methanol) as the mobile phase. Here, a green and sensitive micellar liquid chromatography (MLC) method has been proposed. Sodium dodecyl sulfate (SDS) is used to prepare the micellar mobile phase, which is non-toxic, non-flammable and relatively inexpensive. Moreover, as an application example, this method was successfully applied to the analysis of two hydrophobic bioactive compounds, cryptotanshinone (CT) and tanshinone IIA (TS), in biological samples and herbal medicinal preparations.CT and TS are the major active diterpenoid tanshinones contained in Radix Salvia miltiorrhiza (Danshen). They have attracted much attention due to their powerful and wide pharmacological activities including anticancer,7antioxidant8 and treating cell apoptosis in the HL60 human premyelocytic leukemia cell line.9 In quality control of the herbal medicinal preparations, they are usually used as the bioactive markers. Many methods have been reported for their determination including HPLC with UV detection10 and non-aqueous capillary electrophoresis.11 Recently, quantitative determination of biomarkers in biological samples such as plasma, urine or tissue homogenates has attracted much attention. Mass spectrometry detection methods have been developed for their determination.12 However, tandem mass spectrometry detection is rather expensive for common labs, and a great amount of organic and toxic solvent is used as the HPLC mobile phase. In addition, drugs may be strongly bound to proteins and numerous endogenous compounds in a complex matrix thus interfering with the analysis and contaminating the source of the mass spectrometer. So the precipitation of proteins and the extraction of drugs with an organic solvent must be performed before the analysis. The sample preparation is time-consuming and laborious.
In this work, to overcome such problems, the direct determination of chemical compounds in biological samples and herbal medicinal preparations by green MLC is proposed. The micellar mobile phase is environmentally friendly compared with the organic solvents used in conventional liquid chromatography. And the biological samples are analyzed without laborious separation of proteins and other interfering substances, as the micelles can bind proteins competitively, thereby releasing protein-bound drugs and proteins, rather than precipitating onto the column. In this way, direct analysis with no need for use of toxic or inflammable organic solvents is achieved and the cost and analysis time is greatly reduced and the separation efficiency significantly improved.
Experimental
The liquid chromatographic system (Shimadzu, Kyoto, Japan) consisted of two LC-20AT pumps, a CTO-10AS VP column oven and an SPD-M20A DAD system. These apparatus were connected via a communication bus module (Model CBM-20A) and controlled by a Shimadzu LC Solution workstation. A column of Ultimate™ XB-C18 (4.6 mm × 150 mm, 5 μm, Welch Materials Inc., USA) was utilized. A mobile phase consisting of 0.15 M SDS–6.4% (m/m) n-butanol fixed at pH 5 with hydrochloric acid was used, which was filtered though an 0.45 μm membrane before use. The flow rate was 1 mL min−1 and the injection volume was 20 μL. The chromatographic runs were carried out at 30 °C. DAD detection was monitored in the range of 210–600 nm. The detection wavelengths were 265 and 270 nm for CT and TS, respectively. The structures of CT (MW = 296) and TS (MW = 294) are shown in Fig. 1. A mixed stock solution containing CT (50 μg mL−1) and TS (50 μg mL−1) was prepared in methanol. Dilution was then performed using the selected micellar mobile phase. A series of standard working solutions was obtained in the range of 0.05–10 μg mL−1 for both CT and TS, respectively. The standard solutions were stored in the refrigerator and protected against light before use. The micellar mobile phase was prepared by dissolving appropriate amounts of SDS in ultra-pure water and after filtration n-butanol or n-propanol was added to achieve the desired concentration (m/m). The solution was adjusted to pH 5 with HCl.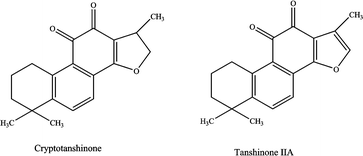 | ||
| Fig. 1 The chemical structures of cryptotanshinone and tanshinone IIA. | ||
Blank serum and urine samples were collected from volunteers in the Hospital of Hunan University (Changsha, China) and stored at 4 °C. Appropriate milliliters of stock solution of CT and TS were added to the blank urine and human serum solutions. The obtained samples were diluted by the micellar mobile phase and the final content of serum and urine in the solution was 10% (v/v). The biological samples were obtained in the range of 0.05–10 μg mL−1 for CT and TS, respectively. The solutions were then stored in the refrigerator and protected against light before use.
The Danshen medicinal preparations were presented in the form of pills and capsules. Ten pills or capsules, after removing the sugar-coat or capsule shell, were ground to a homogeneous powder in a mortar. 0.1 g samples were weighed out, and were extracted with 90% methanol aqueous solution (10 mL) under sonication for 30 min, and then centrifuged at 4024 × g for 5 min. The residue was extracted again with 5 mL of 90% methanol aqueous solution and centrifuged. The supernatants were combined, diluted ten times with the micellar mobile phase, and filtered through a 0.45 μm membrane prior to injection.
Results and discussion
Optimization of the mobile phase
In conventional chemical separations, organic solvents are widely used, e.g. in HPLC and HPLC–MS acetonitrile and methanol are used as the mobile phase, sometimes in large quantities, causing serious environmental problems. In this work, a green mobile phase, which was the solution of SDS with the addition of only very little organic-modifier, has been tested.When the pure micellar mobile phase of SDS was used as the mobile phase with the conventional pore size HPLC stationary phases, due to their strong hydrophobicity and the weak eluting power of the micellar mobile phases,13analytes could only be detected after more than half an hour, and the retention times were 30.41 and 37.32 min for CT and TS, respectively. In order to reduce the retention time of the analytes, the short chain alcohol of n-propanol and n-butanol were considered to modify the mobile phase. When 8.0% n-propanol or 8.0% n-butanol was added to 0.15 M SDS, the retention times of the two compounds decreased significantly. The main effect of the addition of alcohol is to reduce the amount of adsorbed surfactant on the stationary phase (with 8% n-butanol, from 30.41 and 37.32 min to 8.06 and 12.98 min for CT and TS, respectively), as well as to improve the poor wetting of the stationary phase when only aqueous micellar mobile phases are employed.14 Thereby the mass transfer of the analyte can be greatly improved, and the retention time is reduced significantly. The results are shown in Fig. 2. It is obvious that higher efficiency and better symmetry were obtained with the n-butanol and so n-butanol was chosen as the organic-modifier. Furthermore, the effect of the concentration of n-butanol in the micellar mobile phase was tested, and 1.6, 4.0, 6.4 and 8.0% of n-butanol in the micellar mobile phase at pH 3 were compared. The relationship between the concentration of n-butanol and the retention factor k′ value of the analytes is shown in Fig 3a. The retention factor k′ is calculated by the following equation:
 | (1) |
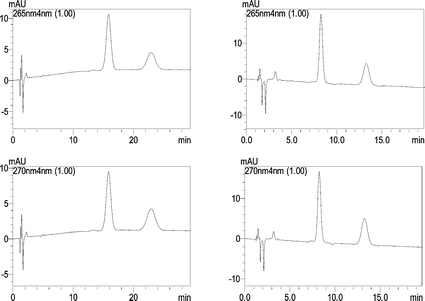 | ||
| Fig. 2 The chromatograms of CT (265 nm) and TS (270 nm) with 8.0% n-propanol (left) and 8.0% n-butanol (right) added to the micellar mobile phase (pH = 3). | ||
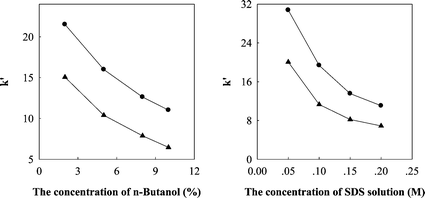 | ||
| Fig. 3 Left: The influence of the concentration of n-butanol in the micellar mobile phase on the retention factor k′ of CT (▲) and TS (●) (experiment conditions: 0.15 M SDS–n-butanol, pH 3). Right: The influence of the concentration of SDS on the k′ of CT (▲) and TS (●) (experiment conditions: SDS–6.4% n-butanol, pH 3). | ||
For further investigation, four different concentrations of 0.05, 0.10, 0.15 and 0.20 M of the SDS solutions, all modified by using 6.4% n-butanol and fixed at pH 3 and all above the critical micelle concentration of SDS were discussed. The relationship between the concentration of SDS and the retention factor k′ value of the analytes is shown in Fig. 3b. It was found that the retention factor k′ of the analytes was reduced by increasing the concentration of the SDS solution. When the middle concentration of 0.15 M was used, narrow peaks, good symmetry and smooth baselines were obtained.
The influence of pH was investigated in detail. In our preliminary study, we found that CT and TS could not be detected when the mobile phase pH was above 7. When the mobile phase was fixed at 3, 5 and 7, the peaks of the analytes were detected. This phenomenon may be related to the existing state of CT and TS under different pH. The positively charged forms of CT and TS are predominant from pH 3 to 7. The interaction of the protonated tanshinones at pH < 7 with the hydrophilic layer formed by the sulfate head groups of SDS reduces the penetration depth of the compounds into the bonded phase. Thus the retention time of the tanshinones is shortened. Better peak shapes were observed at pH 5. So pH 5 was chosen to carry out the experiments.
When adjusting the pH of the mobile phase, the ability of hydrochloric acid and 0.1 M phosphate buffer solution were compared. No significant differences between the peak shapes and retention times were observed in both cases, therefore, hydrochloric acid was selected for its convenience.
Based on the above results, 0.15 M SDS–6.4% n-butanol fixed at pH 5 was selected as the best mobile phase. Fig. 4 shows a typical chromatogram of the tanshinones under the optimized chromatographic conditions.
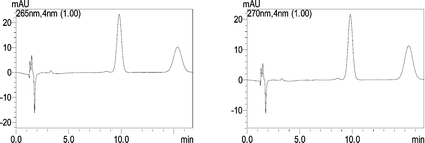 | ||
| Fig. 4 A typical chromatogram of CT (265 nm, left) and TS (270 nm, right) under optimized chromatographic conditions. | ||
The peaks are baseline separated and the shapes are symmetrical. The micellar mobile phase is compatible with a fluorescence detector. But in this work, the excited wavelength and emission wavelength of the selected mobile phase is similar to the analytes, which interfere in the detection sensitivity of the analyte. So a photodiode array detector was used instead in this work. By using the photodiode array detector (DAD), the maximum absorption wavelengths (λmax) of the target peaks were measured. The optimal wavelengths for the simultaneous analysis of CT and TS were set at 265 and 270 nm, respectively.
Method validation
The linearities of the analytes were studied in three different matrices: micellar solution, serum and urine, respectively. Limits of detection (LODs) of the analytes were measured with a signal-to-noise ratio of 3 set as the criterion. The results of slopes, intercepts, correlation coefficients (r2) and LODs are listed in Table 1. The results show good linearity (r2 > 0.998) of the calibration curves. No significant differences were found between the three different kinds of samples. The LODs of CT and TS were 12.5 and 15 ng mL−1 in micellar solutions, 20 and 30 ng mL−1 in serum samples and 18 and 25 ng mL−1 in urine samples, respectively.| Compound and matrix (n = 6) | Linear range/ng mL−1 | Slope | Intercept | r 2 | LOD/ng mL−1 | |
|---|---|---|---|---|---|---|
| CT | Micellar media | 50–10![[thin space (1/6-em)]](https://www.rsc.org/images/entities/char_2009.gif) 000 000 |
1.483 × 10² | −0.728 × 10⁴ | 0.9994 | 12.5 |
| Serum | 1.443 × 10² | −1.086 × 10⁴ | 0.9980 | 20 | ||
| Urine | 1.476 × 10² | −0.887 × 10⁴ | 0.9989 | 18 | ||
| TS | Micellar media | 50–10![[thin space (1/6-em)]](https://www.rsc.org/images/entities/char_2009.gif) 000 000 |
1.263 × 10² | −1.457 × 10⁴ | 0.9988 | 15 |
| Serum | 1.274 × 10² | −1.862 × 10⁴ | 0.9980 | 30 | ||
| Urine | 1.278 × 10² | −1.552 × 10⁴ | 0.9984 | 25 |
Under the optimized chromatography conditions, the intra-day and inter-day precision and accuracy of the method were evaluated by assaying five replicate spiked serum, urine samples and micellar media samples at three different concentration levels (low, mid and high quantification concentrations) of the tanshinones on the same day and on two consecutive days, respectively. The relative standard deviations (R.S.D.) of the intra-day and inter-day precision and accuracy values for spiked biological samples and micellar media samples are summarized in Table 2. The R.S.D. of the intra-day and inter-day precision were less than 2.7 and 3.5% for CT and TS, respectively. These results indicate that the present method has good accuracy and precision and it is suitable for analyzing the biological samples.
| Nominal conc./ng mL−1 | CT | TS | |||
|---|---|---|---|---|---|
| Mean accuracy (%) | R.S.D. of precision (%) | Mean accuracy (%) | R.S.D. of precision (%) | ||
| Intra-day (n = 6) | |||||
| Micellar media | 100 | 96.32 | 2.05 | 95.67 | 2.19 |
| 500 | 98.65 | 2.36 | 97.56 | 2.42 | |
| 5000 | 96.13 | 2.68 | 96.12 | 1.78 | |
| Serum | 100 | 95.88 | 1.97 | 97.45 | 2.69 |
| 500 | 97.74 | 2.64 | 96.53 | 2.01 | |
| 5000 | 97.69 | 2.03 | 97.24 | 1.56 | |
| Urine | 100 | 96.85 | 2.69 | 95.29 | 2.49 |
| 500 | 96.56 | 1.97 | 95.36 | 2.42 | |
| 5000 | 97.17 | 2.05 | 96.47 | 1.93 | |
| Inter-day (n = 6) | |||||
| Micellar media | 100 | 94.25 | 3.12 | 95.52 | 2.43 |
| 500 | 96.17 | 3.09 | 95.27 | 2.20 | |
| 5000 | 95.61 | 2.15 | 96.91 | 2.13 | |
| Serum | 100 | 95.26 | 2.29 | 96.43 | 2.49 |
| 500 | 96.35 | 3.04 | 95.15 | 2.98 | |
| 5000 | 95.90 | 3.16 | 96.27 | 3.16 | |
| Urine | 100 | 95.46 | 2.95 | 95.39 | 2.86 |
| 500 | 96.54 | 3.16 | 96.82 | 2.71 | |
| 5000 | 95.71 | 3.46 | 94.38 | 3.01 | |
The recovery of the method was studied using the standard addition method. The reference standards were added at three different concentration levels (low, mid and high concentrations of the matrix) with five parallels at each level. The recoveries of CT and TS in micellar solution, serum and urine matrices are shown in Table 3.
| Nominal conc./ng mL−1 | CT | TS | |||
|---|---|---|---|---|---|
| Mean recovery (%) | R.S.D. (%) | Mean recovery (%) | R.S.D. (%) | ||
| a n = 5. | |||||
| Micellar media | 100 | 97.38 | 1.86 | 97.26 | 2.81 |
| 500 | 98.63 | 2.34 | 102.94 | 2.24 | |
| 5000 | 101.43 | 2.51 | 99.18 | 1.90 | |
| Serum | 100 | 97.48 | 2.01 | 98.92 | 2.03 |
| 500 | 97.56 | 2.36 | 97.48 | 2.69 | |
| 5000 | 99.23 | 2.19 | 102.14 | 1.97 | |
| Urine | 100 | 96.97 | 2.43 | 101.06 | 2.18 |
| 500 | 101.86 | 2.57 | 97.86 | 2.97 | |
| 5000 | 99.45 | 2.90 | 98.35 | 3.04 | |
It can be seen that satisfactory recovery was obtained using the proposed method. A comparison with the reported hydro-organic HPLC method15 for the analysis of CT and TS is shown in Table 4. Wider linear ranges, shorter sample pretreatment times and higher recoveries were obtained for CT and TS, which are superior to the hydro-organic HPLC method.
Since a large quantity of serum or urine injected may damage the packing materials and shorten the life of the column, dilution of the sample prior to its injection was necessary to benefit the column, which can reduce the width of the protein band too. In this work, the blank and spiked drug serum and urine samples were diluted ten times before injection. Fig. 5A and C shows the representative chromatograms of blank serum and urine samples, respectively. Fig. 5B and D shows the chromatograms of the spiked serum and urine samples. No interference from the proteins and endogenous components of the urine and serum samples were observed, which shows the excellent specificity of the method for the determination of CT and TS with direct injection of the biological (serum and urine) samples.
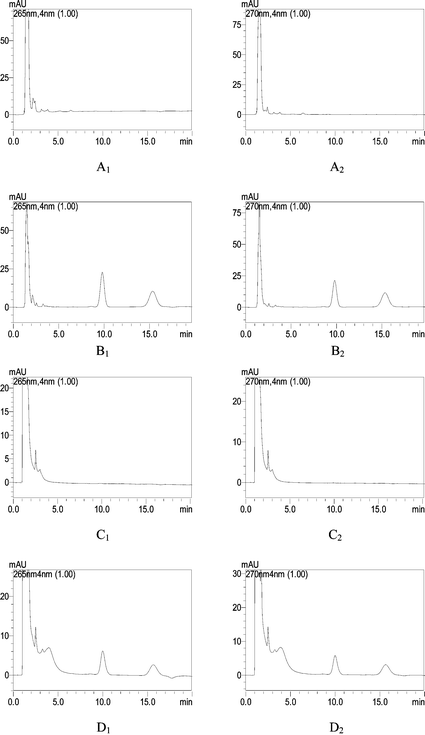 | ||
| Fig. 5 (A) The chromatogram of a blank urine sample at 265 and 270 nm. (B) The chromatogram of a spiked urine sample at 265 and 270 nm. CT (left) and TS (right) (5 μg mL−1). (C) The chromatogram of a blank serum sample at 265 and 270 nm. (D) The chromatogram of a spiked serum sample at 265 and 270 nm. CT (left) and TS (right) (2 μg mL−1). | ||
The proposed method was also applied to the analysis of the three Danshen medicinal preparations samples (Fu-Fang-Dan-Shen-Pian manufactured by two different companies and Guan-Xin-Shu-Tong-Jiao-Nang). Fig. 6 shows the chromatograms of the extracts of the preparations. The tanshinones contained in the samples were identified by the retention times of the standard tanshinones. No interference was found from other drugs accompanying the assayed drugs in the medicinal preparations. The contents of tanshinones were determined by the established regression equation. The results are listed in Table 5. The contents of CT and TS are quite different in different medicinal preparations, therefore, it is necessary to quality control the medicinal preparations. The developed MLC method can be used as a quality control and a detecting method for the tanshinones.
 | ||
| Fig. 6 Chromatograms of the Danshen medicinal preparations at 265 and 270 nm. | ||
| Samplesb | Contents determined/mg g−1a | |
|---|---|---|
| CT | TS | |
| a Mean ± standard deviation.b Herbal preparation1#: Guan-Xin-Shu-Tong-Jiao-Nang, 2#: Bai-Yun-Shan-Fu-Fang-Dan-Shen-Pian and 3#: Li-Li-Xin-Fu-Fang-Dan-Shen-Pian. | ||
| Herbal preparation1# | 0.299 ± 0.024 | 0.583 ± 0.020 |
| Herbal preparation2# | 0.459 ± 0.018 | 0.822 ± 0.015 |
| Herbal preparation3# | 0.293 ± 0.026 | 0.500 ± 0.023 |
Comparison of MLC with conventional reversed-phase liquid chromatography
In this work, the analysis ability of this MLC method was compared with conventional reversed-phase liquid chromatography, where methanol–water (75 : 25, v/v) or even acetonitrile is used as the mobile phase, while in this technique, only a micellar mobile phase (0.15 M SDS–6.4% n-butanol) is used. Hence, the use of hazardous substances is greatly decreased.In addition, the proposed method with a micellar mobile phase has the advantage of direct injection of the samples, avoiding complicated sample pretreatment and extraction procedures. In conventional aqueous–organic HPLC, the precipitation of protein is needed when analyzing biological samples, with methanol added into the spiked serum or urine samples (methanol 80%, v/v). The whole separation process is time-consuming: after vortex-mixing for 1 min, the solution is centrifuged at 3000 rpm for 10 min, the supernatant is evaporated to dryness under nitrogen flow at 30 °C, then the residue is reconstituted. However, no such complicated separation is needed in this work, an aliquot sample was simply injected into the LC system. Fig. 7 illustrates the chromatograms of the urine sample in MLC micellar mobile phase (left) and aqueous–organic HPLC (right). The analytes show that the retention times by MLC are only 9.68 and 15.01 min for CT and TS, respectively, while for the conventional hydro-organic HPLC, 11.68 and 18.73 min, respectively. Nevertheless, higher recoveries were obtained, which are superior to the hydro-organic HPLC method.
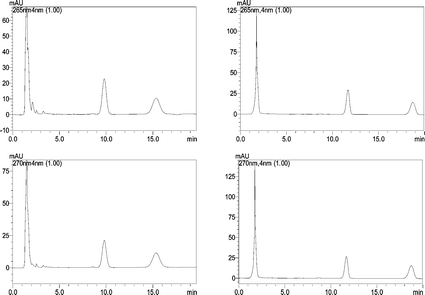 | ||
| Fig. 7 The chromatograms of the urine sample in the micellar mobile phase (left) and the hydro-organic mobile phase (right) at 265 and 270 nm for CT and TS, respectively. | ||
Conclusion
In this paper, a green MLC method is proposed. Here, instead of using toxic acetonitrile or flammable methanol, SDS with a small amount of n-butanol is proposed as a media for the analysis of biological samples and herbal medicinal preparations by MLC. The method was successfully applied to the analysis of bioactive compounds, CT and TS, in biological samples and herbal medicinal preparations. In comparison with the conventional HPLC method, this method is advantageous not only in it being “green” and less-toxic to living things and the environment, but also yielding a more rapid and sensitive separation than the conventional HPLC method. Hopefully, the new MLC method can also be used to separate the other classes of compounds.Acknowledgements
This work was financially supported by the National Basic Research Program (973 Program) (No. 2006CB504701) and the National Natural Science Foundation of China (No. 20575019 and 20335020).References
-
(a) B. J. Prazen, K. J. Johnson, A. Weber and R. E. Synovec, Anal. Chem., 2001, 73, 5677 CrossRef CAS
; (b) A. Lienau, T. Glaser, M. Krucker, D. Zeeb, F. Ley, F. Curro and K. Albert, Anal. Chem., 2002, 74, 5192 CrossRef CAS
; (c) G. E. Taylor, M. Gosling and A. Pearce, J. Chromatogr., A, 2006, 1119, 231 CrossRef CAS
.
- G. Suresh Kumar, S. M. Musser, J. Cummings and M. J. Tomasz, J. Am. Chem. Soc., 1996, 118, 9209 CrossRef
.
- R. M. Sara, J. L. A. Maria and B. Damià, Talanta, 2006, 69, 377 CrossRef CAS
.
- R. J. Pawlosky and V. P. Flanagan, J. Agric. Food Chem., 2001, 49, 1282 CrossRef
.
- T. Okuda, D. Naoi, M. Tenmoku, S. Tanaka, K. B. He, Y. L. Ma, F. M. Yang, Y. Lei, Y. T. Jia and D. H. Zhang, Chemosphere, 2006, 65, 427 CrossRef CAS
.
-
(a) S. Strohschein, C. Rentel, T. Lacker, E. Bayer and K. Albert, Anal. Chem., 1999, 71, 1780 CrossRef CAS
; (b) S. L. Yuan, X. J. Wang and Y. Q. Wei, Ai Zheng, 2003, 22, 1363 Search PubMed
(Article in Chinese).
- X. Wang, Y. Wei, S. Yuan, G. Liu, Y. Lu, J. Zhang and W. Wang, Int. J. Cancer, 2005, 116, 799 CrossRef CAS
.
- E. H. Cao, X. Q. Liu and J. F. Li, Acta Biophys. Sin., 1996, 12, 339 Search PubMed
.
- Y. Yoon, Y. O. Kim, W. K. Jeon, H. J. Park and H. J. Sung, J. Ethnopharmacol., 1998, 68, 121
.
- A. Chen, C. Li, W. Gao, Z. Hu and X. Chen, J. Pharm. Biomed. Anal., 2005, 37, 811 CrossRef CAS
.
- A. J. Che, J. Y. Zhang, C. H. Li, X. F. Chen, Z. D. Hu and X. G. Chen, J. Sep. Sci., 2004, 27, 569 CrossRef
.
-
(a) J. Li, G. J. Wang, P. Li and H. P. Hao, J. Chromatogr., B: Anal. Technol. Biomed. Life Sci., 2005, 826, 26 CrossRef CAS
; (b) H. P. Hao, G. J. Wang, P. Li, J. Li and Z. Q. Ding, J. Pharm. Biomed. Anal., 2006, 40, 382 CrossRef CAS
; (c) P. Li, G. J. Wang, J. Li, H. P. Hao and C. N. Zheng, J. Chromatogr., A, 2006, 1104, 366 CrossRef CAS
.
- A. S. Kord and M. G. Khaledi, Anal. Chem., 1992, 64, 1894 CrossRef CAS
.
- D. P. Thomas and J. P. Foley, J. Chromatogr., A, 2007, 1149, 282 CrossRef CAS
.
- M. Xue, Y. Cu, H. Q. Wang, Z. Y. Hu and B. Zhang, J. Pharm. Biomed. Anal., 1999, 21, 207 CrossRef CAS
.
| This journal is © The Royal Society of Chemistry 2009 |
