Plastic waste as a fuel - CO2-neutral or not?
Ola
Eriksson
*a and
Göran
Finnveden
b
aDivision of Building Quality, Department of Technology and Built Environment, University of Gävle, Gävle, SE 801 76, Sweden
bDivision of Environmental Strategies Research – fms, Department of Urban Planning and Environment, School of Architecture and the Built Environment, KTH (Royal Institute of Technology), Stockholm, SE 100 44, Sweden
First published on 28th July 2009
Abstract
Municipal solid waste (MSW) is not only a societal problem addressed with environmental impact, it is also a resource that can be used for energy supply. In Northern Europe combustion of MSW (incineration with energy recovery) in combination with district heating systems is quite common. In Sweden, about 47% of the household waste is treated by incineration with energy recovery. Most incineration plants are CHP, summing up to 0.3% of the total electricity generation. MSW is to a high extent a renewable fuel, but plastic, rubber etc. can amount to 50% of the carbon content in the waste. Recycling of plastic is in general environmentally favourable in comparison to landfill disposal or incineration. However, some plastic types are not possible to recycle and some plastic is of such low quality that it is not suitable for recycling. This paper focuses on the non-renewable and non-recyclable plastic in MSW. A CO2 assessment has been made for non-recyclable plastic where incineration with energy recovery has been compared to landfill disposal. In the assessment, consideration has been taken of alternative fuel in the incinerator, emissions from waste treatment and avoided emissions from heat and power supply. For landfill disposal of plastic the emissions of CO2 amounts to 253 g kg−1 plastic. For incineration, depending on different discrete choices, the results vary from −673 g kg−1 to 4605 g kg−1. Results indicate that for typical Swedish and European conditions, incineration of plastics has net emissions of greenhouse gases. These emissions are also in general higher for incineration than for landfill disposal. However in situations where plastics are incinerated with high efficiency and high electricity to heat ratios, and the heat and the electricity from incineration of plastics are replacing heat and electricity in non-combined heat and power plants based on fossil fuels, incineration of plastics can give a net negative contribution of greenhouse gases. The results suggest that efforts should be made to increase recycling of plastics, direct incineration of plastics in places where it can be combusted with high efficiency and high electricity-to-heat ratios where it is replacing fossil fuels, and reconsider the present policies of avoiding landfill disposal of plastics.
Broader contextThe awareness of climate change has increased dramatically during the last years. Many societal activities contribute to emissions of gases contributing to climate change, amongst them waste management including emissions of fossil CO2 from incineration of waste and CH4 from degradation of organic material in landfills. Recycling of plastics is often possible and many studies have shown that material recycling is in general the best waste treatment option from an environmental perspective. But what is the best treatment option for non-recyclable plastic; incineration or landfill disposal? In this paper we compare and assess these two options. For both methods energy (both as electricity and heat) can be recovered. Our results indicate that for plastics, landfill disposal is often preferable over incineration regarding emissions of gases contributing to climate change. |
Introduction
Municipal solid waste (MSW) contains resources from society that can be recovered as material or energy. In a global perspective MSW is mostly disposed of at landfill with no or poor resource recovery. The waste production per capita changes widely between different countries, in Fig. 1 municipal solid waste generation in European countries is depicted.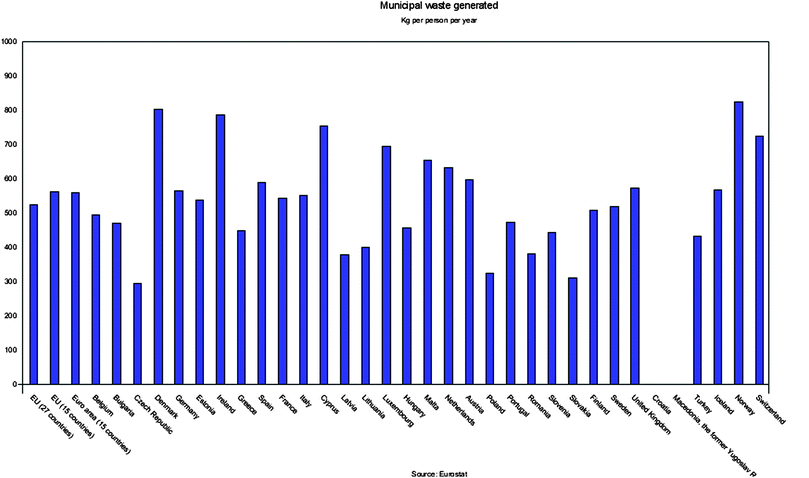 | ||
| Fig. 1 Waste generation in European countries during 2007 in kg/capita.1 | ||
MSW will be more important as a resource in the future as the amount of waste increases. For example, the amount of household waste has increased by 23.8% during 1998–2007 in Sweden.2 This trend is also valid for waste from other sources and in other countries.1
In Northern Europe combustion of MSW (incineration) in combination with district heating systems is quite common. In Sweden, a country with a high degree of material recycling (37%) and biological treatment (12%), about 47% of the household waste is treated by incineration with energy recovery.2 Incineration accounts for approx. 25% of the district heating generated in Sweden where residential heating as well as process heat is included.2 Most incineration plants recover not only heat but also electricity (Combined Heat and Power, CHP), summing up to 18% of the electricity generation from CHP in Swedish district heating3 which corresponds to 0.3% of the total electricity generation.4 In many other countries, energy from waste incineration is mostly recovered as electricity with varying efficiencies. Energy recovery from waste can also be achieved by anaerobic digestion producing biogas that can replace fossil fuels for transport or be used for heat and power production.
Compared to other fuels used in heat and power supply, municipal solid waste has both advantages and disadvantages with respect to technology, environmental impact and financial costs. One advantage is that MSW often has a low initial burden. Only some collection and transportation is required. Other fuels often have costs and environmental impacts also from the production of the fuels. MSW is also a fuel available close to the end user. Due to urbanisation people tend to live in cities or greater residential areas. This means high waste generation per km2 which in turn makes the cost for waste collection less expensive than in sparsely populated areas. Another aspect is that, compared to material recycling and biological treatment, incineration plants are robust with respect to waste quality. The plants are designed to be able to treat bulky heterogeneous waste. Another advantage can be observed for fuel economy with respect to the owner of an incinerator. Even if some costs are higher due to expensive cleaning equipment, revenue from sold energy is supported by a reception fee for the waste fuel. This makes MSW competitive with e.g. biomass as base load in district heating systems.
Nevertheless, MSW is a more troublesome fuel compared to other fuels due to its heterogeneity. Here pre-treatment and recycling helps, as the combustible fraction then becomes more homogenous since a well developed sorting (both at source or at a MRF (Material Recovery Facility) can produce more clean combustible flows where different materials are not mixed. The variable fuel quality gives rise to problems during the combustion process which requires an advanced and expensive air pollution control and management of residues. Even if the overall degree of efficiency can be high due to flue gas condensation, the electricity-to-heat ratio is in general lower than for e.g. wood combustion, which in turn in general is lower than for oil and natural gas combustion.
Within the European Union as well as in many other countries, waste policy is based on the waste hierarchy:5
1. Waste prevention
2. Re-use of products
3. Recycling of material
4. Recovery of energy
5. Final disposal
A large number of studies have been looking into the environmental aspects of different waste management strategies. There are also several synthesis reports available.6–9 These studies seem to suggest that the waste hierarchy in general is valid from an environmental perspective. There can however be situations, or waste fractions, which deviate from the hierarchy. In this paper we will investigate one such possible exception and that is the treatment of plastic wastes concerning carbon dioxide and other gases contributing to climate change.
MSW is partly a renewable fuel which is regarded as not contributing to climate change. However, the waste often includes plastic and (synthetic) rubber that is produced from fossil fuels, thus being non-renewable fuels contributing to climate change. The fossil content in MSW can be measured in different ways; by weight percent, energy percent or carbon percent. The balance between biogenic and fossil carbon dioxide will vary between different countries and incinerators depending on the type of waste that is incinerated, recycling programs etc. One recent Swiss study indicated that the biogenic fraction is about 50% or slightly more.10 One American study11 indicated that the biogenic fraction was approx. 65%. Recycling of plastic is in general environmentally favourable in comparison to landfill disposal or incineration.6–9 However, some plastic types are not technically possible to recycle, some may be too expensive to recycle and some plastic is of such poor quality that it cannot be recycled. That means, that even with 100% source separation of plastic (no plastic found in the combustible fraction of MSW), there will be some non-recyclable plastic that has to be treated.
Plastic is usually made out of crude oil (bio-plastics are not of fossil origin and give no net increase of CO2 when combusted) and is chemically of two types: thermoplastic and thermoset. Thermoplastic, if exposed to heat, will melt and is therefore possible to reshape and recycle. Thermoset on the other hand will keep their shape until they are a charred, smoking mess. Thermoset are however possible to shred and the chips can then be used as filling material or reinforcement material in new products. Thermoset plastics go under product names such as polyurethane (PUR), acryl, epoxy and different variants with formaldehyde like Urea Formaldehyde (UF), Melamine Formaldehyde (MF) and Phenol Formaldehyde (PF). Common applications are e.g. small boats, pipes and cable isolation.12 Thermoplastic can be recycled several times but eventually the quality is too poor. Another reason why a potentially recyclable plastic is sorted out at the recycling plant is due to impurity. Therefore not only thermoset, but also thermoplastic can be subject to energy recovery. Besides, plastic products other than packages are collected at recycling centres. This plastic, which can be of both types, is in Sweden often incinerated in cement kilns or regular incinerators due to it not being included in the system for producers' responsibility. Landfill disposal is prohibited in many countries including Sweden. Most of the plastic packages in MSW are incinerated, cf.Table 1.
| Waste management | Amount (ton) | Percentage (%) |
|---|---|---|
| Source separated, material recycling | 49 119 | 30.1 |
| Source separated, energy recovery | 56 434 | 34.5 |
| Not source separated, incineration and landfill disposal | 57 842 | 35.4 |
Aim of the paper
This paper will determine under which circumstances incineration of plastics as a part of MSW may have a zero or negative impact on global warming;1. Combustion of the fossil part (plastic) will cause CO2 emissions, but are the avoided emissions from substituted fuels higher?
2. Is non-recyclable plastic better treated in a sanitary landfill with respect to global warming in a short time perspective?
3. Are steps 4–5 in the waste hierarchy correct for non-recyclable plastic?
Method
Goal and scope definition
A CO2 accounting is made for waste treatment of 1 kg of non-recyclable plastic. The methodology used is based on established methods for environmental Life Cycle Assessment (LCA) of waste management systems13,14 and the ISO-standard for LCA (ISO, 2006).15 Two types of plastic are investigated: non-recyclable and a mixed fraction of presumed poor quality. The plastic waste itself has a zero burden when entering the waste management system. This assumption can be made since the plastic waste (in terms of density) is identical in the two cases compared (landfill disposal and incineration) and identical parts of the systems can be excluded in a comparative study.13,14 The waste treatment options are incineration with energy recovery which has been compared to landfill disposal. In the assessment, consideration has been taken of GHG emissions (CO2, CH4 and N2O) from waste treatment and avoided emissions from heat and power supply.Two scenarios are being compared. In the first scenario the plastics are subject to sanitary landfill disposal. Parameters of concern are
• Emissions from landfill management
• Carbon sequestration in landfill (not carbon sink as the carbon is fossil)
In the second scenario the plastics are subject to incineration with combined heat and power (CHP). Parameters of concern are
• Emissions from the incineration plant
• Avoided emissions from other electricity generation
• Avoided emissions from other heat generation
The assessment is based on data for Swedish and European conditions. Choice of data has been made to achieve CO2-lean and CO2-intense alternatives to explore as wide a span as possible. The assessment is thought to cover both consequential and book-keeping conditions (c.f.ref. 16) and represents a short time perspective with existing plants rather than a long time perspective with improved technology.
Data inventory
Parameters crucial to GWP impact have been identified and data acquisition has been made. Concerning the plastic, two properties are of interest: heat value and chemical composition (in this case the fossil carbon content). Heat values vary between different plastics depending on the molecular structure. The calculations use the higher heating values because incinerators in Sweden are equipped with flue gas condensation and the condensation heat recovered is included in figures on efficiency and total energy recovery. For example PVC has a heat value of 19 MJ kg DM−1 meanwhile one of the most common thermoplastics Polyethene has 46 MJ kg DM−1. The values depicted in Table 2 have been used.| Plastic property | Value | Unit | Ref. |
|---|---|---|---|
| a The values for mixed plastic are mean values from four different analyses of household waste fractions. | |||
| Dry matter, non-recyclable | 95 | % | 17 |
| Dry matter, mixed plastica | 93 | % | 18 |
| Heat value, non-recyclable | 32.26 | MJ kg−1 | 17 |
| Heat value, mixed plastic | 38.94 | MJ kg−1 | 18 |
| Fossil carbon content, non-recyclable | 0.6560 | kg kg−1 wet waste | 17 |
| Fossil carbon content, mixed plastic | 0.6935 | kg kg−1 wet waste | 18 |
The next step would be collection and transport of the plastic to a treatment plant. This step is omitted, based on the aforementioned assumption and also that we have assumed the distance from the point of collection to a sanitary landfill and to an incinerator to be the same.
Regarding the landfill it is primarily a question of to what extent the plastic is decomposed and also which time frame to use. If plastic is degraded in the landfill we will attain air emissions of CO2 and CH4, but on the other hand some of the landfill gas could be extracted and collected with energy recovery and therefore saving other fuels. The energy recovery suffers from a low efficiency compared to incineration with energy recovery. The result for the landfill is the accumulated estimated emissions (and energy recovery) during a period of approx. 100 years, a time frame commonly used for landfills in LCA and also to comply with the weighting factors used.
In this assessment we have assumed that the plastic will be degraded by 3% during the first century due to a chemical reaction19 whereas 70% of the degraded carbon will form methane with a yield of 0.025 kg CH4 kg−1 plastic. We have assumed that 50% of the methane is collected and combusted. The rest is emitted, but 15% is released as CO2 due to soil oxidation in the top layer.19 The collected landfill gas is combusted in a gas engine with 85% degree of efficiency where 37.5% of the useful energy is recovered as electricity.20 Besides emissions of CO2 the gas engine emits methane (430 mg MJ−1 CH4) and also N2O (31 mg MJ−1 CH4).20 There will also be some emissions of CO2 due to landfill management (mainly for compacting and creating a sealing cover). The energy consumption is 0.04 MJ kg−1 plastic21 and emission factors are taken from ref. 18.
If the plastic is put in an incinerator we assume complete combustion. Following parameters are then of interest for the incineration plant:
1. Degree of efficiency
2. Heat and power plant versus heat plant
3. Emission factor for N2O
The degree of efficiency may vary widely from plant to plant. The following figures are taken from ref. 22. In Sweden 20 incineration plants are operative while ten plants are for heat generation only and combust 31% of all MSW and the others are CHP. For this purpose we have not chosen data from one single plant, instead we use Swedish average values for the total heat and power production. In the Swedish case we have used a mean value for all Swedish incinerators in 2006 which is 80%. Of the useful energy 8.2% is released as electricity and 91.8% as heat. If we had used an average Swedish CHP the figures would be 12% electricity and 88% heat. In the same report we found mean values for European incinerators with data from CEWEP. The average degree of overall efficiency is reported to be 41% and energy recovered as electricity is 26% and heat 74%. Another study in this field23 calculates electricity production at 13%, 24% or 28% and the corresponding values for heat generation of 70%, 55% and 0%. Both degree of efficiency and the electricity-to-heat ratio may have a strong influence on the results; therefore we will test the influence of these parameters in a sensitivity analysis. Emissions of N2O may also vary for different plants and is not restricted in the incineration directive. We use the figure 0.69 mg MJ−1.24
The alternatives to heat and power from combustion of plastic come next. Let's begin with district heating. The fossil intense alternative was chosen to oil combustion. Oil is no longer a common fuel in Swedish district heating, in 2007 it accounted for just about 3.5%.3 Hard coal accounted for 4%. But even if these remaining parts soon will be substituted there may be a secondary effect as some residential oil heating still can be replaced by district heating. On a European level there is still high oil consumption for heating purpose.1 Emission factors for CO2, CH4 and N2O were collected from ref. 25.
The fossil lean alternative is biomass combustion in a CHP. In a decision situation where a new base load heat plant is to be built in Sweden, an energy company often has a choice between building a biomass fired boiler, or an incinerator when considering costs and technical aspects. Bringing in a CHP as an alternative heat source makes the assessment a bit more complicated due to the fact that not only heat but also electricity is generated. Fig. 2 shows a simplification of the alternatives in terms of energy balance. A CHP for MSW generates roughly 80% of the energy as heat and 20% as electricity. In the first case (alternative I) oil combustion will be substituted for heat and also a corresponding amount of avoided electricity (we will come to the fuels for electricity later). In the second case (alternative II) the incinerator will substitute biofuel CHP based on heat production. For every unit of heat the biofuel CHP will also generate some electricity. This electricity production is “lost” and may even be larger than the electricity from the incinerator (30% in Fig. 2) as a biomass CHP often has a higher electricity-to-heat ratio than an MSW CHP. Compared to the oil case where the sum of heat and electricity from MSW and alternative 1 is zero, the biomass CHP alternative leads to a net loss of electricity (−10%). This is compensated for by adding the missing electricity production, shown as the last bar to the right in the figure (alternative II). The biomass CHP in this study has energy recovery with 27% electricity and 72% heat and with related emissions; taken from ref. 25.
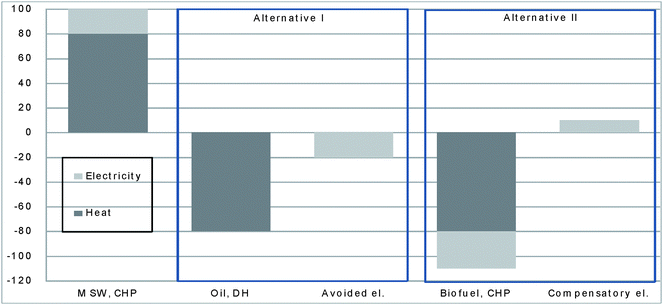 | ||
| Fig. 2 Energy balance for different fuel alternatives. Units in % of energy release. | ||
Last but not least, consideration must be made to compensatory electricity. In the literature researchers and others use different approaches depending on the purpose and choose data from different sources and years. As the uncertainties are huge we follow the recommendation to use both a fossil rich and a “fossil free” alternative.26 We have not tried to collect and review as many studies as possible, but more to find relevant options but with extreme values (reasonable figures while covering both high and low GWP). We have included wind power as fossil lean and coal condense power as fossil intense. Wind power has an emission factor of 0.0607 g CO2kWh−125 and for coal condense the emission factor has been chosen/set to 1000 g CO2kWh−1.
Impact assessment
Table 3 gives the characterisation factors for GWP:27| Emission | CO2-equivalents |
|---|---|
| Carbon dioxide, CO2 | 1 |
| Methane, CH4 | 25 |
| Nitrous oxide, N2O | 298 |
Calculations
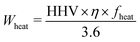
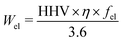
The calculation of CO2-emissions from landfill disposal consists of a sum of decomposition, soil oxidation of methane, direct methane emissions and emissions and electricity generation from methane combustion. These calculations are left out due to space limits. Given the properties for plastic (Table 2) and parameters for the incineration plant (Table 4) the CO2 emissions and the generation of heat and power can be calculated using the following formula.
| E CO2 = Mc × (nCO2/nC) × 1000 + (EN2O/1000) × cfN2O × HHV × η | (1) |
| (2) |
| (3) |
| Quantity | Unit | Symbol | Value |
|---|---|---|---|
| a Note: 1 kWh = 3.6 MJ. | |||
| Carbon content | kg C kg−1 plastic | Mc | waste specific |
| Molar weight for CO2 | g mol−1 | n CO2 | 44 |
| Molar weight for C | g mol−1 | n C | 12 |
| Emission factor N2O | mg MJ−1 | E N2O | 0.69 |
| Emission factor CO2 | g CO2 | E CO2 | waste specific |
| Characterisation factor N2O | 1 | cfN2O | 298 |
| Higher Heating Value | MJ kg−1 | HHV | waste specific |
| Degree of efficiency | 1 | η | 0.80 or 0.41 |
| Heat recovery | kWh | W heat | waste specific |
| Part energy to heat | 1 | f heat | 91.8% or 74% |
| Electricity recovery | kWh | W el | waste specific |
| Part energy to electricity | 1 | f el | 8.2% or 26% |
| Landfill disposal of 1 kg of plastic | Non-recyclable | Mixed |
|---|---|---|
| Waste treatment | ||
| Degradation | 5.90 | 6.24 |
| Landfill gas emissions | 271 | 271 |
| Landfill management | 3.01 | 3.01 |
| Energy recovery | ||
| Heat, kWh | 0 | 0 |
| Electricity, kWh | 0.061 | 0.061 |
| Air emissions gas combustion | 35 | 35 |
| Avoided electricity | ||
| Coal condense power (1000 g CO2kWh−1) | −61 | −61 |
| Sum | 253.971 | 254.311 |
Results
Given the data above a fossil carbon accounting has been carried out. Results for landfill disposal of plastic are depicted in Table 5.The majority of the carbon in the material will be stored inside the landfill and prevented from release to the atmosphere. However, air emissions (mainly as methane) and the generated electricity cause maximum savings of 61 g (coal condense) resulting in approx. 254 g CO2 eq. kg−1 of plastic. The results for the more complex assessment of incineration of 1 kg of plastic are presented in Table 6. From this a number of combinations can be derived which are listed in Table 7.
| Incineration of 1 kg plastic | Sweden | Europe | ||
|---|---|---|---|---|
| Non-recyclable | Mixed | Non-recyclable | Mixed | |
| Waste treatment | ||||
| GWP emissions | 2411 | 2549 | 2408 | 2546 |
| Specific GWP emission, g CO2kWh−1 | 337 | 296 | 650 | 569 |
| Energy recovery | ||||
| Heat, kWh | 6.6 | 7.9 | 2.8 | 3.3 |
| Electricity, kWh | 0.6 | 0.7 | 0.9 | 1.1 |
| Avoided heat | ||||
| Biomass CHP (19 g CO2kWh−1) | −123 | −148 | −52 | −62 |
| Electricity from biomass CHP, kWh | 2.46 | 2.97 | 1.03 | 1.25 |
| Oil (318 g CO2kWh−1) | −2083 | −2515 | −876 | −1058 |
| Avoided electricity | ||||
| Wind power (0.06 g CO2kWh−1) | −0.04 | −0.04 | −0.06 | −0.07 |
| Coal condense power (1000 g CO2kWh−1) | −586 | −707 | −949 | −1145 |
| Compensatory electricity | ||||
| Wind power (0.06 g CO2kWh−1) | 0.11 | 0.14 | 0.01 | 0.01 |
| Coal condense power (1000 g CO2kWh−1) | 1873 | 2261 | 86 | 103 |
| Combination | Incineration of plastic | Avoided heat | Avoided electricity | Compensatory electricity | Sum | |
|---|---|---|---|---|---|---|
| a he = heat; el = electricity. | ||||||
| Non-recyclable plastic | ||||||
| 1 Sweden, bio CHP (he), wind (el) | 2411 | −23 | −7 | +0.11 | = | 2241 |
| 2 Sweden, bio CHP (he) coal cond. (el) | 2411 | −23 | −7 | + 1873 | = | 4114 |
| 3 Sweden, oil (he) wind (el) | 2411 | − 083 | −.04 | +0 | = | 327 |
| 4 Sweden, oil (he) coal cond. (el) | 2411 | − 083 | −86 | +0 | = | −59 |
| 5 Europe, bio CHP (he), wind (el) | 2408 | −2 | −0 | +0.01 | = | 2337 |
| 6 Europe, bio CHP (he), coal cond. (el) | 2408 | −2 | −0 | +86 | = | 2422 |
| 7 Europe, oil (he), wind (el) | 2408 | −76 | −.06 | +0 | = | 1532 |
| 8 Europe, oil (he), coal cond. (el) | 2408 | −76 | −49 | +0 | = | 583 |
| Mixed plastic | ||||||
| 9 Sweden, bio CHP (he), wind (el) | 2549 | −48 | −6 | +0.14 | = | 2345 |
| 10 Sweden, bio CHP (he), coal cond. (el) | 2549 | −48 | −6 | +2261 | = | 4605 |
| 11 Sweden, oil (he), wind (el) | 2549 | − 515 | −.04 | +0 | = | 35 |
| 12 Sweden, oil (he), coal cond. (el) | 2549 | − 515 | −07 | +0 | = | −73 |
| 13 Europe, bio CHP (he), wind (el) | 2546 | −2 | −4 | +0.01 | = | 2460 |
| 14 Europe, bio CHP (he), coal cond. (el) | 2546 | −2 | −4 | +103 | = | 2563 |
| 15 Europe, oil (he), wind (el) | 2546 | − 058 | −.07 | +0 | = | 1488 |
| 16 Europe, oil (he), coal cond. (el) | 2546 | − 058 | −1 145 | +0 | = | 343 |
Discussion and conclusions
As can be seen from Table 7, most cases result in net emissions of greenhouse gases. Also in most cases, the emissions are higher than for the landfill case.Two combinations out of sixteen in Table 7 end up as a reduction of CO2 emissions, namely for Swedish conditions and when fossil fuel alternatives for both heat and power are present. As noted above, the present situation in Sweden with current infrastructure, only small amounts of fossil fuels are used, making these scenarios less relevant for the current Swedish situation. If wind power is applied, when all other preconditions are kept constant, a minor positive contribution (35 g) is found for mixed plastic whereas non-recyclable plastic is higher with 327 g. The result for mixed plastic (327 g) cannot be considered as robust, as the other combinations with wind power electricity (odd numbers) have much higher emissions. Looking at the overall results the highest net contributions are found for combinations including biomass CHP. The two most extreme in this regard (# 2 and 10) suffer a high contribution from compensatory electricity, i.e. lost electricity generation from biomass CHP that has to be compensated for by coal condense power. The combinations with biomass CHP and wind power (1, 5, 9 and 13) are lower but still higher than all combinations involving oil heat. The big benefit is substitution of oil heat, which is logical as most of the released energy will be recovered as heat (else the degree of efficiency is poor as the heat is lost).
In the discussion we will elaborate on the results from the assessment. First the robustness of the results is examined. For robustness it is meant that if vital preconditions are slightly changed the conclusions will not change. This can be tested in a sensitivity analysis.
The importance of degree of efficiency
To test this we apply the European figure to the Swedish incineration plants. Now no combination ends up with total negative emissions. The degree of efficiency must be at least 0.65–0.7 to shift at least one of the possible two options (4 and 12) into total negative emissions.The importance of MSW CHP
When we assume that the Swedish plants are for district heat only combinations 3–4 result in 141 g CO2 and combinations 11–12 end up as −190 g CO2. Given oil heat substitution (which is common for all these combinations) MSW CHP is not beneficial if the electricity is fossil lean (initial emissions for combinations 3 and 11 were higher) where minor savings on “clean” electricity are less favourable than major savings in oil heat. Likewise MSW CHP is preferred if the electricity is fossil intense (compare emissions for combinations 4 and 12). These results suggest that CHP is important, particularly when fossil intense electricity like coal condense power is substituted.The importance of high electricity-to-heat ratio
By changing the degree of efficiency for the European incinerator from 0.41 to 0.80 we will compare two incinerators with different electricity-to-heat-ratios (8.2/91.8 = 0.09 and 26/74 = 0.35). Now combinations 8 and 16 become the most favorable options with −1106 (583) and −1696 (343) g CO2. When comparing the new results with the initial results for all combinations we conclude that given coal condense power it is better to have a high ratio. For wind power and oil heat it is worse to have a high ratio (less beneficial to replace fossil lean electricity generation), but for wind power and biomass CHP it does not matter as the results are almost the same.The importance of fuel for CHP plant
In the study it was assumed that the fuel for the CHP plant was biofuel. If the fuel had been a fossil fuel, two contradictory things would have happened. On the one hand incineration of plastic waste would look better, since it is replacing a fossil fuel. On the other hand, more electricity would be produced from the CHP plant when a fossil fuel is used instead of a biofuel since the electricity-to-heat ratio typically is higher for oil and gas plants than for biofuel plants. If this extra electricity replaced fossil fuels instead, incineration of plastics would appear worse.The next step would be to explore the limitations of the study. Are accuracy and scope important to the conclusions? The first limitation to address is that the time frame is short. In the long term the plastic will be degraded further, the incinerators may operate differently and the alternative fuel options may be others. The second limitation is that the assessment covers only CO2. In a complete LCA, where toxic substances would be included, the conclusions may be different, due to the fact that additives in the plastic may leach and products of degradation are formed in the landfill. On the other hand emissions of toxic substances from incineration and landfill disposal of combustion residue can be avoided. This could be worked around by further steps in the assessment beyond the carbon accounting. Emissions to air and water of other pollutants, the lack of resource recovery at many landfills worldwide, problems with uncontrolled landfill fires and pests are some of the problems not addressed in this paper. We believe that more detailed calculations using computer models (waste models like ORWARE or EASEWASTE and eventually full LCA using SimaPro or similar) is called for if (1) the carbon accounting does not show clear results (if different scenarios/alternatives are almost equal to each other) and (2) we want to capture other environmental impacts than GWP. Another assumption that may inflict on the results is if the collection and transport work differs depending on treatment. Collection and transport of waste is usually very expensive in comparison to the treatment cost. The environmental impact is the opposite (low for collection and transport in comparison to the treatment). Therefore collection and transport is often made as efficient as possible. There may however be situations where this assumption is not correct.
Coming back to the questions raised earlier we will draw conclusions on
1. What is the environmentally best treatment option for non-recyclable plastic—landfill disposal or incineration? If the question is narrowed down to GWP, landfill disposal can often be the least polluting treatment option.
2. Under which circumstances is landfill disposal or incineration preferable? Incineration is to be preferred given a high efficiency, a high electricity-to-heat ratio and when energy from incineration replaces fossil fuels, at least for district heating.
3. Under which circumstances can MSW be considered as CO2- neutral? See answer to question 2.
Finally we expand the discussion to encompass conclusions on what to do with plastics presently not being recycled in Sweden:
1. Develop recycling technologies for thermoset plastics.
2. Stop incineration of plastic unless the incinerator is an efficient CHP replacing oil heat and coal condense power.
3. Convert the plastic into a waste fuel which can be exported to countries where it can be combusted with high efficiency and substitute fossil fuels.
4. Reconsider the policy not to landfill plastic materials.
Acknowledgements
Financial support from the Swedish Environmental Protection Agency is appreciated.References
- Eurostat, 2009, http://epp.eurostat.ec.europa.eu/ Search PubMed.
- AvfallSverige, 2008a, Swedish Waste Management. Report available at http://www.avfallsverige.se Search PubMed.
- Svensk Fjärrvärme, 2009, http://www.svenskfjarrvarme.se.
- AvfallSverige, Energi från avfall ur ett internationellt perspektiv (Energy from waste in an international perspective). Report 2008:13 (In Swedish), 2008b Search PubMed.
- Directive 2008/98/EC of the European Parliament and of the Council of 19 November 2008 on Waste and Repealing Certain Directives, EU, 2008 Search PubMed.
- A. Björklund and G. Finnveden, Recycling revisited - life cycle comparisons of waste management strategies, Resour., Conserv. Recycl., 2005, 44, 309–317 CrossRef.
- M. Olofsson, J. Sundberg & J. Sahlin, Evaluating waste incineration as treatment and energy recovery method from an environmental point of view, 13th Annual North American Waste-to-Energy Conference, 2005, Orlando, Florida, May 23–25 Search PubMed.
- S. Tyskeng and G. Finnveden, Comparing energy use and environmental impacts of recycling and waste incineration, J. Environ. Eng., 2009 Search PubMed , submitted.
- WRAP, Environmental benefits of recycling - an international review of life cycle comparisons for key materials in the UK recycling sector, Water and Resource Action Program, Oxon, UK, 2006 Search PubMed.
- J. Mohn, S. Szidat, J. Fellner, H. Rechberger, R. Quartier, B. Buchmann and L. Emmenegger, Determination of biogenic and fossil CO2 emitted by waste incineration based on 14CO2 and mass balances, Bioresour. Technol., 2008, 99, 6471–6479 CrossRef CAS.
- B. Bahor, K. Weitz and A. Szargot, Updated analysis of greenhouse gas emissions and mitigation from municipal solid waste management options using a carbon balance, Proceedings of Global Waste Management Symposium, Copper Mountain, Colorado, USA, 2008 Search PubMed.
- National Encyclopaedia, 2009, http://www.ne.se Search PubMed.
- R. Clift, A. Doig and G. Finnveden, The Application of Life Cycle Assessment to Integrated Solid Waste Management, Part I - Methodology, Trans. IChemE, 2000, 78(Part B), 279–287 Search PubMed.
- G. Finnveden, Methodological Aspects of Life Cycle Assessment of Integrated Solid Waste Management Systems, Resour., Conserv. Recycl., 1999, 26, 173–187 CrossRef.
- ISO 14040 International Standard. Environmental management - Life cycle assessment - Principles and framework, International Organisation for Standardization, Geneva, Switzerland, 2006 Search PubMed.
- T. Ekvall and B. P. Weidema, System Boundaries and Input Data in Consequential Life Cycle Inventory Analysis, Int. J. LCA, 2004, 9(3), 161–171 Search PubMed.
- EASEWASTE. Data available in computer model software http://www.easewaste.dk , 2008.
- J.-O. Sundqvist, A. Baky, M. Carlsson Reich, O. Eriksson and J. Granath, Hur ska hushållsavfallet tas omhand – utvärdering av olika behandlingsmetoder (How shall the municipal solid waste be managed – assessment of different treatment methods), 2002 IVL Report 1462 (In Swedish with English summary) Search PubMed.
- G. Finnveden, A. C. Albertsson, J. Berendson, E. Eriksson, L. O. Höglund, S. Karlsson and J.-O. Sundqvist, Solid waste treatment within the framework of life-cycle assessment, J. Clean. Prod., 1995, 3, 189–199 CrossRef.
- A. Baky and O. Eriksson, Systems Analysis of Organic Household Waste Management in Denmark: Environmental Project #822, Danish Environmental Protection Agency, Copenhagen, Denmark, 2003 Search PubMed.
- A. Björklund, Environmental System Analysis of Waste Management with emphasis on Substance Flows and Environmental Impact, licentiate thesis, Department of Chemical Engineering and Technology, Division of Industrial Ecology, Royal Institute of Technology, Stockholm, Sweden (TRITA-KET-IM 1998:16, AFR Report 211) 1998 Search PubMed.
- AvfallSverige 2008c, Energy Report (Status 2006), Results of Specific Data for Energy, Efficiency Rates, Plant Efficiency Factors, NCV and Determination of the Main Energy Results of 20 Investigated Swedish W-t-E Plants, Report F2008:06, Search PubMed.
- H. Merrild, A. Damgaard and T. H. Christensen, Life cycle assessment of waste paper management: The importance of technology data and system boundaries in assessing recycling and incineration, Resour., Conserv. Recycl., 2008, 52, 1391–1398 CrossRef.
- Renova, Miljörapport 2007 för avfallskraftvärmeverket och förbehandlingsanläggningen, inklusive återvinningscentralen vid Sävenäs (Environmental report 2007 for waste CHP and pre-treatment facility, including the recycling central at Sävenäs), dnr 0222/08 (In Swedish), 2008 Search PubMed.
- S. Uppenberg, M. Brandel, L.-G. Lindfors, H.-O. Marcus, A. Wachtmeister and L. Zetterberg, Miljöfaktabok för bränslen Del 2. Bakgrundsinformation och teknisk bilaga (Environmental data on fuels Part 2: Background information and technical appendix), Swedish Environmental Research Institute (IVL), Stockholm, Sweden (IVL report B 1334 B) (In Swedish), 1999 Search PubMed.
- G. Finnveden, A world with CO2 caps, Int. J. LCA, 2008, 13, 365–367 Search PubMed.
- IPCC, Climate change 2007 - The Physical Science Basis: Contribution of Working Group I to the Fourth Assessment Report of the Intergovernmental Panel on Climate Change, Cambridge University Press, Cambridge, United Kingdom and New York, NY, USA, 2007, 996 pp Search PubMed.
| This journal is © The Royal Society of Chemistry 2009 |